00 \Year0000 \Month00 \Pagespan000000 \lhead[0]A.N. Author: Title \rhead[Astron. Nachr./AN XXX (200X) X]0 \headnoteAstron. Nachr./AN 32X (200X) X, XXX–XXX
The source content of low galactic latitude XMM-Newton surveys
Abstract
We present results from a project conducted by the Survey Science Center of the XMM-Newton satellite and aiming at the identification and characterisation of serendipitous EPIC sources at low galactic latitudes. Deep multi-colour optical imaging and spectroscopic observations have been obtained in the framework of several observing campaigns carried out at ING, CFHT and ESO. These observations have lead to a number of optical identifications, mostly with active stars. We describe the identified source content at low galactic latitudes and compare stellar populations properties at low and high galactic latitudes with those expected from stellar X-ray count models.
motch@astro.u-strasbg.fr
1 Introduction
Thanks to their excellent sensitivity, good image quality over a wide field of view (30\arcmin) and wide energy range (0.2-12 keV) the EPIC cameras on board XMM-Newton allow X-ray surveys with an unprecedented combination of large area and depth. This potential was recognised by ESA in setting up a dedicated XMM-Newton Survey Science Center (SSC) to facilitate the exploitation of the XMM-Newton Serendipitous Sky Survey by providing a public archive of data products and carrying out a carefully coordinated follow-up programme to characterise the overall X-ray source population (Watson et al. 2001).
In this paper we present results from an ongoing SSC optical campaign whose aim is to provide a reference frame for the characterisation of all low galactic latitude EPIC serendipitous detections. Beyond proper identification and classification, our objective is to study source properties, quantify their relative populations and contributions to the overall soft and hard X-ray galactic emission. XMM-Newton measurements are not strongly biased by interstellar extinction, as were earlier studies based on ROSAT observations restricted to the softer 0.5-2 keV band. Although similar in X-ray flux to the deepest ROSAT pointings, the galactic landscape unveiled by XMM-Newton differs from that seen by ROSAT. Opening new parameter spaces the present survey offers the possibility to reveal completely new classes of sources.
Many individual source types are known to contribute to the galactic X-ray source demography in the medium to low X-ray luminosity regime (). These include, late and early-type stars, cataclysmic variables (CVs), RS CVns and various species of X-ray binaries. Other kinds of rare emitters such as isolated neutron stars or low-luminosity but long-lived evolutionary states of classical XRBs may be found.
2 Observational material
Target fields (see Table LABEL:fields) were selected for their good X-ray quality (depth and low background) and chosen in directions void of extended diffuse emission or bright sources. We also avoided atypical regions such as known star forming complexes. Mainly based on EPIC pn data, source detections were visually screened and positions were in most cases corrected for residual attitude errors by cross-correlating them with large optical catalogues. In order not to exclude extreme sources we retained detections in all energy bands.
Optical data were collected in the framework of the AXIS project (Barcons et al. 2002) performed at the Observatorio del Roque de los Muchachos in the Canary Islands and from programmes conducted at CFHT and at ESO. The wide field camera at INT, the CFH12K at CFHT and the WFI at ESO-MPG 2.2m provided wide-field imaging in the g’, r’, i’, z, R, I and H / H continuum from which high spatial resolution mapping of the error circles and candidate priorities for spectroscopic observations were derived. Medium to low resolution spectroscopy was obtained on 4m-class telescopes using multi-fiber instruments (WHT/WYFFOS) or long slit spectrographs (WHT/ISIS, ESO 3.6m/EFOSC2).
| Field | RA | Dec | l | b | Gal NH |
|---|---|---|---|---|---|
| WR 110 | 18h07 | -19\degr23\arcmin | 10.8\degr | +0.4\degr | 5.5 1022 |
| Ridge3 | 18h27 | -11\degr29\arcmin | 20.3\degr | +0.0\degr | 1.1 1023 |
| G21.5-09 | 18h33 | -10\degr34\arcmin | 21.5\degr | -0.9\degr | 9.0 1022 |
| Z And | 23h33 | +48\degr49\arcmin | 109\degr | -12.1\degr | 1.4 1021 |
The total area surveyed so far is 0.8 deg2. With exposure times in the range of 10 to 30 ksec we reach flux limits of 4 10 -15 erg cm-2 s-1 in the 0.5 to 2.0 keV soft band and of 3 10 -14 erg cm-2 s-1 in the 2 to 10 keV hard energy range. The present survey can thus be qualified as medium sensitivity in being about 10 times shallower than the Chandra deep galactic survey of Ebisawa et al. (2002) but 10 times deeper than the medium ROSAT survey of Morley et al. (2001) or than the faint ASCA galactic plane survey of Sugizaki et al. (2001).
In order to compare stellar population properties in the galactic plane with those observed at high galactic latitudes we also use stellar identifications obtained in the course of the high AXIS programme (Barcons et al. 2002). The sample consists of 34 stars extracted from 18 XMM-Newton fields ( = 23\degr 80\degr, average value 50\degr) in a total survey area of 2.3 deg2. The flux limit is 2 10 -14 erg cm-2 s-1 in the 0.5 to 4.5 keV band slightly above that used in the galactic plane.
3 Identification Strategy
Identification of XMM-Newton sources in the Milky Way can be made difficult by optical crowding. Matching the pattern of EPIC sources with the USNO A-2 catalogue and then correcting for residual attitude errors can shrink the 90% confidence level error radius down to 2.5\arcsec. However if field stellar density is too high, no such adjustment can be made and the 90% confidence level error radius remains of the order of 4.5\arcsec. Based on our wide field imaging we estimate that at 0\degr the probability to find at random a star brighter than R 16 - 17 in a typical EPIC error circle is low enough (5%) that we can accept the identification on the basis of positional coincidence. However, in many cases this argument cannot be used and we have to collect optical spectra of typically 3-4 candidates brighter than R 22 before possibly finding a reliable identification. At the sensitivity of our survey, stellar counterparts fainter than R 16 - 17 are mostly late K-M stars. Balmer emission is found in all active M stars and in a fraction of the most active K stars. Cataclysmic variables and Be/X-ray binaries are also H emitters. Our narrow band H and H continuum imaging together with broad band colour information can thus be used to efficiently prioritize optical candidates for spectroscopy (Herent et al. 2002). We also discarded sources with hardness ratios consistent with those expected from an absorbed background AGN and with only faint optical candidates in the error circle. This selection is efficiently done in directions of high absorption and still leaves a large range of possible NH (or intrinsic spectral hardness) for galactic objects.
| Field | G21.5-09 | Ridge3 | WR 110 | Z And | Total |
|---|---|---|---|---|---|
| -0.9\degr | 0.0\degr | +0.4\degr | -12.1\degr | ||
| Area | 0.27 | 0.18 | 0.18 | 0.18 | 0.81 |
| Number of sources | 77 | 30 | 58 | 38 | 203 |
| Stellar coronae | 15 (19%) | 14 (47%) | 29 (50%) | 9 (24%) | 67 |
| Accreting candidates | 2 | 0 | 1 | 0 | 3 |
| Extragalactic sources | 1 | 0 | 0 | 2 | 3 |
| Unidentified | 59 (77%) | 16 (53%) | 28 (48%) | 27 (71%) | 130 |
4 Optical identifications
We list in Table LABEL:ids the statistics of optical identifications in each field and for the entire galactic sample. The limiting magnitude defined here as the faintest magnitude at which we can detect emission lines typical for a CV or a Me star depends on the instrumental setting and is R 19 for the G21.5-09 and Z And fields and R 21 for the Ridge 3 and WR 110 fields. The vast majority of optical identifications are with active coronae. Because of the relatively high galactic latitude and correspondingly low NH it was still possible to spectroscopically identify two AGN in the Z And field. At lower latitudes, galactic absorption becomes too large for our instrumentation. The only low extragalactic source is in the field of G21.5-09 (XMMU J183225.4-103645, Nevalainen et al. 2001) and was identified as an X-ray bright cluster of galaxies seen through over 50 magnitudes of absorption in the visual on the basis of X-ray source extent and energy distribution.
4.1 Accreting candidates
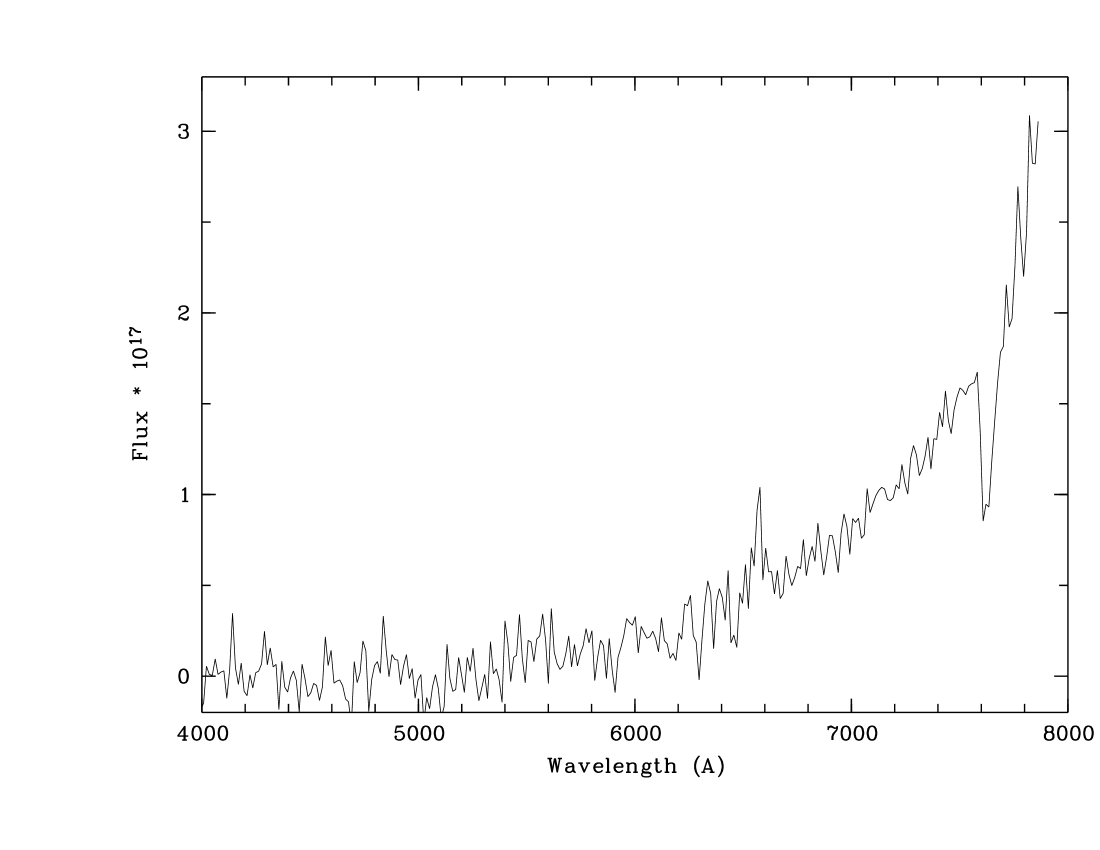
In three cases, we detect X-ray emission from a Be star at a level which is slightly above that expected for ’normal’ early type stars (Cassinelli et al. 1994). In addition to the case of SS 397 already mentioned in Motch (2000), we find excess X-ray emission from USNO 0750-13549725 which is the brightest star in the open cluster NGC 6649. At a distance of 1.6 kpc and with E(B-V) = 1.38 (Turner 1981) the X-ray luminosity is 4 1032 erg s-1 (0.5 - 7.5 keV). Finally, we detect H emission from a faint red star (R = 22.0, R-I=2.6) in the field of WR 110. The absence of TiO features and the colour index indicate high interstellar absorption (see Fig. 1). If the counterpart is an intrinsically blue object then Av is of the order of 12.5 or NH = 2.2 1022 cm-2, i.e. about half of the total expected galactic absorption in that direction. The high interstellar reddening and accordingly large distance rules out a CV nature. A Be star identification seems likely and the star would then be at 12 kpc implying an X-ray luminosity of 1.3 1033 erg s-1 (0.5 - 7.5 keV). Such modest X-ray luminosity excesses may be in part due to errors on the reddening. We note however, that the numerous Be + WD systems predicted by binary evolution theory could well be emitting in this range of luminosities (see Raguzova 2001 and references therein).
4.2 The stellar population
At very low galactic latitudes, the fraction of sources identified with active coronae varies very significantly with pointing direction. Whereas in the WR 110 and Ridge 3 fields stellar coronae account for about half of the X-ray sources, the fraction is only 19% in the field of G21.5-09 in spite of the fact that source density is similar to that of WR 110. Such a variance is not unexpected and could reflect the presence of a higher ’local’ absorption in the field of G21.5-09 preventing spectroscopic identification of the globally optically dimmer stellar population.
Spectral types, distances and luminosities were derived for most stellar identifications in the WR 110 and Ridge 3 fields as well as for the high galactic latitude sample (see Table LABEL:sptypes).
In both 0\degr fields, the mean B-V excess of X-ray active stars is about 0.6 (or NH 3.5 1021 cm-2). We detect active coronae up to 500 pc in Ridge 3 and 1 kpc in WR 110.
At the flux level considered here ( 4 10 -15 erg cm-2 s-1 in the 0.5 to 2.0 keV band), the low active star population displays a distribution in spectral types which is not statistically different from that seen at high . The low latitude ROSAT survey (Motch et al. 1997) also exhibits a similar spectral type distribution in spite of a factor 25 lower sensitivity (see Table LABEL:sptypes). At low and high latitudes, the observed distributions match well those expected from X-ray count models (Guillout et al. 1996, Guillout & Motch 2002). In particular, we are not yet in a flux regime faint enough for M stars to dominate at high latitudes. Deeper surveys could however reveal this effect.
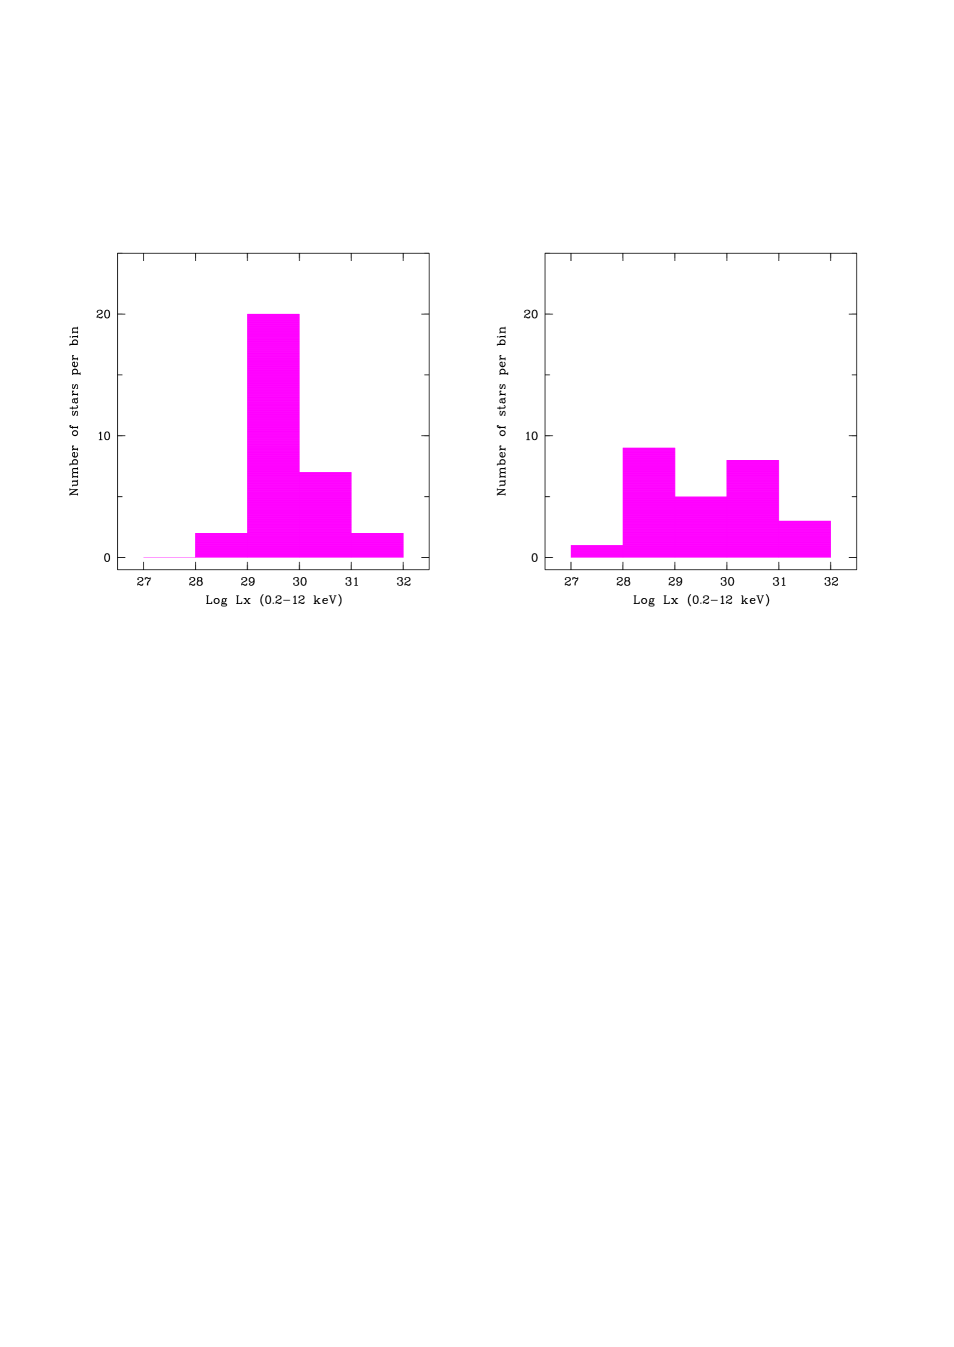
The distribution in X-ray luminosity of the two 0\degr stellar samples and of the 50\degr sample is shown in Fig. 2. In the galactic plane, Lx peaks between 1029 and 1030 erg s-1, typical for stars with ages of the order of that of the Pleiades ( 108 yr, see e.g. Micela et al. 1990). In contrast, the Lx distribution at high shows two peaks, one between 1028 and 1029 erg s-1 and one at very high Lx between 1030 and 1031 erg s-1. The low luminosity component has a solar like X-ray luminosity typical for the relatively old stellar population preferentially detected at high latitudes. The origin of the high luminosity component is not yet clear. It could be due to close binaries such as RS CVns for which synchronized rotation maintains a strong X-ray luminosity over a long time. Alternatively, a fraction of these high Lx stars could be misidentifications.
| XMM-Newton : Observed and Model prediction | ||||
|---|---|---|---|---|
| M | K | G | F+A | |
| 0\degr | 28.6 6.4 | 32.7 6.7 | 22.4 6.0 | 16.3 5.3 |
| 24 | 25 | 31 | 20 | |
| 50\degr | 29.4 7.8 | 17.6 6.5 | 23.5 7.3 | 29.4 7.8 |
| 27 | 19 | 29 | 25 | |
| ROSAT all-sky survey | ||||
| M | K | G | F+A | |
| 0\degr | 19.0 6.0 | 23.8 6.5 | 26.2 6.8 | 30.5 7.1 |
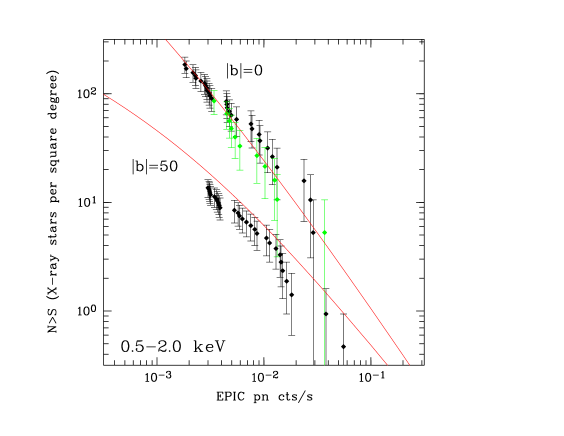
We also show in Fig. 3 the log N(S)-log S curve for stars at low and high galactic latitudes. At EPIC pn count rates of a few 10-3 cts/s (0.5 - 2.0 keV), the density of active stars is about 10 times larger in the galactic plane (here only Ridge 3 and WR 110 fields) than at high . Predictions of the stellar population models for = 0\degr and 50\degr fit rather well the observed curves. One should however keep in mind the large density variance observed at low latitudes. As argued above, part of this scatter could be due to complex absorption structures which are not yet taken into account in the X-ray count model. X-ray luminous old binaries may also account for a sizeable fraction of the population. Clearly more stellar identifications are needed in order to build really representative samples.
5 Conclusions
Not unexpectedly, our observations confirm the well known concentration of young active stars in the galactic plane. Because of the steep decline of coronal activity with age, X-rays highlight the young stellar population. Whereas at optical wavelength stars younger than 1 Gyr make up only 10% of the total stellar population and do not exhibit marked signatures, they account for about half of the X-ray detections, the exact fraction depending on galactic latitude and limiting flux. The large sensitivity of XMM-Newton allows to sample young stellar populations up to 1 kpc or more as demonstrated in the WR110 field. At these distances, a number of effects expected from X-ray stellar populations models become readily visible and can be used to put very significant constraints on the dynamical properties of young stars, especially the evolution of scale height with age, and on the SFR during the last 2 Gyr. Among these effects are the sharp decrease of number count with increasing galactic latitudes, the rising fraction of old stars at high and the increasing fraction of M stars at faint fluxes.
References
- [1] Barcons, X, Carrera, F.J., Watson, M.G., et al., 2002, A&A, 382, 522
- [2] Cassinelli, J.P., Cohen, D.H., MacFarlane, J.J., Sanders, W.T., Welsh, Y., 1994, ApJ, 421, 705
- [3] Ebisawa, K., Bamba, A., Kaneda, H., Maeda, Y., Paizis, A., Sato, G., Yamauchi, S., 2002, astro-ph/0203070, in Proceedings of the Symposium on ‘New Visions of the X-ray Universe in the XMM-Newton and Chandra Era’, 26-30 November 2001, ESTEC, The Netherlands
- [4] Guillout, P., Haywood, M., Motch, C., Robin, A. C., 1996, A&A, 316, 89
- [5] Guillout, P., Motch, C., 2002, this volume
- [6] Herent, O., Motch, C., Warwick, R., Wheatley, P., Guillout, P., 2002, this volume
- [7] Micela, G., Sciortino, S., Vaiana, G.S., Harnden, F.R., Rosner, R., Schmitt, J.H.H.M., 1990, ApJ, 348, 557
- [8] Morley, J.E. Briggs, K.R., Pye, J.P., Favata, F., Micela, G. Sciortino, S., 2001, MNRAS, 326, 1161
- [9] Motch, C., 2000, ASP Conf Series 232, p16
- [10] Motch, C., Barcons, X., Carrera, F., et al., 2002, (astro-ph/0203025), in Proceedings of the Symposium on ‘New Visions of the X-ray Universe in the XMM-Newton and Chandra Era’, 26-30 November 2001, ESTEC, The Netherlands
- [11] Motch, C., Guillout, P., Haberl, F., Pakull, M., Pietsch, W., Reisnch, K., 1997, A&A, 312, 111
- [12] Nevailanen, J., Lumb, D., dos Santos, S. et al., 2001, A&A 374, 66
- [13] Raguzova, N., 2001, A&A, 367, 848
- [14] Sugizaki, M., Mitsuda, K., Kaneda, H., Matsuzaki, K., Yamauchi, S., Koyama, K., 2001, ApJS 134, 77
- [15] Turner, D.G., 1981, AJ, 86, 231
- [16] Watson, M. G, Augu res, J.-L., Ballet, J. et al., 2001, A&A 365, L51