The rotational velocity of the sdOB primary of the eclipsing binary system LB 3459 (AA Dor)††thanks: Based on observations made with ESO Telescopes at the Paranal Observatories under programme ID 66.D-1800.
We present an analysis of the rotational velocity of the primary of LB 3459 based on 107 new high-resolution and high-S/N ESO VLT UVES spectra. 105 of them cover a complete orbital period (0.26 d) of this binary system. We have determined an orbital period of , a radial velocity amplitude of , and . From simulations of the He II Å line profile (based on NLTE model atmosphere calculations), we derive .
We present an animation which shows the orbital movement of the binary system, its synthetic lightcurve, and compares the phase-dependent variation of the predicted with the observed He II Å line profile.
The radius of the cool component is almost the same size like Jupiter but its mass is about 70 times higher than Jupiter’s mass. Thus, from its present mass (), the secondary of LB 3459 lies formally within the brown-dwarf mass range (). It might be a former planet which has survived the previous common-envelope phase and even has gained mass.
Key Words.:
stars: binaries: eclipsing – stars: fundamental parameters – stars: individual: LB 3459 – stars: individual: AA Dor – stars: low-mass, brown dwarfs – stars: rotation1 Introduction
LB 3459 is a close binary () consisting of a sdOB primary star and an unseen secondary with an extraordinary small mass. Based on the assumption that the primary component has a mass of , Hilditch et al. (1996, hereafter HHH) found that the cool secondary with is in excellent agreement with lowest mass ZAMS models of Dorman et al. (1989).

In a recent spectral analysis (Rauch 2000) of the primary, based on high-resolution CASPEC and IUE spectra, has been derived from comparison of and to evolutionary tracks of post-RGB stars (Driebe et al. 1998). has subsequently been calculated from the system’s mass function. Thus, the secondary is formally a brown dwarf ().
HHH found that LB 3459 lies in that region of the Hertzsprung-Russell diagram appropriate for binaries undergoing late case B (Roche lobe filled just before central helium ignition) mass transfer (Iben & Livio 1993) followed by a common-envelope (CE) phase.
An alternative CE scenario has been studied by Livio & Soker (1984). They found that in star–planet systems, when the star evolves into a red giant, the planet may survive the CE phase when its intial mass is above . Then the planet can accrete from either the stellar wind or directly from the giant’s envelope. Thus, it appears possible that the secondary of LB 3459 had formerly been a planet which has transformed into a low-mass stellar component.
However, the mass-radius relation of LB 3459 derived from the mass function and the light-curve analysis (Kilkenny et al. 1981) does not intersect with the empirical result of Rauch (2000). The reason for this is unclear. Two possible reasons are that the theoretical models by Driebe et al. (1998) are not applicable to the case of LB 3459 and the uncertainty for the photospheric parameters in Rauch (2000).
Since the analysis of Rauch (2000) was hampered by the relatively long exposure times (1 h and 2 – 3 h, respectively) and hence, a relatively large orbital velocity coverage (the observed line profiles were broadened by the star’s rotation as well as by a smearing due to orbital motion within the observations), it has been speculated that from Rauch (2000) is somewhat too low. In order to make progress and to minimize the effects of orbital motion, spectra with short exposure times (180 sec) have been taken with UVES attached to the ESO VLT (Kueyen) which cover a complete orbital period (Sect. 2). From these spectra, the radial-velocity curve of LB 3459 is determined (Sect. 3). In Sect. 4 we will have a close look onto the spectral changes during the transit of the cool component. From those spectra with a minimum effect of orbital smearing ( at maximum, Fig. 1), we can then derive (Sect. 5).
2 Observations
Two UVES spectra have been taken on Jan 6, 2001, with an exposure time of 180 sec each. Then the run was stopped although the night had been photometric. It was restarted on Jan 8, 2001, and 105 UVES spectra were taken in a partly cloudy night. The improvement by the short exposure time is shown in Fig. 1. We used a slit width of projected at the sky and arrive at a resolving power . The spectra of Jan 8 cover a complete orbital period of LB 3459.
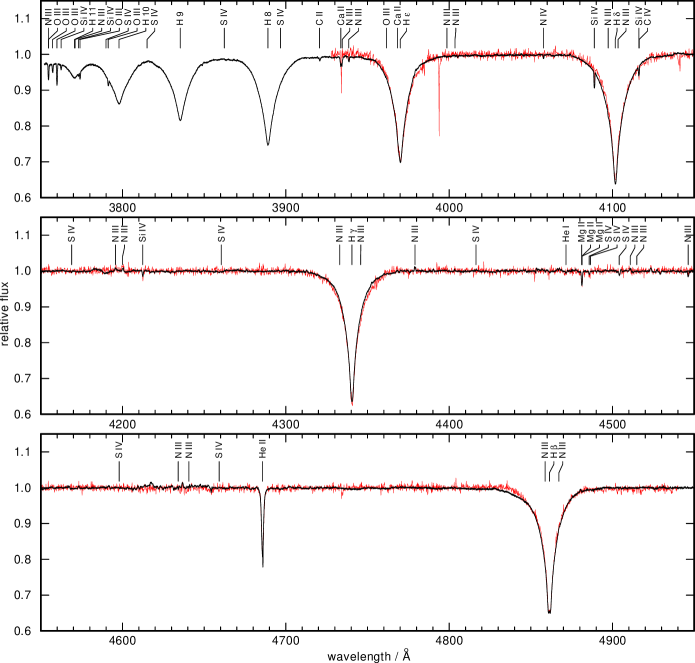
The spectra were subject to the standard reduction provided by ESO. The S/N ratio of the single spectra is about while from the results of the UVES exposure-time calculator we had expected at a resolution of 35 000. In Fig. 2 we show our co-added spectrum: All 105 spectra (Jan 8) were shifted to the rest wavelength, then co-added and subsequently binned to (3 wavelength points). Although the S/N of the co-added UVES spectrum is about 200, no chemical element could be identified which had not been detected in other spectra before (Rauch 2000).
3 Radial velocity
| No. of measurements | / sec | data source | |
|---|---|---|---|
| 105 | 22643. | 921 | Jan 8 |
| 107 | 22601. | 138 | Jan 6 + Jan 8 |
| 131 | 22600. | 702 | Jan 6 + Jan 8 + hhh |
| 24 | 22590. | 326 | hhh |
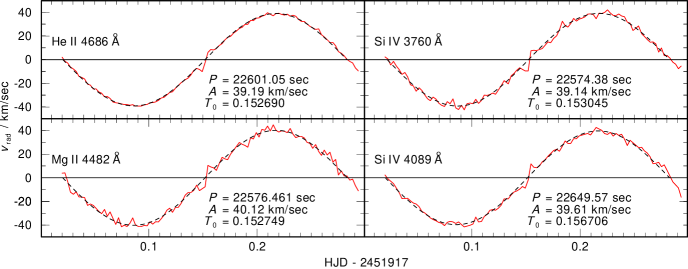
In the first step, the phase-dependent radial velocity is determined by fitting Lorentzians to H – H , He II Å, Mg II Å, and Si IV Å in all 107 spectra. Other lines have been checked but turned out to be useless: C II Å (too weak), Si IV Å (blends with H and C IV, respectively), and O III Å (too weak). During this procedure the smearing due to orbital motion during the exposure was neglected because the exposure time (Sect. 1) is very short compared to the orbital period. Then, the derived velocity curves were fitted by sine curves in order to determine their periods, amplitudes, and .
The orbital period has been determined from the complete data set because the 107 spectra provide a time line of 9 periods which increases the accuracy. For the amplitude and determinations, we use only the 105 spectra of Jan 8 because the scatter in the two spectra of Jan 6 increase the scatter in the results artificially. The times (including heliocentric correction) are the middles of the exposures. The results are summarized in Fig. 3.
Since the observed He II Å line is the sharpest line in the optical spectrum (Rauch 2000), we achieve obviously (Fig. 3) the best fit to a theoretical sine curve with the velocity curve measured from this line (the same line had been used by hhh). Mg II Å is also sharp but much weaker and the Balmer lines are much broader and the S/N is lower. The measured amplitude of the velocity curve appears to be larger for the higher Balmer lines. This is clearly an effect of the lower S/N. Thus, we decided to use only He II Å for the period determination. Moreover, hhh provide 24 additional measurements of the radial-velocity curve of LB 3459 based on He II Å which extends the time base up to 9692 periods. In Table 1, we summarize the results based on different datasets.


From the result of the dataset of He II Å which includes additionally the hhh data (Table 1), we adopt and (Fig. 4). The period is only 0.02% longer than given by Kilkenny et al. (1991, 22 597.0 sec from photometric data of 27 eclipses). A higher radial-velocity amplitude of has been measured by hhh from their observations of He II Å.
4 The transit of the cool companion
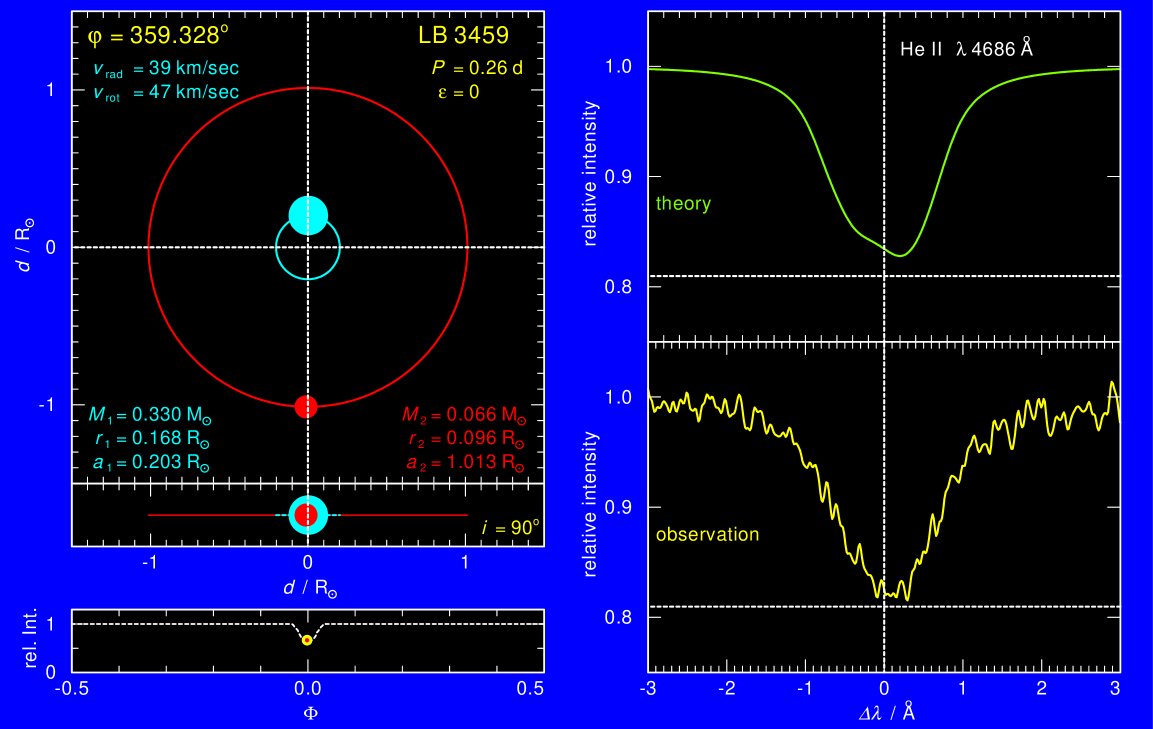
The transit of the cool companion is clearly visible in the radial-velocity curves (Fig. 3). An inspection of the observed He II Å line profiles during this transit shows a decrease of the central depression close to (Fig. 5).
In order to simulate the phase-dependent variation of the line profile of He II Å, we have set up a surface grid (with 25 azimuth and 25 altitude points) on the primary, and added up the spectra from these grid points with correct projected and consideration of limb darkening, calculated from the final model atmosphere for LB 3459 (Fig. 6).
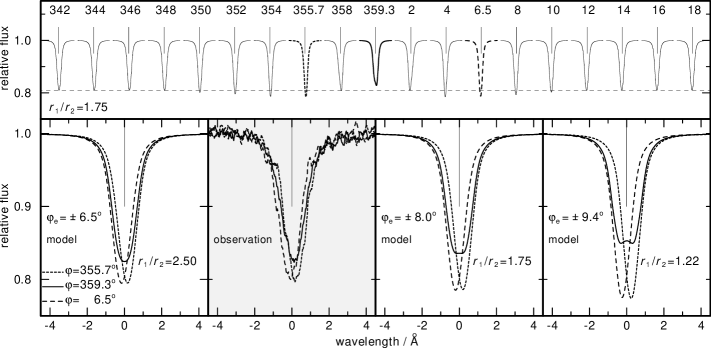
During the transit of the cool companion, the hidden parts of the primary’s surface do not contribute to the resulting spectrum (Fig. 8). It can be seen that the line profile during the transit is first redshifted, then blueshifted, as can be expected. This can be seen as well in the radial-velocity curves (Fig. 3). At the begin and the end of the eclipse, the line profile appears deeper (Rossiter effect, Rossiter 1924). In addition, at the central eclipse, the line profile is shallower compared to phases shortly before and after. This is an effect of limb darkening, and it is qualitatively reproduced by our model atmosphere. From the comparison of the He II Å line profile at selected orbital phases (), appears to be at its upper limit (Fig. 3). It is worthwhile to note, that a phase-resolved spectroscopic study of line-profile variation gives the radius ratio independently from light-curve analysis — if the quality of the spectra and the phase resolution are sufficient.
We have produced a short animation (available at the CDS) which shows all our observed spectra compared to the simulation as well as a view onto the orbital movement of the binary. In Fig. 7 we show a snapshot of this animation.
5 Rotational velocity of the sdOB primary
The maximum change of during a 180 sec-exposure of LB 3459 is (Fig. 1) and thus, the “line-broadening” effects of smearing due to orbital motion are small. Since the S/N of a single of our UVES spectra is about 20 (in average), we decided to co-add all spectra (Fig. 2) in order to achieve the maximum S/N ratio. The alternative, to select only those spectra where is below a certain limit, e.g. smaller than , and to reduce the orbital smearing would reduce the percentage of spectra to co-add to 15 % — resulting in a much lower S/N.
Since the resolution of the spectra is better than 0.1 Å (at the position of He II Å), we checked whether it is necessary to consider the fine-structure splitting of He II Å. In Fig. 9 we show that this results in a wider line profile and cannot be neglected, otherwise the helium abundance is strongly overestimated.

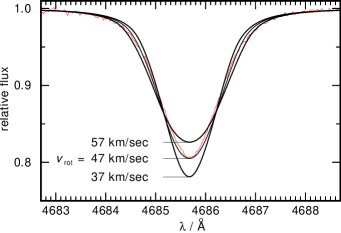
We calculated a grid of H+He composed NLTE model atmospheres in the relevant parameter range, i.e. (in steps of 1 kK), (0.05, cgs), (, number ratios), and calculated theoretical line profiles of He II Å. We performed a test (wavelength, flux level, , , HeH, and ) in order to determine the rotational velocity. The lowest reduced value (0.44) is found at , , , and . However, Rauch (2000) has determined from ionization equilibria (He I / He II, C III / C IV, N III / N IV/ N V, O IV / O V) which are very sensitive indicators for , and from the broad hydrogen Balmer lines. Since the error ranges are small, we have to keep these values fixed. Then, and yield the best fit. In Fig. 10 the co-added spectrum is compared with theoretical line profiles of He II Å which are convolved with rotational profiles with different rotational velocities and subsequently with a Gaussian of 0.1 Å (FWHM) in order to account for the instrumental profile. From this comparison we have estimated an error range of for in this analysis.
The HeH ratio is the same as found by Rauch (2000) who used CES spectra with a resolution of 0.1 Å. Since the exposure time of the CES spectra had been 3600 sec, the orbital smearing (Fig. 1) and the lower S/N of about 20 made the fine-structure splitting (Fig. 9) unimportant.
6 Dimensions of LB 3459
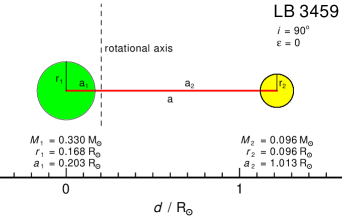
With the orbital period and the radial velocity amplitude we can calculate the circumference and radius of the primary’s orbit. From the relation we can derive parameters for the secondary. The components’ separation is . Kilkenny et al. (1979) have given formulae for the radii of the components: and derived from the light curve. The calculated values are summarized in Table 2. In Fig. 11 the dimensions of LB 3459 are illustrated.
| 22600. | 702 | 0. | 005 | sec | |
|---|---|---|---|---|---|
| 2451917. | 152690 | 0. | 000005 | HJD | |
| 39. | 19 | 0. | 05 | km/sec | |
| 1. | 4097 | 0. | 0021 | ||
| 8. | 8572 | 0. | 0130 | ||
| 0. | 2025 | 0. | 0019 | ||
| 195. | 95 | 6. | 55 | km/sec | |
| 7. | 0485 | 0. | 2321 | ||
| 1. | 0127 | 0. | 0335 | ||
| 4. | 4287 | 0. | 1458 | ||
| 8. | 4582 | 0. | 2342 | ||
| 1. | 2153 | 0. | 0354 | ||
| 1. | 1672 | 0. | 0323 | ||
| 0. | 1678 | 0. | 0047 | ||
| 0. | 6682 | 0. | 0184 | ||
| 0. | 0960 | 0. | 0003 |
We calculate for the primary. This is about smaller than derived by Rauch (2000) from . Although is determined by comparison of and to theoretical models (Sect. 1), itself is the main error source in this formula — a change of 0.3 in (factor 2 in ) would change only by a few percent. Since all values of Table 2 have been calculated straightforward, the errors are mainly propagation errors. This may be a hint for a higher than determined by Rauch (2000).
However, the velocity value of for bound rotation following Rauch (2000), i.e. calculated with and would be smaller by as well. Then, the present rotational velocity is much higher than this value. For this paper, we decided to adopt and . However, the origin of this discrepancy needs further investigation.
7 Results and discussion
We have determined the orbital period of LB 3459 from the newly measured radial velocity curve in good agreement with previous values of Kilkenny et al. (1991). Together with data from hhh we could strongly reduce the error limits (Table 2).
We derived a rotational velocity of the primary of LB 3459 of which is in its error limits in agreement with found by Rauch (2000). For , this is equivalent to a bound rotation. If the radius is (Sect. 6), then the primary rotates about 40% faster than bound.
The radius of the cool component is which is almost the same size like Jupiter () but its mass is about 1/15 M⊙ which is much higher than Jupiter’s mass (1/1047 M⊙). Thus, from its present mass, the secondary of LB 3459 lies formally within the brown-dwarf mass range (). The numerical simulations of star–planet systems presented by Livio & Soker (1984) show that a critical mass exists above which it is possible that a planet with gains mass during a CE phase. Due to a simplified treatment of accretion and evaporation (Iben & Livio 1993) in the work of Livio & Soker (1984), improved calculations of star–planet systems are highly desirable to verify the idea of Rauch (2000), that the secondary of LB 3459 is a former planet.
From the comparison of He II Å to the co-added UVES spectrum (Fig. 10), the helium abundance of found by Rauch (2000) has been confirmed by the use of spectra with higher S/N and higher resolution. Moreover, the rotational velocity found here is very close to the value of which had been adopted by Rauch (2000) in his analysis.
Although the quality of the co-added UVES spectrum is much higher than previously available spectra, no elements have newly been detected in it.
The reason for the discrepancy between primary and secondary masses derived from spectral analysis and those from the radial-velocity and the eclipse curves (Sect. 1) is still unclear — although some problems in the spectral analysis due to uncertain rotational broadening and smearing due to orbital motion could be ruled out. There is a hint, that the surface gravity may be slightly higher than determined by Rauch (2000). If true, this would solve the problem with the discrepancy. Unfortunately, significant effects of changes in are detectable only in the outer line wings where the data reduction of the broad Balmer lines in the echelle spectra is not very accurate.
To summarize, there is no reason to perform a new spectral analysis of LB 3459 based on the new optical UVES spectra. However, it is highly desirable to obtain high-resolution and high-S/N spectra in the UV/FUV in order to improve the determination of based on ionization equilibrium of metals, to improve the determination of by the evaluation of the higher members of the Lyman series, and to identify other elements beside C, N, O, Si, Mg, Fe, and Ni in order to prove likely diffusion effects found by Rauch (2000).
Acknowledgements.
The UVES spectra used in this analysis were obtained as part of an ESO Service Mode run, proposal 66.D-1800. We like to thank Stefan Dreizler and Jörn Wilms for their assistance in IDL programming, and Christian Karl for help in the data reduction. Computations were carried out on CRAY computers of the Rechenzentrum der Universität Kiel. This research has made use of the SIMBAD Astronomical Database, operated at CDS, Strasbourg, France. This research was supported by the DLR under grants 50 OR 9705 5 and 50 OR 0201.References
- (1) Dorman, B., Nelson, L.A., & Chau, W.Y.1989, ApJ, 342, 1003
- (2) Driebe, T., Schönberner, D., Blöcker, T., & Herwig, F. 1998, A&A, 339, 129
- (3) Hilditch, R.W., Harries, T.J., & Hill, G. 1996, MNRAS, 279, 1380
- (4) Iben, I.Jr., & Livio, M. 1993, PASP, 105, 1373
- (5) Kilkenny, D., Penfold, J.E., & Hilditch, R.W. 1979, MNRAS, 187, 1
- (6) Kilkenny, D., Hill, P.W., & Penfold, J.E. 1981, MNRAS, 194, 429
- (7) Kilkenny, D., Harrop-Allin, M., & Marang, F. 1991, Inf. Bull. on Variable Stars, No. 3569
- (8) Livio, M., & Soker, N. 1984, MNRAS, 208, 763
- (9) Rauch, T. 2000, A&A, 356, 665
- (10) Rossiter, R.A., 1924, ApJ, 60, 15
- (11) Unsöld, A. 1968, Physik der Sternatmosphären, ber. Nachdruck der 2.Auflage, Springer, Berlin