Luminous Lyman Break Galaxies at z5 and the Source of Reionization11affiliation: Based on observations collected at the Very Large Telescope part of the European Southern Observatory, Cerro Paranal, Chile
Abstract
We have discovered six galaxies with spectroscopically confirmed redshifts of in a single 44 square arcminute field imaged deeply in and bands. All the spectra show an emission-line in the region around 7000-8400Å with a spectroscopically-detected faint continuum break across the line. These six were drawn from 13 sources with and in the field, this photometric cut designed to select galaxies at . The line fluxes range between 0.2 to 2.510-17 ergs cm-2 s-1 indicating luminosities of around 1042-43 ergs s-1 for Ly and their high emission line equivalent widths suggest very young ages (108 yrs). A further line-emitting object with no detectable continuum was serendipitously detected by spectroscopy. If this line is Ly then it is from a source at , making this the most distant galaxy known. However, the redshift cannot be considered secure as it is based on a single line. No broad emission line objects (quasars) were detected. The 13 sources at are less than that expected if the luminosity function of dropout galaxies remained unchanged between and , although the deficit is not highly significant given possible cosmic variance. The UV luminosity density from galaxies brighter than our flux limit is considerably less than that necessary to keep the volume probed by our field at ionized. These galaxies are observed within several hundred Myr of the end of the epoch of reionization (), with little time for the luminosity function to evolve. This, and the lack of detected quasars, imply that the bulk of the UV flux that reionized the universe came from faint galaxies with .
1 Introduction
While progress has been made in our understanding of how galaxies formed and evolved by studying the dynamics, morphologies, and stellar populations of low redshift galaxies, a complete physical picture can only be obtained by actually witnessing the important physical processes in situ. With this in mind there has been an explosion in the number of galaxies and QSOs discovered at the highest redshifts (z5; e.g., Hu et al., 2002; Ellis et al., 2001; Stern & Spinrad, 1999; Dey et al., 1998; Fan et al., 2001; Rhoads et al., 2002). These galaxies have been found using a variety of techniques ranging from narrow-band imaging, to accidental alignments of spectroscopic slits on high redshift objects, to using the drop-out technique (Lyman Break galaxies – LBGs) pioneered by Steidel and collaborators. Such a diversity of approach is necessary in order to make a full census of the high redshift population. Without such a census, it is impossible to elucidate the physical processes that drive galaxy evolution at the highest redshifts. Moreover, to find the objects that may have reionized the universe probably means that we will have to obtain a full luminosity function of the most plausible objects such as QSOs, massive stars in galactic fragments, or perhaps even something more exotic (e.g., Loeb & Barkana, 2001).
In the present paper, we describe a program to find faint continuum-emitting objects at z5.5. Our hope was to detect objects at an epoch close enough to that of reionization so that we could determine whether UV luminous galaxies or quasars caused the reionization. We selected a redshift range which is lower than is generally considered for appropriate for the complete reionization of the universe (see review by Loeb & Barkana, 2001; Fan et al., 2001) because before the universe is substantially ionized, Ly may be effectively suppressed by resonant scattering of the Ly by the neutral intergalactic medium or by the damping wings of a largely neutral medium. Thus at or before the epoch of reionization, there may be no observable Ly emission with which to obtain redshifts. Also, the ionizing photon density necessary to reionize the intergalactic medium increases as (1+z)3 (Madau, Haardt, & Rees, 1999) and it is unlikely that the ionizing photon output of the LBGs was the sources of reionization even if such output remained constant from z=3 to the reionization at z6 (Ferguson, Dickinson, & Papovich, 2002). Moreover, the time scale between redshifts of 5.5 and 7 to 10, which is the current best estimate for when reionization likely occurred (Loeb & Barkana, 2001, and references therein), is less than several hundred Myrs for any reasonable cosmology. Over such a short time scale, while individual galaxies may evolve rather dramatically, it is unlikely that the galaxy number density could evolve very strongly (hierarchical merger models suggest that it is likely only to be a factor of a few, e.g., Sokasian et al., 2003; Ciardi, Stoehr, & White, 2003). Given these competing constraints, gauging the ionizing photon density at high redshifts soon after the likely epoch of reionization may provide a highly significant determination of the types of galaxies that were responsible for reionization. Therefore, for the source of ionization to be galaxies, we seek a population of galaxies which are still line emitting (i.e., actively forming stars), with a UV photon density sufficient to keep the intergalactic medium (IGM) ionized at the observed epoch, and with significant UV continua suggestive of prolonged star-formation (Leitherer et al., 1999; Sullivan et al., 2000) which is sufficient to ionize the IGM at higher redshifts. If reionization is due to QSOs, then we would need to observe many more QSOs than would be predicted by extrapolating to low luminosity the QSO luminosity function of Fan et al. (2001) for very luminous QSOs (MB26).
2 Observations and Object Selection
2.1 Broad-band Observations
We obtained deep multi-color broad band observations of an approximately 44 arcmin2 field using the imaging spectrograph FORS2 on UT4 of the VLT. The field was chosen to have minimal extinction from the maps of Schlegel, Finkbeiner, & Davis (1998), low (cirrus) 100m emission, to be south of the latitude of the VLT (to point out of the prevailing winter wind) and to be easily observable from June through to October. The data were obtained in “service mode” on the nights of June 17, July 6, 7, and 12, 2002. The data were taken as a sequence of dithered exposures with a net integration time of 2.6 hours in , 1 hour each in the and bands. The images were processed in the standard way but were flat-fielded using images generated by masking out all pixels with surface brightnesses between 3 sigma of the background noise and then averaged without the images being aligned. Constructing the flat-field frame in this manner resulted in final images that are characterized by background levels across the image that are flat to within much better than 1% of the average value. The final combined image had a noise level consistent with that expected from Poissonian statistics given the sky background and number of individual exposures. Conditions were photometric throughout the observations. The final calibration was determined through observations of stars in the field of PG1323-086 and Mark A (Landolt, 1992) for the and filters and by observations of the spectrophotometric standard LTT377 (Hamuy et al., 1994) for the band filter. The final images each has a total area over which the total integration time contributes to the signal of 44 square arc minutes. The 3 detection limits in a 2 arc second diameter circular aperture are =27.8, =26.7, and =26.0. The detection limits are consistent with those expected from the count-rates and sky backgrounds (i.e., the uncertainties in the photometry do not have significant contributions from errors in the flat-fielding or any other calibration used in the data reduction).
2.2 Object Selection for the Multi-Object Spectroscopy
After the images were completely reduced and the flux calibration determined, we then made an object catalog using the galaxy photometry package Sextractor version 2.2.2 (Bertin & Arnouts, 1996). Our final source catalog was constructed using the I-band image as the detection image with which to center the apertures and estimate the magnitudes in both the R- and z-bands. This method was used as our goal was to find objects with large spectral breaks between the R- and I-bands, indicating that they may be at high redshifts. However, we were concerned that selecting candidate high redshift galaxies based solely on their detection in one band might lead to spurious sources. Therefore, as a check of the centering of the apertures, the influence of the noise properties of individual colors or images, etc., we also generated catalogs using the R-band, z-band, and a simple sum of the 3 images as the detection images. Given the color criteria we used to select our target galaxies for follow-up spectroscopy, we noted no significant dependence on the image used to select objects other than those given by differences in the detection limits (like limiting color and source densities). The final magnitudes adopted for each of the sources is from a 2 arc second diameter circular aperture based on the aperture position given using the I-band image for source detection. Although the total imaged area was approximately 44 arcmin2 we excluded sources near the edge of the frames to minimize possible flat-fielding errors, differences in sensitivity due to non-uniform exposure, or sources partially falling off the imaged region, all of which can affect the photometry. Moreover, part of the area was vignetted by the guide probe for some of the image and this region was also excluded. Taking these into account, our sample was selected from the central 41.3 arcmin2 of the final image.
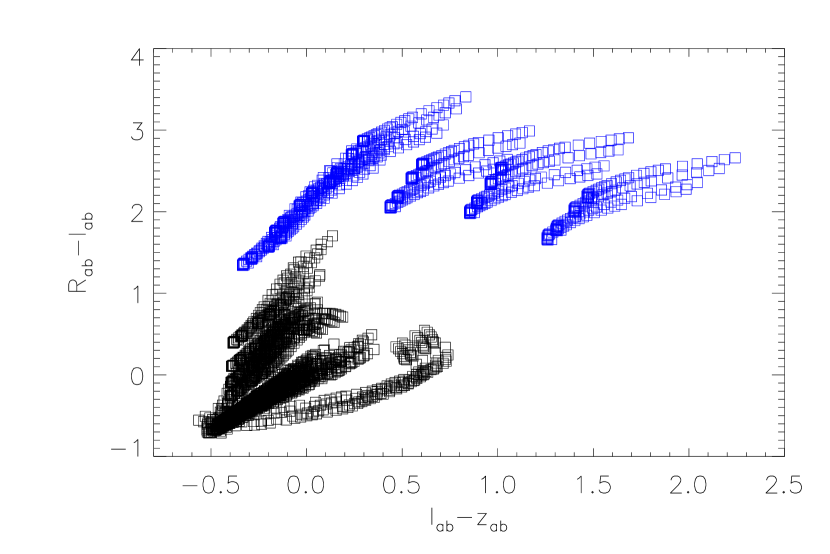
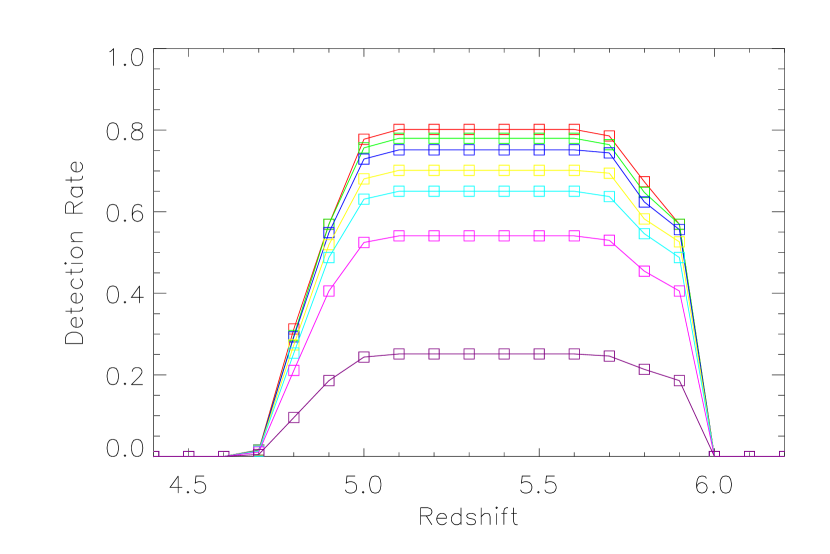
As stated in the introduction, our goal is to use the opacity of the IGM short-ward of Ly to select objects with large magnitude breaks between the and bands. Using the analysis of Madau, Haardt, & Rees (1999), Songaila & Cowie (2002), and Fan et al. (2002) of the amount of IGM absorption expected short-ward of Ly, along with spectrophotometric models of early star formation in galaxies (Fioc & Rocca-Volmerange, 1997) and existing high redshift quasar spectra, we determined that a color selection of will include all sources at (Fig. 1). This selection is mainly driven by the IGM opacity and thus using an accurate estimate of it is crucial to selecting galaxies at high redshifts. Our imaging data were reliable and relatively complete to so our primary target selection was and . These objects could in principle be at any redshift above , but in practice are likely to be at due to the increasing effect of IGM opacity on the observed band at increasing redshift. The IGM introduces little or no appreciable “reddening” in at z=4.8, increasing to mags of “reddening” by in these models (Fig. 1). As rapidly increases with redshift above , for example at , , the chosen color cut is generously blue for objects in this redshift range. Consequently, even if we have excluded some objects at z5 through our color selection, the volume that is probed by these observations will be barely effected (Fig. 2).
Given the number of slit-lets that can be used in the FORS2 Mask Exchange Unit (see next section), we were able to observe more than just our primary sample. Consequently, we relaxed our criteria to and , including as many objects as feasible, concentrating on those with the reddest colors. We expected few, if any of the sources in this expanded sample to be at , essentially only those that had , but with . Where there was space on the masks, we included Extremely Red Objects (EROs) selected from the VLT imaging and a separate band AAT IRIS2 image (to be reported on elsewhere). One object was included as it was very much brighter in the R-band than in and undetected in . When selecting objects on the basis of color, we did not rely solely on the Sextractor cataloged band magnitudes, we examined the band images of all objects with and by eye. This allowed us to include objects where the band magnitudes were overestimated by Sextractor due to crowding with other objects or from unreliable background estimation. We also examined sources detected by Sextractor in the band alone, rejecting those where the source appeared bogus. This only affected a few of the faintest objects.
The band was used to constrain the observational priority in an attempt to remove intrinsically red objects (cool stars and sub-stellar objects), but again, there was sufficient slit-let numbers that this criterion was not strictly observed and such objects were included in spectroscopy to confirm their photometric classification. In the rest of this paper, we will only discuss the objects that strictly meet the primary photometric criteria.
2.3 Multi-Object Spectroscopy
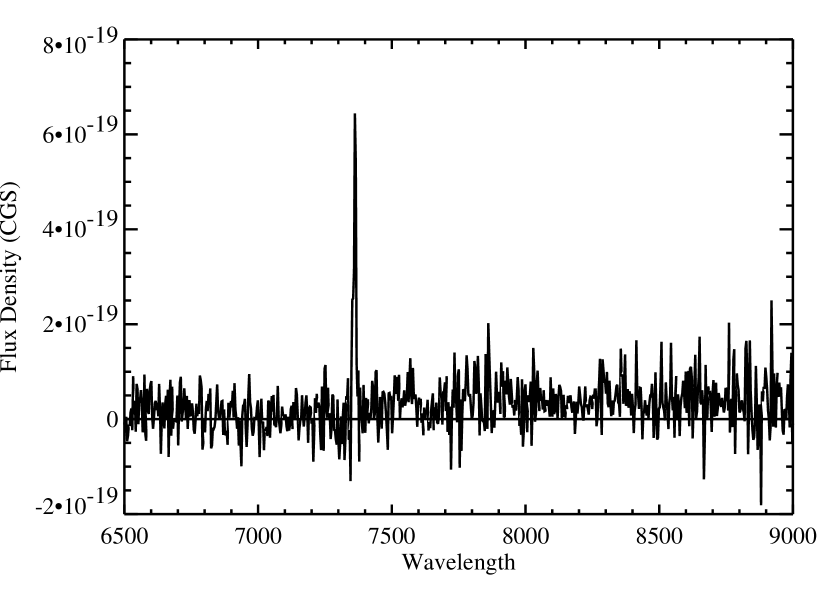
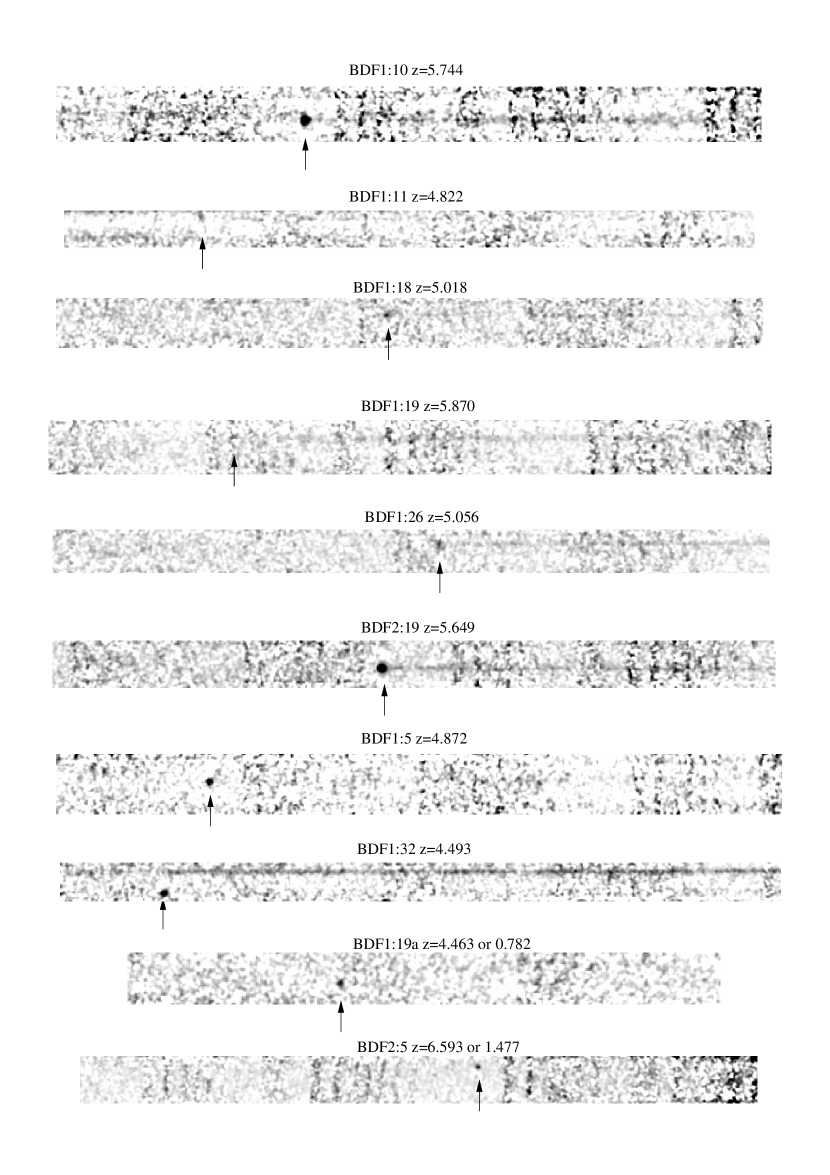
Spectra of these sources were obtained using the Mask Exchange Unit (MXU) in FORS2 on UT4. Key to the success of these observations was the use of new red-enhanced MIT CCD chips, which benefited from high Quantum Efficiency at red wavelengths (70 per cent at 9000 Å) and extremely low fringe amplitudes. The observations were carried out in service mode on the nights of August 6 and 8, 2002. We observed with the 300 l mm-1 grism blazed in the I-band and an OG590 order separating filter. The final spectra span the range of about 6000Å to 1.1m for slits placed near the center of the field. The set-up included two masks each of which were observed partially on those two nights. The total integration time per mask was 4 1/3 hours. Generally, each slitlet was 10” in total length and 1” in width. The data were reduced by bias subtracting frames with zero exposure time and no illumination, flat-fielded using normalized spectra of a continuum source, and wavelength calibrated using observations through each mask of a comparison lamp. Each mask had 20 sets of exposures which were dithered along the slit. After bias subtraction and flat-fielding, the sky was subtracted using a average combination of 3 frames taken closest in time and then had a first order polynomial subtracted from each column after the first pass at sky subtraction. The separate spectra for each slit were then aligned and averaged together. The spectra were then rectified to wavelength calibrate them and then flux calibrated using the standard spectrophotometric standard LTT 7987. The excellent cosmetic quality of the chips in FORS2 along with their very high quantum efficiency and lack of fringing in the red meant that we could often spectroscopically detect very faint objects () to 1 micron (Fig. 3).
| Designation | RAB | IAB | zAB | log fline | Redshift | log Lline | MAB(1700Å) | |
|---|---|---|---|---|---|---|---|---|
| (1) | (2) | (3) | (4) | (5) | (6) | (7) | (8) | (9) |
| BDF1:9 | 27.8 | 26.2 | 25.8 | … | … | … | … | 20.3 |
| BDF1:10 | 27.8 | 26.0 | 25.3 | 8191.8 | 16.61 | 5.7441 | 42.94 | 21.3 |
| BDF1:11 | 27.8 | 25.8 | 25.5 | 7078.2 | 17.80 | 4.8223 | 41.58 | 20.8 |
| BDF1:14 | 27.8 | 26.0 | 24.9 | … | … | … | … | 21.7 |
| BDF1:18 | 27.8 | 26.0 | 25.4 | 7315.5 | 17.62 | 5.0175 | 41.80 | 21.0 |
| BDF1:19 | 27.8 | 26.0 | 25.4 | 8351.4 | 17.51 | 5.8696 | 42.07 | 21.1 |
| BDF1:26 | 27.8 | 25.6 | 25.9 | 7362.0 | 17.46 | 5.0558 | 41.97 | 20.7 |
| BDF2:12 | 27.8 | 26.2 | 26.0 | … | … | … | … | 20.5 |
| BDF2:13 | 27.8 | 26.0 | 26.0 | … | … | … | … | 20.5 |
| BDF2:15 | 27.8 | 25.9 | 26.0 | … | … | … | … | 20.5 |
| BDF2:17 | 27.8 | 26.2 | 26.0 | … | … | … | … | 20.5 |
| BDF2:19 | 27.8 | 26.1 | 25.2 | 8083.0 | 16.60 | 5.6488 | 42.94 | 21.4 |
| I1020 | 27.8 | 26.1 | 26.0 | … | … | … | … | 20.5 |
Note. — Col. (1) – Source name. Cols. (2-4) – Magnitudes in the AB system. Col. (5) – Wavelength of identified line in Å. Col. (6) – Logarithm of the integrated flux of the line in ergs s-1 cm-2. Col. (7) – Redshift assuming the observed line is Ly. Col. (8) – Logarithm of the total line luminosity assuming H0=70 km s-1 Mpc-1, =0.3, =0.7. Col. (9) – Absolute AB magnitude at 1700Å, calculated from the band magnitude assuming no color term. The sources without measured redshifts are assumed to be at z=5.3 which is approximately at the peak selection efficiency (see Fig. 2.
| Designation | RAB | IAB | zAB | log fline | Redshift | log Lline | |
|---|---|---|---|---|---|---|---|
| (1) | (2) | (3) | (4) | (5) | (6) | (7) | (8) |
| BDF1:5 | 27.7 | 26.3 | 25.8 | 7142.5 | 17.17 | 4.8752 | 42.22 |
| BDF2:5 | 27.8 | 26.7 | 26.0 | 9229.8 | 17.32 | 6.5926 | 42.38 |
| BDF1:19a | 27.8 | 26.7 | 26.0 | 6640.9 | 16.97 | 4.4626 | 42.33 |
| BDF1:32a | 25.2 | 24.4 | 24.3 | … | … | 4.49 | … |
| BDF1:32b | 25.5 | 25.7 | 26.0 | 6677.5 | 17.89 | 4.4927 | 41.42 |
Note. — Col. (1) – Source name. Cols. (2-4) – Magnitudes in the AB system. For BDF1:32b Both the cataloged and magnitudes were affected by poor background estimation, due to the presence of a bright nearby star, hence the limit for the band magnitude. Col. (5) – Wavelength of identified line in Å. Col. (6) – Logarithm of the integrated flux of the line in ergs s-1 cm-2. Col. (7) – Redshift assuming the observed line is Ly. For BDF1:32a, the redshift estimate is based on the continuum break assuming it is due to Ly absorption from the IGM. Col. (8) – Logarithm of the total line luminosity assuming H0=70 km s-1 Mpc-1, =0.3, =0.7.
3 Results
3.1 Results from the Spectroscopy
There were 18 objects which met our strict primary selection criteria of 26.25, . These split neatly into two groups based on band magnitude. The first group of five had . Three were point sources with the colors of main sequence stars and one had the colors and morphology of a elliptical, with its color just making the color cut. The fifth object was stellar in appearance but had and making it a candidate quasar. All except one of the stellar objects, including the quasar candidate, were spectroscopically observed. None were found to be at . The candidate elliptical was also confirmed spectroscopically.
The second group of 13 sources all had and . All were undetected in and half undetected in . All 13 sources are listed in Table 1 along with their redshifts when measured. We obtained spectra for 12 of these sources, the other source was excluded due to slit contention (by which we mean that the objects were aligned such that it was impossible to place two slits that would not overlap spatially and would still be long enough to provide for accurate sky subtraction). Of these sources, 6 have spectroscopically-determined redshifts and their spectra are shown in Figs. 3 and 4. Our sample selection was optimized to detect objects with redshifts between z=4.8 to 5.8. To determine this selection, we carried out an analysis similar to that presented in Steidel et al. (1999). In addition to knowing the expected colors of high redshift galaxies, the completeness of the observations need to be determined. We made the incompleteness estimate in two ways. First, we distributed galaxies of different magnitudes and colors (effectively redshifts) randomly across the frame, then attempted to recover them with the same procedure and color selection used when making the original galaxy catalogs. This analysis was similar to that performed in Steidel et al. (1999), the only difference was that we used the actual galaxies detected with known redshifts and colors instead of model galaxies. Second, to estimate the relative influence of the possible sources of incompleteness (i.e., source confusion, incompleteness as a function of magnitude, and the influence of our color selection criteria on the completeness as a function of redshift) we determined the incompleteness in a three-step process. We determined the effective area of our images by recovering objects placed at random across the I-band frame. A range of magnitudes were used in order to determine the fraction of galaxies recovered. We then determined the incompleteness directly by determining the deviation of the faint galaxy surface density from a power-law fit to the source surface density as a function of magnitude over the range of magnitudes where the data were complete (in the I-band, this was 22.5I25.5). We also estimated the incompleteness as a function of redshift due to our color-selection criteria. For this, we carried out a Monte Carlo simulation using the range of model parameters used in Fig. 1, distributing these randomly over the redshift range 2 to 6.5. The results of the Steidel-like and the three-step-process estimates agree within statistical uncertainties. The final results of the second method are shown in Fig. 2. Given the range of confirmed redshifts, we have succeeded as expected.
Spectra of several of the other six sources showed evidence for a Lyman break in that redshift range, but none as sharp as the line emitters due to limited signal-to-noise. Consequently we do not assign these an exact redshift. Others were too faint to reliably detect spectral features in the continuum. None showed features that indicated redshifts of . Also, the redshift distribution of the line-emitters is not uniform between z=4.8 and 5.8 but in fact fall mainly near the low and high ends of the redshift range. This is most likely due to the wavelength distribution of the strong night sky lines, since the redshift measured tend to be in regions devoid of strong sky lines. Therefore it is possible that some of the sources without spectroscopically-determined redshifts are such because their redshifted Ly line falls in a region of strong night sky line emission. In what follows we refer to these 13 objects as the primary sample. The inclusion of the last object is justified in that it was only excluded from the spectroscopic sample due to a conflict in slit position with another candidate high redshift source.
The strong line-emitters in this sample of 13 are characterized by extremely high rest-frame equivalent widths, more than 30-50Å in the rest-frame. The Ly line luminosities implied by line fluxes are about 4 1041 to almost 1043 ergs s-1. Using the models of Leitherer et al. (1999) and Charlot & Fall (1993) and assuming case B recombination to convert Ly to H line luminosity, we find that UV continuum and line emission is indicative of an extremely young galaxy (ages107-8 years given the uncertainty in the equivalent width) and star-formation rates of up to about 20 M yr-1 (neither of these estimates take into account possible extinction).
None of the objects in the primary sample have spectroscopically-determined redshifts below z4.8. Only one object in the expanded sample was found to be at . This had an band magnitude of , just too faint to be included in the primary sample, and was undetected in , so had . It has a redshift of . This indicates that selecting objects with and is a reliable and efficient way of selecting galaxies at and out to at least , given the results of our spectroscopy.
One other object in the expanded sample, BDF1:32b, was found to be at (Table 2). This was detected in both and and had a relatively blue color. However, we note that BDF1:32 lies near a bright star which affected the photometry significantly. Practically all of the R-band light came from a strong emission line at 6675 Å(Fig. 3). This is taken to be Ly at . Another continuum-only object in the slit 5 arc sec north of the line-emitter has a sharp break in the continuum at the same wavelength, with little or no continuum flux short-ward of 6675 Å(BDF1:32a). These two objects are therefore likely to be at the same redshift, one a strong line emitter, the other a continuum-only Lyman break galaxy (Fig. 3).
3.2 Surface Densities of High Redshift LBGs
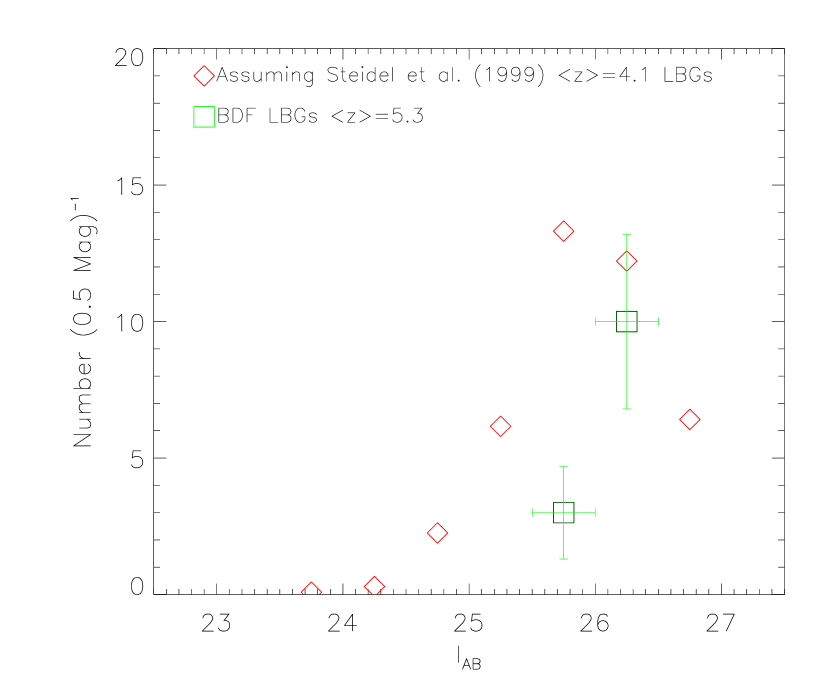
How do the luminosities and surface densities of our sources compare to those of the Lyman break galaxies in Steidel et al. (1999) at and 4? Given the small area of our survey and the small number of sources, we do not attempt to determine a luminosity function for the sources. Determining the luminosity function is complicated by the diminution of the band flux from an object as the redshift increases from z=4.8 to 5.8 due to the opacity of the IGM. Instead, we constructed a simulation of the expected number counts in over this redshift range assuming no evolution in the luminosity function taken from Steidel et al. (1999) for z3.0 and 4.1 LBGs (converted to the cosmology H0=70 km s-1 Mpc-1, =0.3, =0.7) and that the galaxies are distributed uniformally in the completeness-corrected volume (i.e., the completeness correction has been applied as a function of magnitude and redshift; Fig. 2). We assume that the absolute magnitude at 1700Å relates directly to the observed band magnitude with no color term. We modelled the colors of young galaxies (from the models of Fioc & Rocca-Volmerange) over this redshift range including the effects of IGM opacity (from Madau, Haardt, & Rees, 1999, modified using the determinations from Fan et al. (2002)). An approximate fit to the color of these objects is given by over the redshift range . With these assumptions we distributed the galaxies assuming their magnitudes followed the luminosity function from Steidel et al. (1999), assigned a redshift with the appropriate difference in the distance modulus between z=4.1 and the assigned redshift, and then applied the diminution due to the IGM. The incompleteness correction was included using the estimates outlined in §3.1.
The simulated number counts, including the incompleteness as a function of magnitude and redshift are shown in Figure 5. Above we have no candidate galaxies at , where as of-order 10 are predicted. Down to , about 40 sources are predicted compared to thirteen detected in our primary sample. Although the number of detected sources are below those expected if the luminosity function of UV bright Lyman break galaxies does not evolve from to , the differences are not highly significant except at the brightest end. Even then the cosmic variance might account for much of this difference given the relatively small area of our field. But taken at face value, our results suggest that the luminosity function at these high results has shifted to fainter magnitudes and is steeper at the bright end compared to the luminosity function at z=4.1.
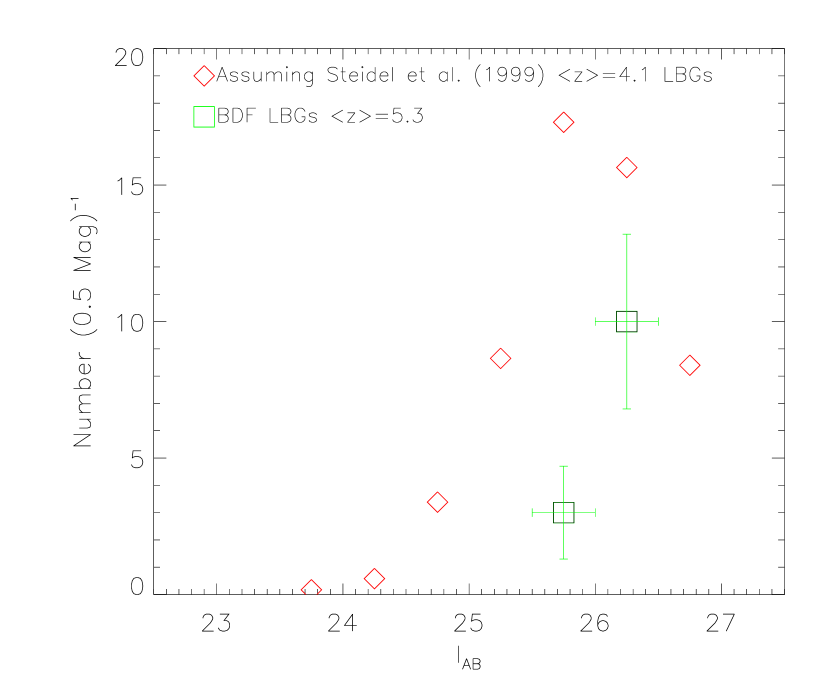
The estimate of any significant under-density of sources relies predominately on the relationship between and redshift. The range of colors seen in the models in Fig. 1 results from the strong absorption due to the IGM with a smaller contribution from range of extinction and ages. The span in color due to redshift and IGM absorption is about 2 magnitudes, while that due to reddening and age is about 0.5 magnitudes for any one redshift. The range of colors observed in the galaxies of our primary sample at 0.2 to 1.1. Although the number of spectroscopically-determined redshifts is small, the galaxies at z=5.6 to 5.8 do have the reddest colors of our sample ( = 0.6 or 0.7), consistent with the dominant influence of the attentuation due to the IGM. These colors are consistent with little reddening and young ages (108 yrs) mainly due to the strong attenuation of the IGM at the highest redshift. And since dust destroys Ly preferentially and only galaxies with young ages have strong Ly emission (e.g., Leitherer et al., 1999; Charlot & Fall, 1993), such a conclusion is also supported by the high rest-frame equivalent widths observed in Ly. Given the dominant influence of the IGM opacity on the colors of the galaxies, and the lack of extremely red colors, one might be concerned about how the choice of used in our simulation might bias our conclusions. To gauge the influence the relationship between color and redshift on the predicted numbers of LBGs, we ran the surface density simulation with a variety of coefficients for linearly relating redshift and (e.g., and ) that would be consistent with both the model and observed galaxy colors as a function of redshift. The results imply that our assumption of is conservative. For example, adopting (which is more in line with the observed range of colors and redshifts than is ), about 50 sources are predicted compared to thirteen detected in our primary sample and the discrepancy at the faint magnitudes becomes significant (Fig. 6). Therefore, any relationship between color and redshift with a weaker dependence on redshift or which reaches less extreme colors at z=5.8 than we have assumed, tends to increase the significance of the observed under-density of sources compared to LBGs at lower redshifts.
The justification for the analysis just presented is that the IGM has a substantial impact on the resulting magnitudes and number densities of the sources at these redshifts. Therefore, it is imperative that its affect be accounted for properly. In spite of this caveat, to further our comparison with LBGs at low redshifts, we estimated the total co-moving densities and UV luminosity density from sources with 4.8z5.8. Applying the incompleteness corrections, we find the total co-moving density of sources with of about 10-3.3 Mpc-3. The estimated UV luminosity density is about log 25.7 ergs s-1 Hz-1 Mpc-3. Both of these estimates are approximately a factor of 3 below that estimated at z4 (Steidel et al., 1999). Although the correction for IGM opacity is uncertain and that both the total co-moving space densities and UV luminosity density strongly reflect the number densities of sources at the faintest magnitudes where the relative under-density is small, these estimates suggest an overall decline in the number and emissivity of sources from z4 to z5.3 consistent with our simulations.
A possible cause of the discrepancy in the expected number of sources at z5.3 and z4 could be the effects of surface brightness dimming which results in systematically underestimating the magnitudes of galaxies at high redshift. To provide an estimate of the size of the effect, the relative difference in surface brightness between z=4.1 and 5.3 is about 1 magnitude arcsec-2. However, surface brightness dimming is unlikely to have a substantial impact for several reasons. The images used to select the galaxies for this survey are about one magnitudes deeper than the ground-based images used in for example Steidel et al. (1999) thus compensating somewhat for the differences in surface brightness of the two galaxy samples. In addition, we note that none of the objects is resolved significantly in the 0.7 arcsecond seeing of the images. In an analysis of similarly selected galaxies from the Chandra Deep Field South with deep HST ACS images, galaxies have a half-light radii that span from unresolved at HST resolution to less than a few tenths of an arcsec (Bremer et al. 2003, in preparation; Stanway, Bunker, & McMahon, 2003). Moreover, if all of the galaxies have a similar morphology regardless of their magnitude, one would expect the fainter sources to have their magnitudes significantly underestimated compared to the brighter sources. This is because brighter galaxies will be detected over a broader range of surface brightness than that of fainter galaxies. Our results suggest that the difference in the source densities is significant for the bright high redshift galaxies and much less so for the faint sources. Thus, surface brightness dimming is unlikely to play a significant role in explaining the paucity of bright sources.
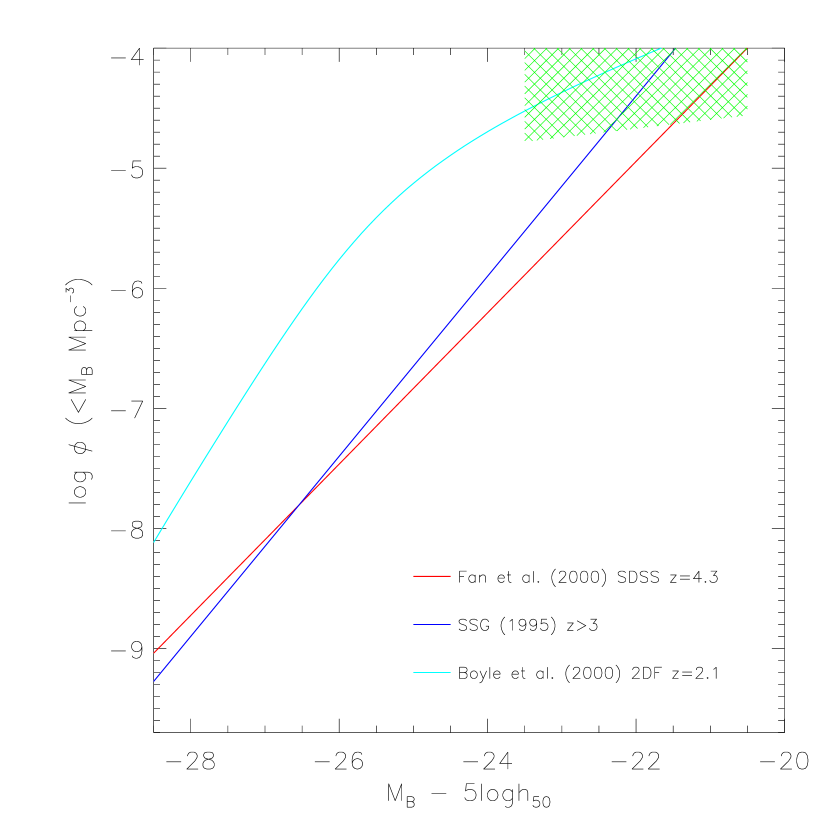
We also investigated the constraints that these results put on the QSO luminosity function at these high redshifts. We detected no broad line sources (QSOs) in our spectra. Assuming that the redshift coverage is between 4.8 and 5.8, and applying the completeness correction discussed above, we find that we find that the co-moving density of QSOs must be less than about 10-4.8 Mpc-3 for 23.5MB20.5 (due to the completeness corrections, the exact density depends on the magnitude; Fig. 7). The B-band magnitude was estimated assuming a power-law slope for the QSO spectrum of -0.5 (Schmidt, Schneider, & Gunn, 1995; Fan et al., 2001). This limit on the co-moving space density implies that the QSO luminosity function as observed by Schmidt, Schneider, & Gunn (1995) and Fan et al. (2001) while already flatter than the lower redshift luminosity functions, must turnover at MB23.
Several other galaxies at these redshifts have been discovered in previous studies, but the diversity in galaxy selection methods make the studies difficult to compare to ours. Those selected by lensing (Ellis et al., 2001) or narrow-band imaging (Hu et al., 2002; Rhoads et al., 2002) have continuum magnitudes that are generally below our band limits. Others were serendipitously discovered (Dey et al., 1998), or based on optical/IR colors (Weymann et al., 1998). Techniques comparable to ours were used by Dey et al. (1998) and Spinrad et al. (1998) to detect z=5.3 galaxies in individual Keck and HST images. The pair of galaxies detected by Spinrad et al. in the HDF-North would have been seen in our ground-based imaging as an individual source. Both this and the galaxy detected by Dey et al. would have been discovered by us had they fallen within our field. Given the relative field sizes and exposure depths, the discovery of these objects is entirely consistent with the surface density of galaxies at in this study.
Wide-field narrow-band surveys for line-emitting galaxies (e.g., Rhoads & Malhotra, 2001; Ouchi et al., 2002) are efficient at detecting the most extreme line-emitters at high redshift. None of the galaxies in Rhoads et al. (2002) have sufficient line flux alone to be detected by us in the broad-band filters given our flux limit. For example, a flux of ergs-1 s-1 cm-2, is below our detection limit in both I and z assuming that a majority of the flux from the objects in these bands arises from a Ly line. Adopting the figures in Rhoads et al. (2002), assuming a I-band continuum detection limit of , we would expect about 4 objects (taking into account the incompleteness) with line fluxes of ergs-1 s-1 cm-2 and in our central field of 41.3 arcmin2. The Rhoads et al. survey is sensitive to the most extreme line-emitters, our continuum-detected sources in the primary sample typically have lower Ly equivalent widths (although we note that several of them, including the strongest of the line emitters have equivalent widths 100Å). Formally, we detect 2 line emitters with line fluxes greater than ergs-1 s-1 cm-2 and . However, these galaxies both are IAB26, barely below the continuum detection limit of Rhoads et al. Thus while consistent within the uncertainties, it is likely that there are more objects with fainter continuum magnitudes similar to the Rhoads et al. sources, but with lower line fluxes in our field. If we assume that the Ly luminosity density measures the unobscured star formation density, it is therefore likely that a significant fraction (probably most) of the star formation occurring in our field at happens in objects fainter than our magnitude limit. If so, the UV luminosity density produced by these objects is also likely to be more than that produced by objects above our magnitude limit.
3.3 Serendipitously Detected Line Emitters: The Highest Redshift Galaxy?
Along with objects that we deliberately targeted, we also detected two potentially high redshift line-only sources serendipitously in our slit-lets. The first was a line detected at 6640.9Å in the same slit-let as BDF1:19 (Figure 3; Table 2). The second was found in a slit-let placed to fill up empty area on the slit mask (BDF2:5). The line is at an observed wavelength of 9229.8Å (Figure 3; Table 2) which, assuming the detected line is redshifted Ly, would make it the highest redshift galaxy known (see Hu et al., 2002), at . However, the lack of discernible continuum emission makes this identification uncertain. The line is too weak to have a significant asymmetry in our data. It could be a low redshift [OII]3727 emitter at z=1.4765. If so, the upper limit of =26.0 implies that it would have a rest-frame UAB17.5 and a rest-frame equivalent width 50Å. Both numbers are extreme, but not completely out of the question. Tresse et al. (1999) have shown that in the local universe, while such extreme equivalent widths are generally rare (10% of galaxies are so extreme), high equivalent widths become more common in low luminosity galaxies. Although the identification of the line as Ly is not certain, we note that the redshift is no less secure than other line-only high redshift galaxy candidates in the literature, or those with very marginal single-band continuum detections.
4 Discussion
Recently, Ferguson, Dickinson, & Papovich (2002) have used the analysis of Shapley et al. (2001) and Papovich, Dickinson, & Ferguson (2001) to estimate the possible contribution of LBGs at z4 to the reionization of the Universe. They argue that for reasonable assumptions, the relatively young age and insufficient co-moving space density, LBGs at z4 are unlikely to be the progeny of the sources that reionized the Universe. They also show that if the luminosity function of the LBGs does not evolve between the reionization epoch and , then they cannot provide the bulk of the UV photons that reionize the universe. The higher the redshift of reionization, the larger the deficit.
We find that there may be a decline in the number of luminous star-forming galaxies from z3.0 and 4.1 (Steidel et al., 1999) to z5.3. The number of sources we observe at I is less than expected (zero observed and about 10 predicted) for a constant co-moving density of sources over that redshift interval. Our calculated UV photon density for our primary sample over the redshift range falls below that of LBGs, insufficient to ionize the IGM in the observed volume. Another source of UV photons is required. Moreover, these sources are observed within only a few hundred million years after reionization (assuming this happens at ). For galaxies such as those in our primary sample to provide the bulk of reionizing photons, a dramatic and unlikely decrease in their co-moving density would have to occur over this short timescale. For this deficit to be accounted for by cosmic variance, the field would have to be considerably more than an order of magnitude under-luminous relative to the average field at .
Consequently, our results strongly imply that bright galaxies did not provide the bulk of UV photons that reionized the universe and that their number density may have declined significantly. For reionization, the majority of the photons must come from galaxies fainter than our flux limit (with absolute magnitudes of ), or from brighter AGN outside the arcmin2 field-of-view. Theoretically, a population of quasars with (10-100 times fainter than the known Sloan Digital Sky Survey quasars) and a surface density of around 100 per square degree could keep the volume between ionized without appearing in our field. This would require a bizarre quasar luminosity function at , with a steep slope over the brighter parts (to provide a high enough density of sources to cause the ionization) and then a sharp drop, to avoid more numerous, fainter sources in fields such as ours (Figure 7), or in the HDF. However, for any reasonable quasar luminosity function (i.e., one that is like those observed for lower redshift QSOs), one would then expect several fainter AGN at such redshifts within our field, which we do not find. Similarly, Conti et al. (1999) found no quasars in the HDF at to very faint magnitudes, making this possibility extremely unlikely.
This leads to the conclusion that the bulk of the photons that reionize the universe arise from galaxies fainter than our flux limit, those with and from galaxies with generally lower Ly equivalent widths. Our interpretation of the results of Rhoads et al. (2002) supports this, assuming that the bulk of the sources in the Rhoads et al. sample are Ly emitters at .
References
- Becker et al. (2001) Becker, R. H. et al. 2001, AJ, 122, 2850
- Bertin & Arnouts (1996) Bertin, E., & Arnouts, S. 1996, A&AS, 117, 393
- Boyle et al. (2000) Boyle, B. J., Shanks, T., Croom, S. M., Smith, R. J., Miller, L., Loaring, N., & Heymans, C. 2000, MNRAS, 317, 1014
- Calzetti et al. (2000) Calzetti, D., Armus, L., Bohlin, R. C., Kinney, A. L., Koornneef, J., & Storchi-Bergmann, T. 2000, ApJ, 533, 682
- Charlot & Fall (1993) Charlot, S., & Fall, S. M. 1993, ApJ, 415,580
- Ciardi, Stoehr, & White (2003) Ciardi, B., Stoehr, F., & White, S. D. M. 2003, astro-ph/0301293
- Conti et al. (1999) Conti, A., Kennefick, J. D., Martini, P., & Osmer, P. S. 1999, AJ, 117, 645
- Dawson et al. (2002) Dawson, S., Spinrad, H., Stern, D., Dey, A., van Breugel, W., de Vries, W., & Reuland, M. 2002, ApJ, 570, 92
- Dey et al. (1998) Dey, A., Spinrad, H., Stern, D., Graham, J. R., & Chaffee, F. H. 1998, ApJ,498, L93
- Ellis et al. (2001) Ellis, R., Santos, M. R., Kneib, J.-P., & Kuijken, K. 2001, ApJ, 560, 119
- Fan et al. (2001) Fan et al. 2001, AJ, 122, 2833
- Fan et al. (2002) Fan et al. 2002, AJ, 123, 1247
- Ferguson, Dickinson, & Papovich (2002) Ferguson, H. C., Dickinson, M., & Papovich, C. 2002, ApJ, 569, L65
- Fioc & Rocca-Volmerange (1997) Fioc, M., & Rocca-Volmerange, B. 1997, A&A, 326, 950
- Hamuy et al. (1994) Hamuy, M., Suntzeff, N. B., Heathcote, S. R., Walker, A. R., Gigoux, P., & Phillips, M. M. 1994, PASP, 106, 566
- Hu et al. (2002) Hu, E. M., Cowie, L. L., McMahon, R. G., Capak, P., Iwamuro, F., Kneib, J.-P., Maihara, T., & Motohara, K. 2002, ApJ, 568, L75
- Iwata et al. (2003) Iwata, I., Ohta, K., Tamura, N., Ando, M., Wada, S., Watanabe, C., Akiyama, M., & Aoki, K. 2003, astro-ph/0301084
- Landolt (1992) Landolt, A. U. 1992, AJ, 104, 304
- Leitherer et al. (1999) Leitherer, C. et al. 1999 1999, ApJS, 123, 3
- Loeb & Barkana (2001) Loeb, A., & Barkanna, R. 2001, ARA&A, 39, 19
- Madau, Haardt, & Rees (1999) Madau, P., Haardt, F. R., & Rees, M. J. 1999, ApJ, 514, 648
- Madau et al. (1996) Madau, P., Ferguson, H. C., Dickinson, M. E., Giavalisco, M., Steidel, C. C., & Fruchter, A. 1996, MNRAS, 283, 1388
- Oke & Gunn (1983) Oke, J. B., & Gunn, J. E. 1983, ApJ 266, 713
- Ouchi et al. (2002) Ouchi, M. et al. 2002, astro-ph/0202204
- Papovich, Dickinson, & Ferguson (2001) Papovich, C., Dickinson, M., & Ferguson, H. C. 2001, ApJ, 559, 620
- Rhoads & Malhotra (2001) Rhoads, J. E., & Malhotra, S. 2001, ApJ, 563, L5
- Rhoads et al. (2002) Rhoads, J. E., Dey. A., Malhotra, S., Stern, D., Spinrad, H., Jannuzi, B. T., Dawson, S., & Brown, M. astro-ph/0209544
- Schlegel, Finkbeiner, & Davis (1998) Schlegel, D. J., Finkbeiner, D. P., Davis, M. 1998, ApJ, 500, 525
- Schmidt, Schneider, & Gunn (1995) Schmidt, M., Schneider, D. P., & Gunn, J. E. 1995, AJ, 110, 68
- Schneider et al. (1983) Schneider, D. P., Gunn, J. E., Hoessel, J. G. 1983, ApJ, 264, 337
- Shapley et al. (2001) Shapley, A. E., Steidel, C. C., Adelberger,K. L., Dickinson, M., Giavalisco, M., & Petini, M. 2001, ApJ, 562, 95.
- Spinrad et al. (1998) Spinrad, H., Stern, D., Bunker, A., Dey, A., Lanzetta, K., Yahil, A., Pascarelle, S., Fern ndez-Soto, A. 1998, AJ, 116, 2617
- Stanway, Bunker, & McMahon (2003) Stanway, E. R., Bunker, A. J., & McMahon, R. G. 2003, astro-ph/0302212, MNRAS accepted
- Steidel et al. (1999) Steidel, C. C., Adelberger, K. L., Giavalisco, M., Dickinson, M., & Pettini, M. 1999, ApJ, 519, 1
- Stern & Spinrad (1999) Stern, D. & Spinrad, H. 1999, PASP, 111, 1475
- Sokasian et al. (2003) Sokasian, A., Abel, T., Hernquist, L., & Springel, V. 2003, astro-ph/0303098
- Songaila & Cowie (2002) Songaila, A. & Cowie, L. L. 2002, AJ, 123, 2183
- Sullivan et al. (2000) Sullivan, M., Treyer, M. A., Ellis, R. S., Bridges, T. J., Milliard, B., & Donas, J. 2000, MNRAS, 312, 442
- Tresse et al. (1999) Tresse, L., Maddox, S., Loveday, J., & Singleton, C. 1999, MNRAS, 310, 262
- Weymann et al. (1998) Weymann, R. J., Stern, D., Bunker, A., Spinrad, H., Chaffee, F., Thompson, R. I., & Storrie-Lombardi, L. J. 1998, ApJ, 505, L95
![[Uncaptioned image]](/html/astro-ph/0212431/assets/x4.png)
![[Uncaptioned image]](/html/astro-ph/0212431/assets/x5.png)
![[Uncaptioned image]](/html/astro-ph/0212431/assets/x6.png)
![[Uncaptioned image]](/html/astro-ph/0212431/assets/x7.png)