A VLBA SEARCH FOR A STIMULATED RECOMBINATION LINE FROM THE ACCRETION REGION IN NGC 1275
Abstract
The radio source 3C 84, in NGC 1275, has a two sided structure on parsec scales. The northern feature, presumed to be associated with a jet moving away from the Earth, shows strong evidence for free-free absorption. The ionized gas responsible for that absorption would be a source of detectable stimulated recombination line emission for a wide range of physical conditions. The VLBA has been used to search for the H65 hydrogen recombination line. The line is only expected to be seen against the northern feature which contains a small fraction of the total radio flux density. This spatial discrimination significantly aids the search for a weak line. No line was seen, with upper limits of roughly 15% of the continuum over a velocity range of 1486 km s-1 with resolutions up to 6.6 km s-1. In the absence of a strong radiation field, this would imply that the free-free absorbing gas has a wide velocity width, is moving rapidly relative to the systemic velocity, or is concentrated in a thin, high density structure. All of these possibilities are reasonably likely close to an AGN. However, in the intense radiation environment of the AGN, even considering only the radiation we actually observe passing through the free-free absorbing gas, the non-detection is probably assured by a combination of saturation and radiation damping.
1 Introduction
The radio source 3C 84 is associated with NGC 1275, the dominent member of the Perseus Cluster. The radio source has a complex structure on parsec scales that has been an object of study with VLBI since the very early days of that technique (see Walker et al. 2000 and references therein). There is a bright core region, compact at high frequencies, which is thought to be close to the central engine of the AGN. Extending to the south, currently to about 15 milliarcseconds (mas), is a complex structure clearly related to the jet seen on larger scales, but showing a morphology reminiscent of a radio lobe. That structure has been moving outward at approximately 0.3 mas yr-1 and its size extrapolates to zero at about 1959 when 3C 84 started to increase in flux density from below 10 Jy to values in excess of 50 Jy reached in the 1970’s and 1980’s. The flux density has been decreasing lately, but 3C 84 is still one of the brightest compact sources in the sky. HI absorption is seen against the nuclear region at both the optical systemic velocity of km s-1 (deVaucouleurs et al., 1991) and at the velocity of a possibly infalling system at about km s-1. VLBI observations of this absorption have provided information on the intervening clouds (Momjian, Romney, and Troland, 2002) which are thought to be located along the line-of-sight far from the nucleus.
In 1993, a structure extending about 8 mas north of the core was found in early Very Long Baseline Array (VLBA; Napier et al., 1994) observations at 8.4 GHz (Walker, Romney, & Benson, 1994) and in Global VLBI Network observations from 1991 at 22 GHz (Vermeulen, Readhead, & Backer, 1994). By assuming that the northern and southern features originated in the core at the same time, a simple relativistic beaming model gives an intrinsic jet velocity of about and an angle to the line of sight of about (Walker, Romney, & Benson, 1994, updated for km s-1Mpc-1, the value that is used in this paper). The assumption of a common start time is reasonable given the flux history of the source and the measured velocities. The northern feature was much brighter at the higher frequency, suggesting that the radiation is free-free absorbed. The absorption is only seen against the counterjet. The near-side jet is not absorbed at all and the core is at most weakly absorbed; synchrotron self-absorption may be responsible for the inverted spectrum. Therefore, the absorbing material is most likely located on parsec scales (), probably associated with the presumed accretion disk that feeds a central black hole. The implications of the observed absorption for disk structure are discussed by Levinson, Laor, & Vermeulen (1995).
The counterjet absorption was studied in detail with near-simultaneous VLBA observations at many frequencies in 1995 by Walker et al. (2000). It was also seen on somewhat larger scales at lower frequencies by Silver, Taylor, & Vermeulen (1998). These observations left little room to doubt that free-free absorption is the explanation of the observed spectrum of the counter jet. They also were able to determine the two-dimensional distribution of the absorption over the region of the counterjet. That structure was found to be dominated by a radial gradient decreasing with core distance. If the gradient is fitted with a power law, the index is a bit above . But a power law is not an especially good description of the observed gradient. If a temperature of K is assumed, the absorption implies a gas with an emission measure (EM) of about pc cm-6 at a projected distance of 2.5 pc from the core.
The theory of radio recombination lines predicts that weak maser-like emission can occur over almost the entire radio frequency range due to non-LTE effects (see, for example, Shaver, 1976). The strength of the lines, determined by the degree of inversion of the population levels, is a sensitive function of density and temperature. Calculations of the expected strength of recombination lines for gas parameters implied by the free-free absorption and geometry in 3C 84, in a benign radiation environment, showed that there was a significant chance of being able to detect such lines. An observation of such a line would provide significant constraints on the physical conditions in the absorbing gas. The calculations indicated that the strongest lines would be those in the general vicinity of 20 GHz.
The observation of recombination lines from the counterjet region of 3C 84 is tricky. The counterjet only provides a small fraction of the total flux density, so, even if the optical depth against that region is moderately high, the effect on the total power spectrum would be small. This would place severe requirements on the bandpass calibration of observations that don’t resolve the source. We have used the VLBA, along with one antenna of the VLA, to attempt to detect the H65 line ( GHz) in 3C 84. With the resolution of the VLBA, the region where the line is expected to be seen can be separated spatially from the rest of the source, relaxing the bandpass calibration requirements. And the fact that the recombination line is not expected to be seen against the bright parts of the source allows those regions to be used to do an accurate bandpass calibration using a method developed for these observations.
The calculations of expected line strengths that encouraged us to make the observations reported here ignored the possible effects of the intense radio radiation from the jets. It turns out that those effects can be severe. Shaver (1978) showed that a strong background radio source can alter the level populations and saturate the recombination line maser. With saturation, the amount of amplification is limited by the pump rate, so the line strength can be much lower than would be calculated without taking saturation into account. The conditions in 3C 84 are such that the system is likely to be at or near saturation. Even more serious, Shaver (1978) pointed out that radio recombination lines will be severely broadened by radiation damping in the presence of a strong radio source. Inserting numbers appropriate for 3C 84 into equation 24 of Shaver (1978) gives a line width of thousands of km s-1. This would make the line unobservable. Therefore detection of a line would imply either that the absorbing region is at least twice as far from the radio source than implied by the geometry described above, or that something is wrong with the physics. Likewise, a non-detection, unfortunately, provides no interesting constraints on the physical conditions in the 3C 84 accretion region.
2 The Observations
On 1998 September 18, 3C 84 was observed in left circular polarization on the VLBA and one antenna of the VLA. The frequency range MHz was spanned using 8 slightly-overlapped, 16 MHz baseband channels. The correlator provided 32 spectral channels for each baseband channel. After throwing out edge channels from each baseband, the final data set retained a total of 224 spectral channels. The frequency was chosen so that the H65 recombination line, at the systemic velocity, would be red-shifted to the center of the fifth baseband channel. The total velocity range in the final spectra is to km s-1, or to km s-1relative to the systemic velocity. The individual channel velocity width is 6.63 km s-1. The VLA electronics system limited coverage at that station to baseband channels .
The data were processed in AIPS. Initial amplitude calibration was done in the usual manner based on continuously measured system temperatures and on gain values provided by the VLBA staff. Two calibrator scans at the 22.2 GHz frequency where VLBA gains are measured confirmed that the calibration at 23.0 GHz did not need a significant frequency dependent adjustment. But the flux scale was adjusted upward significantly when the gain normalization was confined to the 3 best calibrated antennas. Even that left the total flux density of 3C 84 about 12% below the Jy measured by contemporaneous VLBA pointing observations. As a compromise between believing the interferometer calibration and trying to match the total flux density of 3C84, an upward adjustment was made to cut the difference in half. The total flux scale adjustment relative to the blind a priori calibration was 28%.
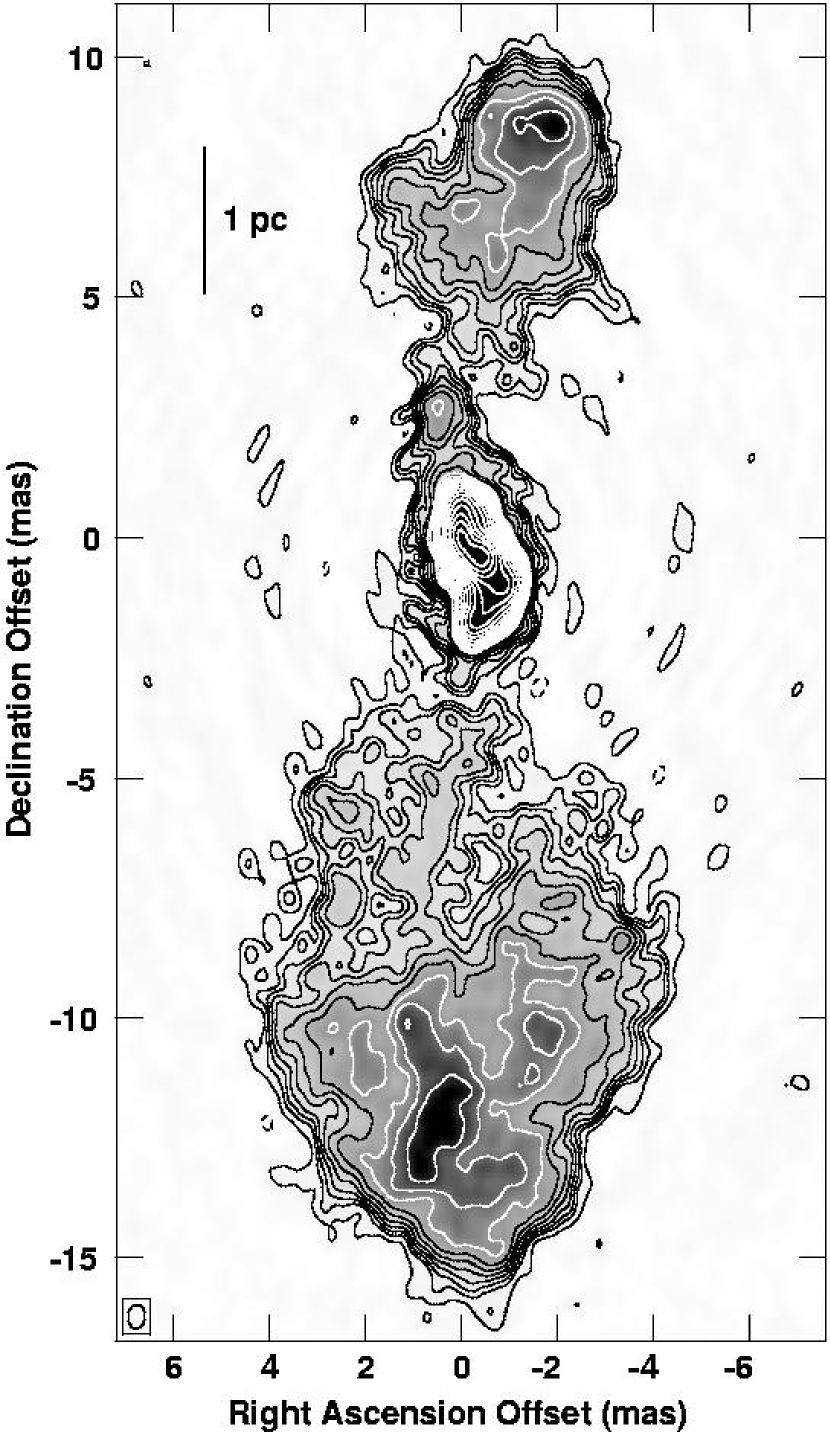
For the spectral calibration, a high quality image was required based on all of the data. For this, the data were fringe fitted and then bandpass calibrated using a single bandpass for the full time of the data set. Many iterations of self-calibration and imaging produced the final image shown in Figure 1. The off-source RMS noise level is 0.29 mJy beam-1. The peak flux density in the image is 1.9 Jy beam-1 and the integrated flux density is 14.6 Jy. For the northern feature alone, the peak is 42 mJy beam-1and the total is 1.20 Jy. The resolution (convolving beam) is mas elongated in position angle . Comparison with the image from 1995 October (Walker et al., 2000) shows good correspondence between even fairly minor features. But there have been noticable changes including expansion away from the core in both the north and south.
By a somewhat circuitous scheme using time dependent bandpass calibrations, we effectively self-calibrated each spectral channel independently using the CLEAN component model from the image described above. The model was then subtracted from the data and images were made of each channel. We call these the “difference images”. These images turn out to be essentially pure noise and were not deconvolved.
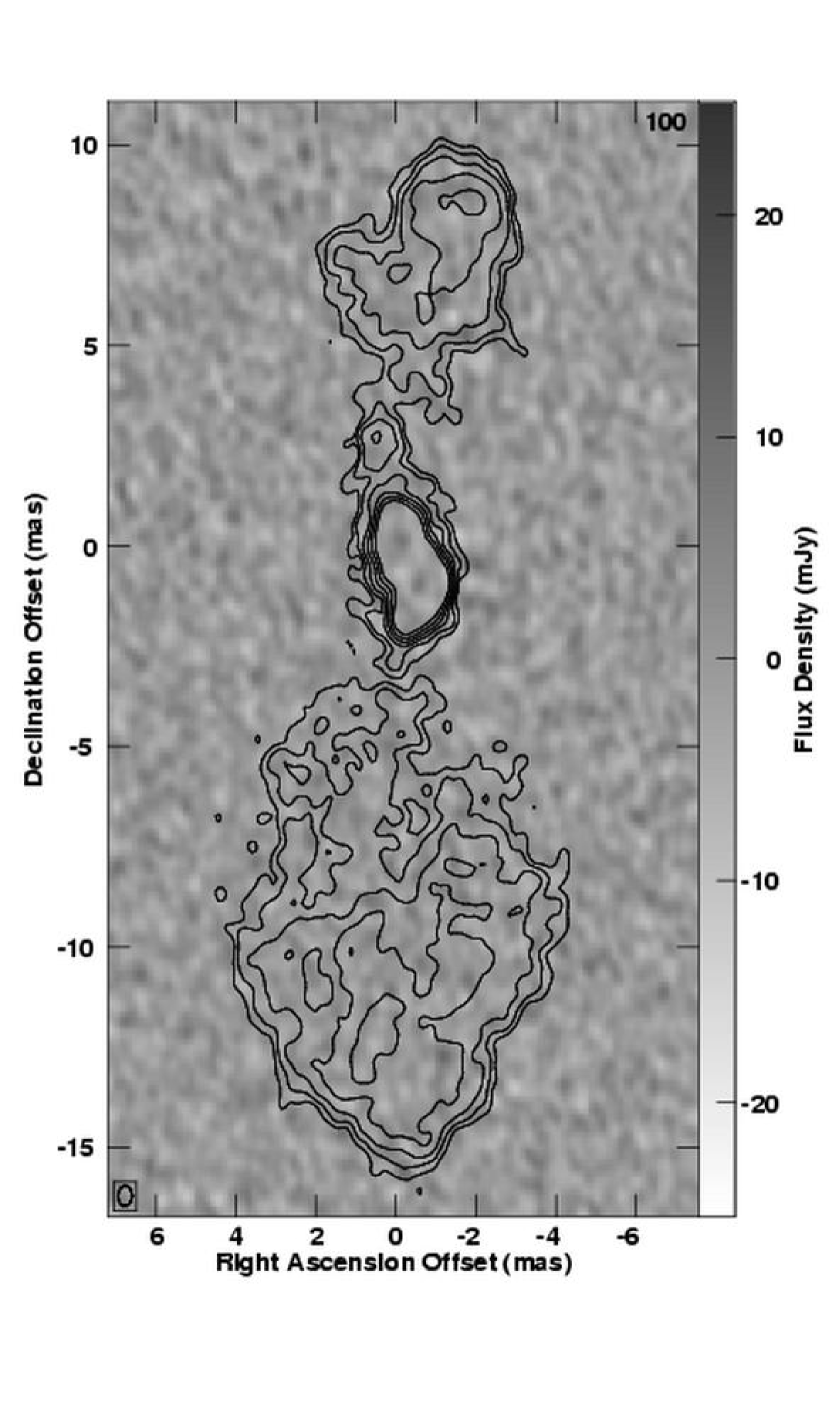
As a representative example of the difference images, Figure 2 shows a grey scale display of channel 100. A coarse contour plot of the continuum image is overlayed for orientation. This channel is typical in that the difference image looks like noise with no distinction between on and off source regions. This means that the data and model match very well with any residuals lying well below the noise level. This is not surprising given the fact that the continuum image, which is based on all 224 channels, has a noise level about 10 times below that of the individual channel images.
In the procedure described above, the data were being forced to match as closely as possible the predictions of the image, which in turn had been made from the data. But always an assumption was made that the image is the same in all channels. Any violation of that assumption should show up in the final images, which are essentially the residuals from the model on a channel by channel basis. If the source structure were different in a channel, as it would be if a spatially variant spectral line were present, the difference image should show the spatial structure of the differences. Actually, this is only true to first order because some of the differences will be absorbed into the channel dependent calibration factors. To test the magnitude of this effect, we modified the data for one channel to mimic the presence of a 10 mJy additional point source somewhere in the middle of the northern feature. We then processed the data in the same way that we processed the real data. The point source appeared in the difference image, reduced in amplitude by 23%. That indicates that the self-calibration can scatter about a quarter of the real difference into calibration parameters. Note that a spatially invarient spectral line would just appear as a gain offset in the affected channels and would not appear in the difference images.
In addition to processing the data as described above, we made difference images based on a more tradional bandpass calibration using 0528+134. The only channel dependent calibration derived from the 3C 84 data itself was the removal of linear phase slopes with a fringe fit. The difference images derived in this way for all channels were indistinguishable from noise, but with noise levels about twice as high as in the channel images based on channel by channel self-calibration. This exercise adds confidence that we have not self-calibrated away a line and that there is no spatially invarient line covering the whole source. But lower limits on line strength, even given the reductions we estimate due to the self-calibration, are provided by the images based on self-calibration of each channel. Basically the bandpass calibration provided by self-calibration on the source itself is significantly better than that provided by the data on the calibrator.
3 Results
No recombination line was detected in any of the images in either emission or absorption. The limits presented here are from the difference image cube based on data with each channel separately self-calibrated. The rms noise in the difference image is 3.0 mJy beam-1 with 0.5 MHz spectral resolution essentially independent of position. For lower spectral or spatial resolution, up to factors of a few, the noise decreases about as expected.
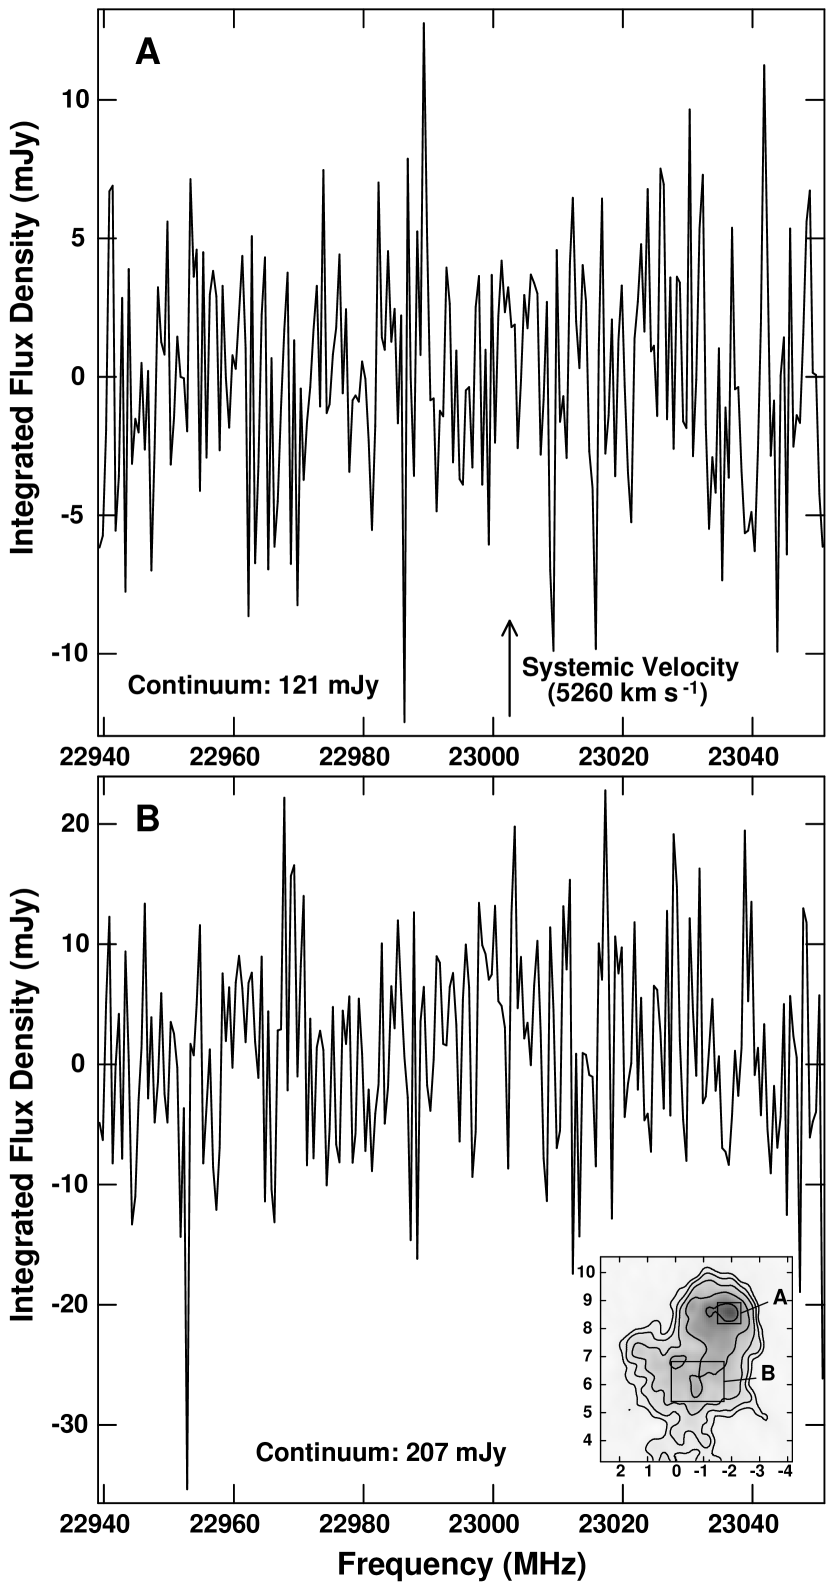
Two example spectra from the difference image cube are shown in Figure 3. Each is the spatially integrated difference flux density spectrum for one of two regions of the northern feature whose locations are shown in the inset. Region A includes the peak of the northern feature while Region B is closer to the core where a stronger line might be expected based on the radial gradient of the free-free absorption found by Walker et al. (2000). For Regions A and B, the integrated flux densities in the continuum image are 121 and 207 mJy respectively while the spectra have one sigma noise levels of 4.1 and 8.5 mJy. The three sigma upper limits to the line-to-continuum ratio are 0.10 and 0.12. Adjusting for the possible degradation of flux due to self-calibration, discussed earlier, these results suggest that any line is less than about 15% of the continuum. This is the value that will be used in the discussion below. Note that this limit required some spatial integration. On a point by point basis, the three sigma limit to the line-to-continuum ratio is not much better than 0.5.
Note that the difference image noise level is about of the total continuum flux density. Any attempt to make an equivalently sensitive search for the recombination line with a single dish or an interferometer that could not resolve the northern feature would have required bandpass calibration to better than a part in , a difficult limit to achieve.
4 Discussion
As noted in the Introduction, the radio continuum observations give good evidence that the parsec scale structure of 3C 84 includes an opposing pair of jets inclined at about to the line-of-sight with significant amounts of ionized gas in the region between the jets. The ionized gas is most likely associated with the accretion disk that would be there in most AGN models. The projected distance from the northern feature to the core is about 2.5 pc so, with the above geometry, the region of the jet that emits the absorbed radiation is about 5 pc from where the radiation passes through the disk on the way to the Earth. That is a small enough distance that, as also noted in the Introduction, gas at the disk would be subject to a sufficiently high radiation intensity that radiation damping would be expected to broaden the H65 recombination line to thousands of km s-1, preventing detection in our observations. Our non-detection is consistent with this expectation.
If a line had been detected, the lack of excessive radiation damping would constrain the gas to lie beyond some minimum distance from the radio emitting regions. The actual distance limit depends on which portions of the overall radio source illuminate the absorbing gas. The bare minimum illumination is from the northern feature, the feature for which the free-free absorption is seen. If that is the only radiation illuminating the absorbing gas, the separation between the northern jet and the absorbing region would have to be at least 11 pc for the radiation damping line width to be below the approximatly 500 km s-1 upper limit for what could have been detected in our observations. That is over twice the distance between the northern jet and the disk in the geometry derived from the continuum observations. It is a bare minimum distance, because both the southern feature (near side jet) and the core region most likely also illuminate the absorption region. With this additional illumination, the minimum distance between the emitting and absorbing regions would need to be much higher, up to about 50 pc if all regions illuminate the absorbing gas. Thus if a line had been observed, and the physics is right, the absorbing region would have to be sufficiently far from the various radio sources that the idea that it is associated with the accretion disk would be wrong. That, in turn, would leave us struggling to explain why only the northern feature is free-free absorbed.
The free-free absorption of the northern feature gives the EM, for any assumed temperature, of the ionized gas along the line-of-sight (Walker et al., 2000). The EM is a function of the electron density and the absorbing region thickness so its value constrains those parameters. The upper panel of Figure 4 shows the constraints for an assumed temperature of K. Constraints for a range of values of the EM are shown representing the range observed over different positions along the northern feature. Two other limits are also shown. The horizontal line is at 2.5 pc, the projected core distance of the centroid of the counterjet. This is a rough upper limit for the thickness of the absorbing region if it is associated with the accretion disk. For the observed emission measures, this thickness limit constrains the density to values above about cm-3. A second limit, given by the lack of significant Thomson optical depth, is also shown. Given the observed free-free absorption, the Thompson optical depth would only be important at very large sizes and low densities. This could become an issue if the absorbing region is actually far enough from the AGN core to avoid severe line broadening by radiation damping.
If saturation and radiation damping were not a problem, the non-detection of H65 could be used, along with the measured EM, to place some constraints on the physical conditions of the free-free absorbing gas. For completeness, we will show those constraints. The constraints would be of interest if the absorbing region is actually farther from the continuum radiation source than we believe or if for some reason the radiation damping is not as severe as we believe.
Using the measured EM and the assumed temperature, the optical depth of maser-like recombination line emission that would be expected from the absorbing gas can be calculated for a range of values of density and line width. The lower panel of Figure 4 shows the results of such calculations for an emission measure that is midway between the values obtained from the continuum absorption. The calculations are based on departure coefficients very similar to those of Salem & Brocklehurst (1979) and are for the case when external radiation does not affect the level populations or line width. Optical depths are plotted for several different line widths. The figure also shows the upper limit to the line-to-continuum ratio of 0.15 that was derived above from the data. In the absence of saturation or radiation damping, Figure 4 shows that the recombination line non-detection would imply that the absorbing gas must have an appropriate combination of high density or high line width, presumably due to turbulence or other dynamic effects. Or it could be at a velocity outside the observed window. Note that the thermal line width for the assumed temperature is lower than the smallest velocity width shown.
To put the velocity range and line widths observed into some perspective, consider that the orbital velocity at about 3.3 pc from a black hole is about 700 km s-1, or about half of the total observed velocity range. That mass is clearly uncertain but is what was estimated by Wu & Han (2001) using the correlation between black hole mass and bulge velocity dispersion. The 3.3 pc distance is just the observed offset of 2.5 pc deprojected along the disk for the geometry described earlier. That orbital velocity shows that it is possible for gravitationally bound material in the region of interest to be moving fast enough to produce line widths high enough to explain our non-detection. But it also shows that, if the absorbing material is moving with the disk, it could be observable. This would depend on the reasonable assumptions that the disk is moving transversely where it crosses the sight lines to the far-side jet, and that it has an internal velocity spread that is much smaller than the orbital velocity.
The Broad Line Region (BLR) line widths in NGC 1275 are of the order of our total frequency span (see, for example, Nelson & Whittle, 1999). A recombination line that wide would both not be sufficiently intense to observe, according to Figure 4, and would be washed out by our primary data reduction technique. But typical BLR sizes, determined from reverberation mapping, are much smaller than the region probed by the sight lines through the free-free absorbing material. Therefore the BLR line widths would only be a problem if the high velocities are maintained well beyond the region that emits the optical lines.
The most rudimentary models of accretion disks predict temperatures at distances such as those of interest here (few parsecs) that are too low to imply the presence of ionized gas. But the free-free absorption shows that such gas is present. Other lines of evidence, based on attempts to understand optical lines, also suggest that ionized gas is present (see Collin & Huré, 1999, and references therin). It is possible that such gas is not in the plane of the disk, but rather in an atmosphere or wind above the disk that is ionized by energetic photons from the central regions of the system. If this is the case, the constraints shown in Figure 4 apply to the ionized atmosphere or wind, not the neutral core of the disk. If a wind is involved (see, for example Königl & Kartje, 1994), it is likely that the the velocity would be outside the observed window, providing a natural explanation for the lack of an observed recombination line even if it weren’t for the effects of the external radiation.
5 Summary
A search has been made for the H65 recombination line in the radio source 3C 84 in the center of NGC1275. Observations of free-free absorption against the northern feature at about 2.5 pc projected distance from the core of this source suggested that, for a wide range of possible densities, such recombination lines could be observed. The recombination lines were only expected to be observed against the weak northern feature which is probably the receeding jet on the far side of the source. The ability of the VLBA to separate this feature from the rest of the source spatially was used to relax the bandpass calibration requirements and to allow the use of a novel scheme to to do an accurate bandpass calibration based on the source itself. These advantages allowed a much deeper search for the recombination line to be made than would have been possible with lower spatial resolution.
No H65 line was found. The limit on the optical depth is approximatly 0.15, depending on exactly how the measurements are made and what region is measured.
The non-detection is expected because of saturation and radiation damping caused by the intense radio radiation from the jets. Therefore conclusions cannot be made about the physical conditions in the the free-free absorbing region unless that region is actually much further from the jets than the geometry would suggest — a bare minimum of twice as far as expected and probably much further. If saturation and radiation damping were not an issue, the recombination line optical depth limit would constrain the free-free absorbing material to have a combination of high line width and high density, as shown in Figure 4. Alternatively, the absorbing material could have a velocity significantly offset from the systemic value. High line widths and offset velocities are often seen in AGN, including NGC 1275. The most extreme velocities and line widths are in the BLR, which is smaller than the region of the absorption, but velocities adequate to hide the recombination line could occur on the appropriate scales.
References
- Collin & Huré (1999) Collin, S. & Huré, J.M. 1999, A&A, 341, 385
- deVaucouleurs et al. (1991) de Vaucouleurs, G., de Vaucouleurs, A., Corwin, H. G., Jr., Buta, R. J., Paturel, G. & Fouque, P. 1991, Third Reference Catalog of Bright Galaxies Vol.3 (Heidelberg: Springer-Verlag)
- Königl & Kartje (1994) Königl, A. & Kartje, J. F. 1994, ApJ, 434, 446
- Levinson, Laor, & Vermeulen (1995) Levinson, A., Laor, A., & Vermeulen, R. C. 1995, ApJ, 448, 589
- Momjian, Romney, and Troland (2002) Momjian, E, Romney, J. D., & Troland, T. H. 2002, ApJ, 566, 195
- Napier et al. (1994) Napier, P. J., Bagri, D. S., Clark, B. G., Rogers, A. E. E., Romney, J. D., Thompson, A. R., & Walker, R. C. 1994, Proc. IEEE, 82, 658
- Nelson & Whittle (1999) Nelson, C. H. & Whittle, M. 1999, ApJS, 99, 67
- Salem & Brocklehurst (1979) Salem, M. & Brocklehurst, M. 1979, ApJS, 39, 633
- Shaver (1976) Shaver, P. A. 1976, A&A, 49, 1
- Shaver (1978) Shaver, P. A. 1978, A&A, 68, 97
- Silver, Taylor, & Vermeulen (1998) Silver, C. S., Taylor, G. B., & Vermeulen, R. C. 1998, ApJ, 502, 229
- Vermeulen, Readhead, & Backer (1994) Vermeulen, R. C., Readhead, A. C. S., & Backer, D. C. 1994, ApJ, 430, L41
- Walker, Romney, & Benson (1994) Walker, R. C., Romney, J. D., & Benson, J. M. 1994, ApJ, 430, L45
- Walker et al. (2000) Walker, R. C., Dhawan, V., Romney, J. D., Kellermann, K. I., & Vermeulen, R. C. 2000, ApJ, 530, 233
- Wu & Han (2001) Wu, X. & Han, J. L. 2001, A&A, 380, 31