The dynamical state of the Coma cluster with XMM-Newton
We present in this paper a substructure and spectroimaging study of the Coma cluster of galaxies based on XMM-Newton data. XMM-Newton performed a mosaic of observations of Coma to ensure a large coverage of the cluster. We add the different pointings together and fit elliptical beta-models to the data. We subtract the cluster models from the data and look for residuals, which can be interpreted as substructure. We find several significant structures: the well-known subgroup connected to NGC 4839 in the South-West of the cluster, and another substructure located between NGC 4839 and the centre of the Coma cluster. Constructing a hardness ratio image, which can be used as a temperature map we see that in front of this new structure the temperature is significantly increased (higher or equal 10 keV). We interpret this temperature enhancement as the result of heating as this structure falls onto the Coma cluster. We furthermore reconfirm the filament-like structure South-East of the cluster centre. This region is significantly cooler than the mean cluster temperature. We estimate the temperature of this structure to be equal or below 1 keV. A possible scenario to explain the observed features is stripping caused by the infall of a small group of galaxies located around the two galaxies NGC 4921 and NGC 4911 into the Coma cluster with a non-zero impact parameter. We also see significant X-ray depressions North and South-East of NGC4921, which might either be linked to tidal forces due to the merger with the Western structure or connected to an older cluster merger.
Key Words.:
Galaxies: clusters: general, intergalactic medium, general; Cosmology:miscellaneous; large-scale structure of the Universe; X-rays: general1 Introduction
The Coma cluster, also known as Abell 1656, is one of the best studied clusters in our Universe (see Biviano biviano (1998) for a historical review). It has been explored in all wavelengths from radio to hard X-rays. However, despite the large number of observations, the physics of the Coma cluster and its dynamical state is not yet completely understood. The cluster hosts a powerful radio halo (Feretti & Giovannini feretti (1998)) and Beppo-Sax data recently revealed the existence of hard non-thermal X-ray emission (Fusco-Femiano et al. fusco-femiano (1999)).
Extensive work has been carried out to measure the velocity dispersion and distribution of the galaxies located in the Coma cluster. Colless & Dunn (colless (1996)) for example published a catalog of 552 redshifts and determined the mean redshift of the cluster to be km/sec and a velocity dispersion of km/sec. Colless & Dunn (colless (1996)) find and confirm the presence of substructure in the galaxy distribution: there is a sub-group located around NGC 4839, which lies to the South-West of the cluster. The existence of this substructure was originally found by Mellier et al. (mellier (1988)) and Merritt & Trimbley (merritt (1994)). Furthermore, it was noted by Fitchett & Webster (fitchett (1987)) that the two central galaxies, NGC 4889 and NGC 4874 have a significant difference in velocity, which is indicative of a recent merger. It is probable that NGC 4889 belonged to a subgroup, which recently merged with the main cluster and that NGC 4874 is the central dominant galaxy of the main cluster.
There are a number of papers addressing the thermal X-ray emission of the Coma cluster which comes from the hot thermal intracluster medium (ICM). White, Briel & Henry (white (1993)) discussed substructures in the Coma cluster based on ROSAT-data. Briel, Henry & Böhringer (briel92 (1992)) analyzed the ROSAT All-Sky-Survey data and determined the X-ray surface brightness profile of the cluster out to a radius of roughly 100 arcmin. Hughes (hughes (1989)) performed an extensive mass analysis on the Coma cluster based on X-ray and optical data. Later work by Vikhlinin, Forman & Jones (vikhlinin (1997)) revealed the existence of a filament-like substructure, which is most likely linked to NGC 4911, a bright spiral galaxy located South-East with respect to the centre of the cluster. Spectroimaging studies based on ASCA-data constrained the X-ray temperature distribution of the ICM. Honda et al. (vikhlinin (1997)) and Watanabe et al. (watanabe (1999)) presented temperature maps of the Coma cluster based on ASCA-data, which clearly showed that the ICM is not isothermal. Furthermore, Donnelly et al. (donnelly (1999)) saw indications for a hot spot North of the centre of the Coma cluster. Recently, first results of the Coma cluster based on XMM-Newton data were published: Briel et al. (briel01 (2001)) discussed the overall morphology of the cluster and showed the existence of several point-like sources, which are linked to individual galaxies in the cluster and which have not been accounted for in previous studies. Arnaud et al. (2001a ) presented a temperature map of the central part of the cluster based on XMM-Newton data with unprecedented spatial resolution. This map showed again variations of the X-ray temperature (see Jansen et al. jansen (2001) for an overview of XMM-Newton and Turner et al. turner (2001) and Strueder et al. strueder (2001) for an overview of the EPIC detectors). However, the previously found hot spot found by Donnelly et al. donnelly (1999) was not confirmed. Lastly, Neumann et al. (neumann (2001)) presented strong evidence based on XMM-Newton data that the substructure located around NGC 4839 (see above) is on its first infall onto the cluster from the South-West and has not yet passed its centre. This is in contradiction with previous work by Burns et al. burns (1994), who suggested that the group around NGC 4839 has already passed the centre of the Coma cluster once.
The aim of this paper is to perform a substructure and spectroimaging study of the Coma cluster based on XMM-Newton data, to better understand the underlying physics. The work presented here is our first attempt to discuss the overall dynamics of the cluster, and is by no means exhaustive. It aims to show the large potential provided by the data obtained with XMM-Newton . The paper is organized as follows: after the introduction we present the observations in Sec.2. This is followed by the description of our data treatment in Sec.3. In Sec.4 we present our spatial analysis and in Sec.5 we describe our spectro-imaging results. In Sec.6 we discuss our results and finish in Sec.7 with the Conclusion.
Throughout this paper, we assume km s-1 Mpc-1, and . At a redshift of , corresponds to 38.9 kpc. The cluster is sufficiently close so that variations of the geometry of the universe do not matter.
2 Observations
The size of the Coma cluster (roughly 3 degrees in diameter) greatly exceeds the field-of-view (FOV) of XMM-Newton . Therefore the observations of Coma were performed in mosaic mode with several exposures pointing at different regions of the cluster. The summary of all observations is shown in Tab.1. The exposure times indicated are the effective observing times after flare rejection. We apply the same method and thresholds for flare rejection as described in Majerowicz, Neumann & Reiprich (majerowicz (2002)) for the pn and MOS-cameras. During the observations the pn-camera was mostly operating in extended-full-frame mode. There was one additional Coma pointing, in which only the pn-camera was active (Coma 2), for which we were not able to run the pipeline processing at the time of the analysis. Thus we discard this observation in the following.
| pointing | camera | exposure | RA | Dec. | date |
|---|---|---|---|---|---|
| no. | in sec | in deg. | in deg. | mm/yy | |
| 10 | m1 | 18576 | 194.910 | 28.1278 | 06/00 |
| m2 | 18584 | ||||
| pn | 17500 | ||||
| 11 | m1 | 13845 | 194.652 | 28.3989 | 06/00 |
| m2 | 15237 | ||||
| pn | 13754 | ||||
| 1 | m1 | 26559 | 194.199 | 27.4019 | 06/00 |
| m2 | 26594 | ||||
| pn | 23732 | ||||
| 2 | m1 | 26046 | 194.427 | 27.7272 | 12/00 |
| m2 | 26062 | ||||
| pn | 15000 | ||||
| 3 | m1 | 12519 | 194.634 | 27.4033 | 06/00 |
| m2 | 11523 | ||||
| pn | 11730 | ||||
| 4 | m1 | 476 | 195.019 | 27.5233 | 06/00 |
| m2 | 582 | ||||
| pn | 2970 | ||||
| 5 | m1 | 14977 | 194.865 | 27.7814 | 05/00 |
| m2 | 16485 | ||||
| pn | 14211 | ||||
| 6II | m1 | 14943 | 194.708 | 27.9811 | 12/00 |
| m2 | 14942 | ||||
| pn | 8874 | ||||
| 6 | m1 | 6548 | 194.708 | 27.9811 | 06/00 |
| m2 | 6744 | ||||
| pn | 3969 | ||||
| 7II | m1 | 23755 | 194.365 | 28.1447 | 12/00 |
| m2 | 23245 | ||||
| pn | 8874 | ||||
| 7 | m1 | 3153 | 194.365 | 28.1447 | 06/00 |
| m2 | 2960 | ||||
| pn | 358 | ||||
| 8 | m1 | 23455 | 195.357 | 27.7314 | 12/00 |
| m2 | 24172 | ||||
| pn | 18430 | ||||
| 9 | m1 | 19951 | 195.136 | 27.9497 | 06/00 |
| m2 | 20361 | ||||
| pn | 15443 | ||||
| bgd | m1 | 21145 | 195.404 | 27.3311 | 06/00 |
| m2 | 21563 | ||||
| pn | 17534 | ||||
| cen | m1 | 16103 | 194.945 | 27.9500 | 05/00 |
| m2 | 15894 | ||||
| pn | 14595 |
3 Data treatment
Our analysis presented here is based on SAS-version 5.1 and concerns only events in the field-of-view (FOV).
3.1 Vignetting correction
In order to correct for vignetting we apply the photon weighting method described in Arnaud et al. (2001b ). To outline it briefly: to each observed event at energy falling onto the detector position we attribute a correcting factor:
| (1) |
the effective area takes into account the mirror surface, the RGA structure (in the case of the MOS-cameras), the filter transmission as well as the quantum efficiency of the detectors. We assume in our anaylsis that the filter transmission and the quantum efficiency are flat over the entire field of the detector. stand for on-axis position.
All images presented in this study are vignetting corrected. For this we create images by adding the different weight factors of the photons into image pixels. The statistical uncertainty per image pixel is calculated as
| (2) |
where is the number of photons per pixel.
3.2 Merging of the different exposures
While merging the data from different exposures we observed certain offsets of the order of a few arcseconds for which we corrected by looking at point sources, which were visible in two or more pointings. We shifted the pointings so that the same point source, visible in different exposures, appeared in each pointing at the same sky coordinate position. We estimate the remaining errors in the order of a few arcseconds.
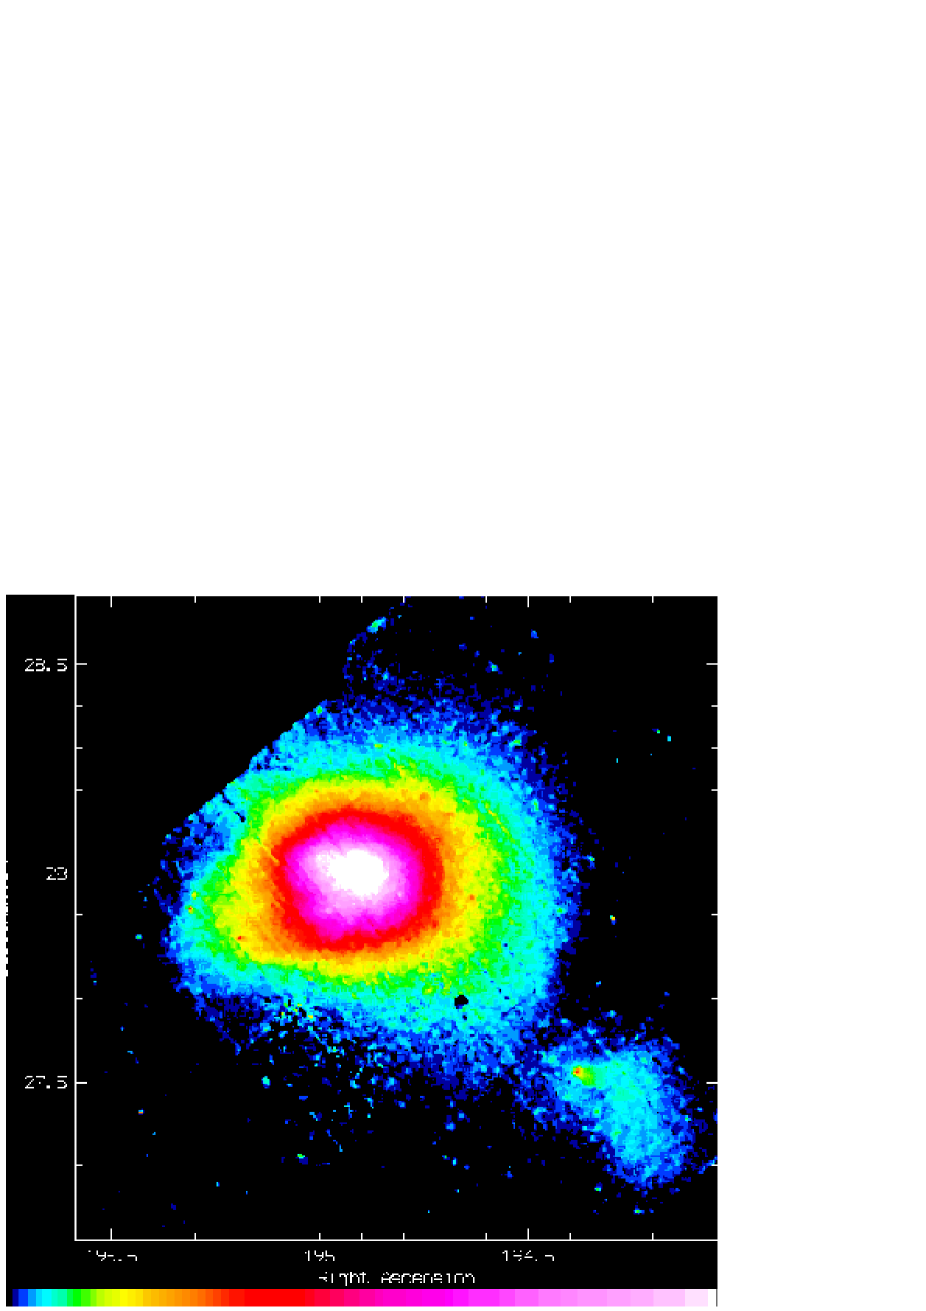
Fig.1 shows the resulting countrate image in the energy band 0.5-2.0 keV after merging the different observations together (MOS and pn) and subtracting the background. For the background we used the Blank-Sky observations provided by D. Lumb and retrievable from the XMM-Newton web-pages. The background subtraction is not important for the construction of the countrate images, however, it is important for the determination of the hardness ratio map (see below).
In order to obtain Fig.1 we perform the following data treatment:
-
•
Merge the photon weight images of the individual MOS (MOS1+MOS2) pointings together (image: mergemos) in the energy range 0.5-2.0 keV
-
•
Create the corresponding MOS mosaic exposure map (image: mergemosexpo), which consists of the sum of the different detector masks111The detector mask represents the geometry of the detector which includes gaps between the CCD’s, the region of FOV, and excludes bad pixels, which were identified in the pipeline processing per observation and camera (MOS1 and MOS2), which are multiplied by the observing time of the corresponding exposure before summing.
-
•
Divide mergemos by mergemosexpo = countratemos
-
•
Create corresponding background countrate image for MOS (image: backgroundmos) in the same energy range as in mergemos. For each MOS exposure we construct a vignetting corrected background exposure, for which we use as input the blank sky observations compiled by D. Lumb. The corresponding photon weight images are added together. We construct the corresponding exposure map of the background and divide the photon weight image by the exposure map. The result is a background countrate image backgroundmos.
-
•
countratemos - backgroundmos = sourcemos
-
•
Merge the photon weight images of the pn images (image: mergepn) in the same energy range as was used for MOS.
-
•
Create the corresponding pn exposure map (image: mergepnexpo) in the same way as done for MOS
-
•
Create background countrate image for pn in the same manner as for MOS (image: backgroundpn)
-
•
Divide mergepn by mergepnexpo = countratepn
-
•
countratepn - backgroundpn = sourcepn
-
•
sourcemos + sourcepn = total background-subtracted countrate image = Fig.1
For all observations MOS and pn were operated at the same time and had, perhaps with the exception of pointing no.4, sufficiently long exposure times to give for each type of instrument an adequate countrate estimate per pixel. Therefore it is correct to add together the different countrate images obtained by the different detectors. If for one observation only one type of camera had been available we could not add the countrate images since this individual exposure would create biases in our mosaic image due to the different sensitivities and spectral responses of the detector types.
We want to stress that the Coma pointings were performed in medium filter mode while the data used for the background are compiled from observations mainly using thin filter. However, since we only use photons at energies above 0.5 keV we expect the difference of the different filters to be negligible. Furthermore, at regions with high signal-to-noise ratio we expect that the background subtraction is not important.
4 Spatial analysis
4.1 Substructure analysis
Our aim in this study is to look for substructure and temperature variations in order to better understand the dynamical state of the Coma cluster.
For measuring substructure we fit an elliptical beta-model to the cluster images, which describes a relaxed cluster without substructure . Subsequently, we create a synthetic cluster image based on the best fit parameters of the beta-model. This model is subtracted from the data. The residuals remaining after subtraction, which indicate substructure, are examined for their significance. This method has been applied to useful effect in several other studies, e.g., Neumann & Böhringer neumann97 (1997), neumann99 (1999) and Neumann neumann99b (1999).
In the following we describe the different steps of our substructure analysis in detail.
4.1.1 Beta-model
In fitting elliptical beta-models to the XMM-Newton data, we take as input the vignetting corrected images in the 0.5-2.0 keV energy band. This energy range was chosen since it provides the best signal-to-noise ratios (see Scharf scharf (2002)). For this analysis we did not subtract the background, since we include it as fit parameter. We compare (see below and Tab.2) the fitted background values with the countrate values observed in the background observations. This is a consistency check for the applied background subtraction.
We encounter small number Poisson statistics in the pixels located at the outskirts of the cluster. This produces non-symmetric error bars for the pixel values. Since we use statistics for our beta-model fitting, which assumes a symmetric Gaussian probability distribution for the photons, we have to correct for the asymmetry of the error bars. An easy way to do this is to apply a Gaussian filter () to the image before fitting the model. This procedure has proven to be valid and gives good results as shown in previous studies (e.g. Neumann & Böhringer neumann97 (1997), neumann99 (1999); Neumann neumann99b (1999)). In order to account properly for the vignetting, in our calculation of the error bars per pixel we quadratically add the different weighting factors for each event in each pixel before Gaussian filtering (see eq(2)), and use this image as estimate for the uncertainties in each pixel.
To check for possible instrument-dependent variations we treat the MOS- and the pn-data separately. The fit results are displayed in Tab.3. They are in good agreement with each other and with previous studies, like Briel, Henry & Böhringer (briel92 (1992)) . Since we are only interested in the best-fit model in order to subtract it from the cluster data and check for residuals, we do not determine error bars on the fit parameters, which would be time consuming since the error bars would have to be estimated via a Monte-Carlo approach.
The centre of both the MOS and the pn-data fit coincide relatively well with the position of the central galaxy NGC 4874, at: RA=194.898 and Dec.=27.963. The distance between the model centre and this galaxy is less than 2 arcmin.
| MOS | pn | |
|---|---|---|
| observed background | ||
| countrate in counts/sec/pixel | ||
| fitted background | ||
| countrate in counts/sec/pixel |
| camera | ||||||
|---|---|---|---|---|---|---|
| cts s-1 arcmin-2 | in deg. (J2000) | in deg. (J2000) | in arcmin | in arcmin | ||
| MOS | 0.094 | 194.929 | 27.9586 | 11.1 | 9.0 | 0.72 |
| pn | 0.28 | 194.927 | 27.9597 | 12.1 | 11.2 | 0.85 |
4.1.2 Significance of residual map after beta-model subtraction
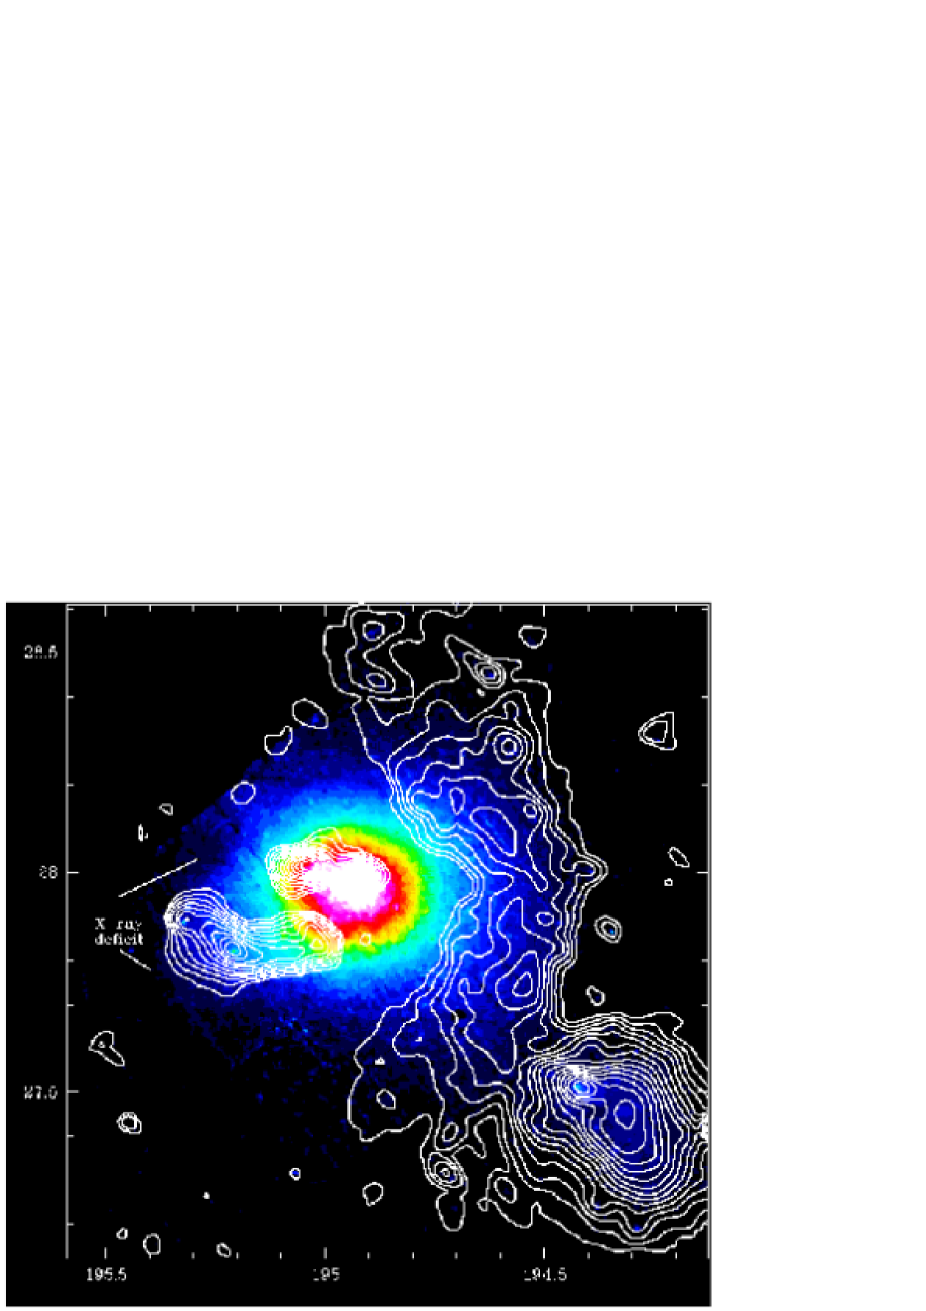
We subtract the cluster model based on the best fit parameters of the beta-model and calculate the corresponding significance of the residuals for each instrument type independently. The exact method we use for calculating the significances is described in Neumann & Böhringer (neumann97 (1997)). For our residual calculation we apply a Gaussian filter with . We obtain two significance maps, one for the MOS-cameras, and the other for the pn-camera. The residuals obtained for each type of camera are very similar. We quadratically add the two different significance maps in order to obtain a residual image with better statistics. The result is shown in Fig.2. The image over which we display the significance contours is the same as in Fig.1.
We want to stress that the resulting residuals with a significance equal or higher than +10 are extremely stable against changing the parameters of the subtraced model.
4.1.3 Results
The residual map shown in Fig.2 shows several significant structures:
-
•
the extended X-ray emission around and behind NGC 4839, which was already detected and described in previous papers.
-
•
a significant (the lowest contour is ) structure in the West, which is located between the Coma centre and the subgroup around NGC 4839 at a distance of about 0.9 Mpc. The structure is elongated in North-South direction with an extent of about 50 arcmin, which corresponds to about 1.7 Mpc. The width of the structure in East-West direction is about 20 arcmin or 0.6 Mpc. The structure shows two extended maxima at RA=12:58:1.26 and Dec.=27:44:32.25 for the first maximum and RA=12:58:16.88 and Dec.=28:6:17.68 for the second. The entire structure is slightly bent tangentially to the Coma centre.
-
•
a residual with a filamentary shape is found to the East of the cluster centre. A similar residual at the same location was already presented by Vikhlinin et al. (vikhlinin (1997)) in a wavelet analysis of ROSAT data. The structure is elongated in the East-West direction and bends to the North at its Eastern end. The projected length of this filamenary structure is in the order of 28 arcminutes (which corresponds to roughly 1 Mpc) and has a width in the order of 6 arcminutes (about 200 kpc).
-
•
a deficit in X-ray emission is detected North and South-East of the filamentary Eastern structure (see above). The precise significance and shape of these X-ray decrements is hard to determine (it is around -20), since it is very sensitive to the adopted background level, however, the signal is persistent. This deficit in X-ray emission can already be observed in Fig.1 comparing the overall emission South-East of the cluster with the overall emission North and West of the Coma cluster. We do not show contours of these negative residuals in Fig.1 since their shape strongly depends on the adopted background level.
-
•
an excess of emission in the centre, which is linked to the two dominant central galaxies NGC 4874 and NGC 4889. These residuals are signs for the two galaxies to have deep individual gravitational potentials, which create small gas halos within the larger scale of the cluster.
One important question is whether the detected residuals might not be an artefact due to improper modelling, for example the residuals could be due to the wrong determination of position angle of the subtracted model. In order to investigate this possibility we construct cluster models with different position angles which are subsequently subtracted from the Coma data. Even when we change the position angle by 90 degrees, the structures with positive residuals keep their overall morphology and significance. Since the centre of the model is very close to the central galaxy NGC 4874, it is most likely that the residuals cannot be caused by incorrect positioning of the centre of the subtracted model.
4.2 Spectro-imaging analysis
In order to measure the temperature distribution of the ICM we determine the hardness ratio map for the Coma cluster. We make use of Fig.1 and of the countrate image in the energy band 2-5 keV.
Both of these images are constructed as described in Sect. 3.2 and are fully background-subtracted. Background subtraction is crucial to the construction of the hardness ratio map; without this correction background-dependent variations would appear in the final image.
In order to avoid artefacts due to photon statistics, we apply a median filter to the images in the 0.5-2.0 keV and the 2.0-5.0 keV band. We filter over a region of 12 by 12 pixels (pixel size is ) before we divide the image obtained in the higher energy band by the image in the low energy band. Applying a median filter not only helps for the statistics but also filters out the emission of individual sources such as galaxies or AGN. Since there are insufficient statistics in the outskirts of the cluster to reliably constrain the hardness ratio, we restrict ourselves to regions in which the countrate in the energy band 2-5 keV band is above cts/sec/pixel. This is a very conservative limit (see below) which helps avoid artefacts linked to imperfect background subtraction or to small number statistics.
4.2.1 Results
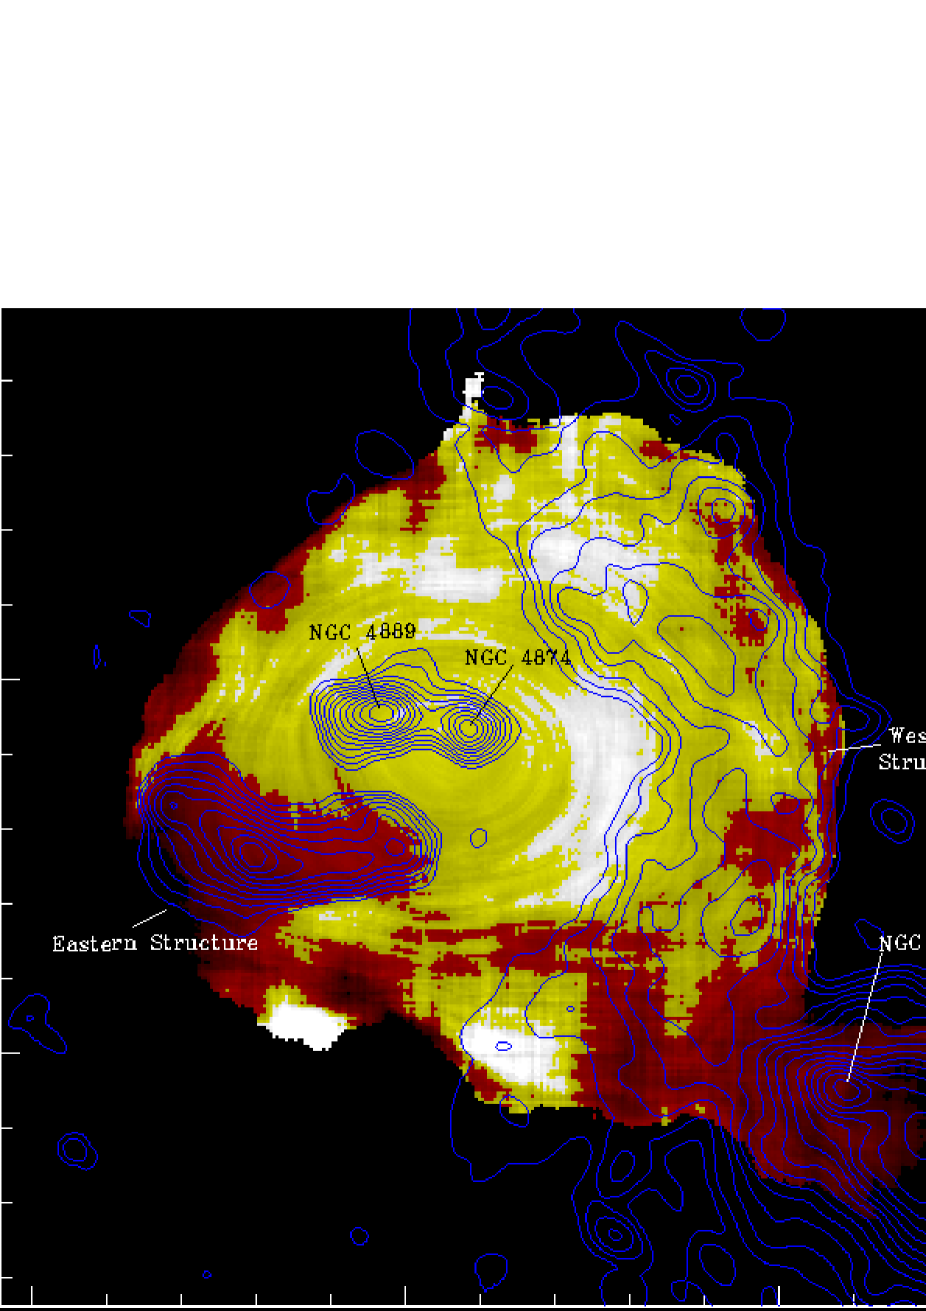
The hardness ratio image is shown in in Figure 3. The image is in three colours; red shows temperatures below 8 keV, yellow regions between 8-10 keV and white are regions with temperatures above 10 keV. Our results are in good agreement with those obtained by Arnaud et al. (2001a ) and Briel et al. (briel01 (2001)).
Are the differences in hardness ratio significant or not? In order to evaluate the errors, we perform the following approximation:
we only look at regions in the hardness ratio image in which the countrate in the 2-5 keV band is larger or equal to cts/sec per pixel (the pixel size is ). Assuming a mean exposure of 20 ksec per camera, we obtain 8 photons per pixel222this takes into account the fact that we calculated the countrate assuming only one MOS camera with a total exposure time of MOS1 plus MOS2. . Since the observed mean hardness ratio is roughly 0.3 (which corresponds to a plasma temperature of about 8 keV), the countrate in the 0.5-2 keV band is a factor of about 3 higher than the countrate in the higher energy band. Thus, we obtain roughly 24 photons per pixel in a 20 ksec exposure. This calculation takes only into account the source countrate. For the proper error calculation we also have to include the background countrate which we subtracted via the blank sky observations. The total background countrate in the 0.5-2.0 keV band is cts/sec/pixel and for the 2.0-5.0 keV band cts/sec/pixel. Furthermore, for the hardness ratio image we applied a median filter derived from the pixel values in a window of image pixels. If we assume that the median filter has the same error as if one averages over all pixels, a good approximation, we can determine the errors by calculating the total number of photons and using error propagation including the background. We obtain a -error of 0.01 in the hardness ratio. This corresponds to about 0.5 keV for temperatures below 10 keV. We want to stress that this is the error estimate for the outer region. In the inner parts, where the statistics are much better, the errors are much smaller. As an example: from the outer parts from the cluster, to the centre, the increase of X-ray intensity is of the order of a factor of 20.
One final point concerning the results: the hardness ratio image shows two “hot spots” to the South. The significance of these two points is very low since they lie both in pointing no.4, which has an exceptionally low exposure time (see Tab.1). It is thus quite likely that these features are statistical artefacts.
5 Discussion
5.1 Infall of a substructure located between Coma center and NGC 4839
In Figure 3, there is an obvious, large residual to the West of the cluster centre. The region lying between this structure and the Coma centre shows a temperature increase to temperatures equal to or above 10 keV. This suggests that it is heated via compression or via shock waves, which were created during the infall of this sub-structure onto the Coma centre. The creation of shock waves is observed in hydrodynamic simulations of galaxy cluster mergers (see for example Schindler & Müller schindler (1993)). It seems unlikely that the structure is a chance alignment in the line-of-sight.
The two maxima in this western structure could be caused by a disruption of a galaxy group during its infall onto the cluster centre into several smaller units. It is relatively unlikely that two galaxy groups are falling onto the Coma cluster at exactly the same time.
Previous work has shown that the galaxy group around NGC 4839 is falling onto the Coma cluster (see for example Neumann et al. 2001 and references therein). The infall direction coincides with a filament which connects the Coma cluster with Abell 1367, and which is part of the ‘Great Wall’. One may ask if the structure between NGC 4839 and the cluster centre is also falling in from the same direction. If a subcluster infalls from this direction, it will heat up the gas between it and the main cluster via compression. This will lead to an increase in the ram pressure encountered by the subcluster. Pressure increases linearly with temperature for an ideal gas (): the relative difference in temperature between the hot region and the main cluster is , indicating a similar increase in pressure, and which may be sufficient to slow down the infalling gas. It is possible that, due to inertia, the gas in the subcluster is not abruptly slowed down, but instead may move in a direction where there is no increase in pressure. This movement could be tangential from South to North. In this case, the hot region to the North can naturally be explained as due to compression of the remaining gas in the subcluster.
The increase of temperature towards the North has been seen in ASCA-data (see Watanabe et al. watanabe (1999) and Honda et al.honda (1996)). It was interpreted as being due to heating by a shock wave created from a previous merger from a galaxy group located around NGC 4889, which is now one of the two main galaxies in the centre of the Coma cluster. It is not possible at present to distinguish between the two explanations.
Examination of DSS plates does not show any obvious overdensity of galaxies coinciding with the Western residual structure. In this case, one might ask whether this structure is the remaining gas from the subcluster which was once associated with NGC 4889. Ram pressure is known to act much more efficiently on gas than on galaxies, which would provide a natural explanation for the differences in location of the gas and the galaxy. The effectiveness of ram pressure stripping can be seen in the case of the subgroup around NGC 4839, in which the gas is clearly lagging behind the galaxies on the infall trajectory (Neumann et al. neumann (2001)). Taking the projected distance between NGC 4889 and the western substructure ( Mpc) and a typical cluster merger or sound crossing timescale of years, we can calculate the mean difference in velocity between the galaxy and the gas. This value is close to the velocity dispersion of Coma (in the order of 1000 km/sec - Colless & Dunn colless (1996)), which is not surprising given that typical cluster sizes are of order of a few Mpc. The feasibility of this scenario can only be assessed with high resolution hydrodynamic simulations, which take into account the differences of ram pressure between the galaxies and the gas of the merging subgroup.
5.2 The residual to the East
This compact region clearly shows lower values in the hardness ratio image, indicating that this part of the cluster is cooler than the mean cluster temperature.
The filamentary form of the structure suggests that it may be linked to some sort of infall process in connection with ram pressure stripping. Since ram pressure stripping works efficiently only in the centre of the cluster, where the gas density is high, we suppose that this structure is relatively close to the centre of the cluster and not a projection effect. NGC 4911, a bright galaxy which lies in the region of the substructure, shows a relative difference in velocity with respect to the Coma cluster of 1000 km/sec, which is close to the velocity dispersion of the cluster as a whole.
5.2.1 Gas mass estimate of substructure
To determine the origin of the filamentary Eastern structure, and more specifically to know whether the the observed stripped gas comes from an intragroup medium or from an interstellar medium linked to galaxies, we attempt to estimate the mass of gas of this structure. A high value for the mass would suggest that the gas comes from an intragroup medium, a low value would indicate that the origin of the gas is from gas located inside the galaxies.
The structure has a projected distance from the Coma centre of roughly 1 Mpc and enhances the observed flux with respect to the fitted beta-model by about . Using a length of 1 Mpc, a diameter of 200 kpc, and assuming cylindrical symmetry (thus a thickness of the structure in the line-of-sight of 200 kpc), the volume of the substructure .
In order to calculate the gas mass of this structure we have to determine the contributions of the main cluster gas and the gas in the substructure. The contribution of the main cluster gas has to be integrated along the line-of-sight. For this we make use of the previously determined betamodel parameters by Briel et al. (briel92 (1992)) ( Mpccm-3) . The determination of the gas mass of the substructure depends on its location with respect to the cluster. If located at a large distance to the cluster we can simply add the two X-ray contibutions of main cluster and substructure. In this case we find an electron density of the subgroup of cm-3. Integrating this density over the previously calculated volume we find a total gas mass for the structure of M . If we assume that the structure is very close to the centre and that in fact the physical distance towards the Coma centre is close to its projected distance we need to take into account that the gas in the substructure is at the same position than the gas of the main cluster, which enhances the X-ray emission in this region333 If the two regions are only a chance alignment in the line-of-sight the X-ray emission () in this region follows: where is the electron density of the main cluster gas. In the case that the two regions are located at the same place behaves as: . The factor boosts the X-ray emission if the two regions are physically connected.. In this case the required gas density for the subgroup is lower than in the case of no physical connection between the two components. We obtain in this case an electron density of cm-3, and a gas mass of M . Combining the two cases as the two possible extremes we find that the gas mass of the substructure lies between M . This value for the gas mass is at the low end for a group of galaxies (Mulchaey mulchaey (2000)) and suggests that a part of the gas might also come from the interstellar medium of galaxies themselves. The obtained values are in very good agreement with the value obtained by Vikhlinen et al. vikhlinin (1997) with .
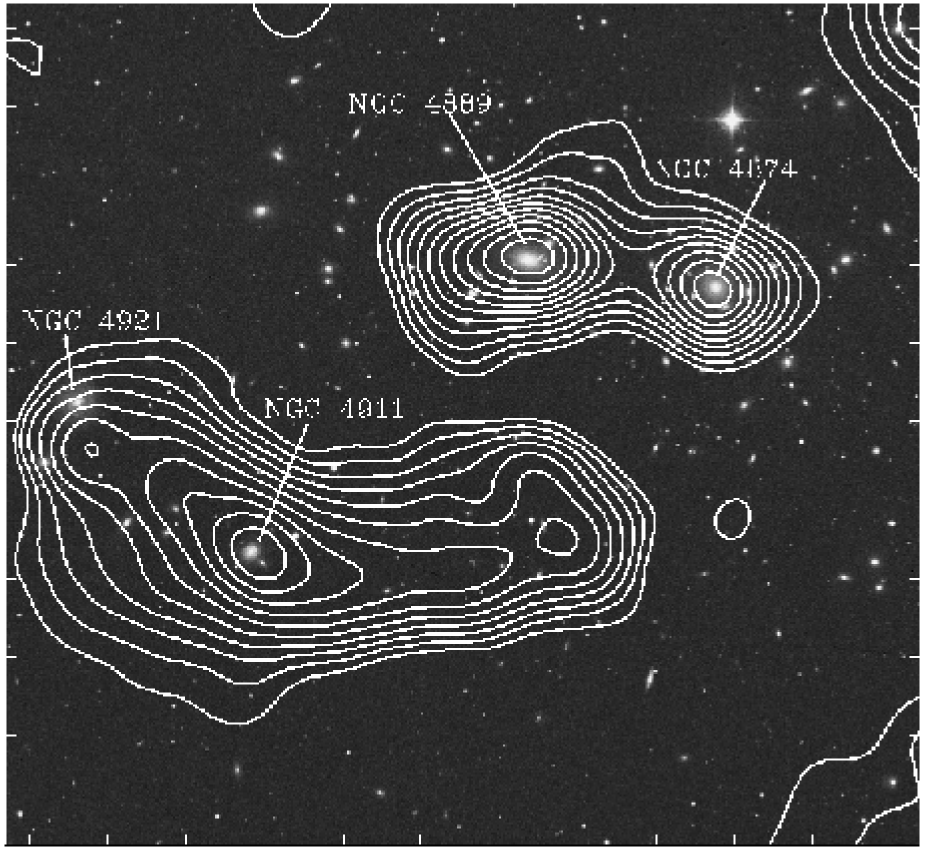
If we assume that the gas mass of the substructure represents roughly ten percent of the total mass of the substructure, which is of the order of magnitude of what is typically found (see for example David, Jones & Forman david (1995)), then we obtain for the total mass M . This is a few times larger than the mass of a massive galaxy and again somewhat at the low end of the mass of groups of galaxies with typically a few (e.g. Mulchaey mulchaey (2000)). NGC 4911 and NGC 4921 lie in this sub-structure and are by far the brightest galaxies (see Fig.4) in this region. Dow & White dow (1995) give a value for the optical luminosity of NGC4911 of (in ) . Since NGC 4921 has a similar magnitude (see Doi et al. doi (1995)), we can assume a similar luminosity. Assuming a mass-to-optical light ratio , we obtain a total mass of NGC 4911 and NGC 4921 of , which is of the same order of magnitude as the value required for the entire filamentary substructure. This indicates that the substructure is largely dominated by the two galaxies.
Matsushita (matsushita (2001)) recently presented a correlation between mass of the hot interstellar medium and optical luminosity for late type galaxies. Applying this correlation to NGC 4921 and NGC 4911 we find a mass for the hot phase in the order of . This is smaller than the value of a few times . If correct, this implies that a large fraction of the gas comes indeed from an intra-group medium.
The X-ray structure we see likely originates from gas in the surrounding intra-group medium of a small group of galaxies plus, to some fraction, which we expect to be in ther order of a few up to 10 or 20 per cent, from the stripped interstellar medium of the two galaxies, NGC 4911 and NGC 4921.
A cursory examination of Figure 2 would suggest that the principal direction of motion is to the West with perhaps an additional component to the North. Figure 4 shows the X-ray residual over the optical image from the DSS, indicating that NGC 4921 is at the Eastern end of the structure and NGC 4911 is right at the position where the structure bends. The only way we can explain this alignment is by assuming a direction of motion to the East, with NGC 4921 at the head of the structure and NGC 4911 behind. The different directions of the stripped tails may indicate different velocity directions for the galaxies, with NGC 4911 only having a projected velocity component towards the East while NGC 4921 has an additional projected component to the North. This could indicate that the structure in which NGC 4911 and NGC 4921 are bound together changes its direction of velocity with time.
Are these two galaxies bound together? If they are, they should have similar measured velocities or redshifts. A combination of NASA Extragalactic Database (NED) and published data (Smith et al. smith (2000)) indicates velocities of km-1 and km-1 for NGC 4911 and NGC 4921, respectively, suggesting that they are indeed gravitationally bound. (Note that the NED velocity for NGC 4921 is incorrect, having been superseded by the Smith et al. measurement.) Since the two galaxies have larger measured velocities than the Coma cluster itself, it is reasonable to assume that the structure is located between us and the Coma cluster, thus lying somewhat in front of the Coma centre (although there is the small possibility that they are background).
We can estimate the temperature of the sub-structure by assuming that it contributes about 30% to the total flux in the region, where it is located (see above). We perform simulations of spectra, assuming a main cluster temperature of 8 keV and a sub-group temperature of 1 keV and calculate the corresponding hardness ratio. We find a hardness ratio of 0.29, in agreement with the hardness ratio values in the region of the substructure. If interactions occur and are important for the emission mechanism, we expect the cold phase to be at a temperature close to or below 1 keV. Thus, 1 keV seems to be a good upper limit for the temperature of the structure. Temperatures around or below 1 keV were found to be typical values for compact groups of galaxies (see for example Helsdon & Ponman helsdon (2000)).
In the scenario described above, the two galaxies must have a tangential component with respect to the centre of the main cluster, which implies that the merger is not a simple two-body encounter. The Coma cluster is surrounded by filamentary structures (see for example Huchra et al. huchra (1990)), and their gravitational pull could explain the non-zero impact parameter of the two galaxies on their infall onto the cluster.
5.3 The two dominant central galaxies
Vikhlinin et al. (vikhlinin01 (2001)) have shown based on a study of Chandra data that the temperatures of the two dominant central galaxies NGC 4874 and NGC 4889 are significantly cooler than the surrounding gas. In our study we do not see a temperature drop in these regions, primarily because we average over a too wide area in our analysis to resolve this cooler gas.
5.4 The X-ray deficit in the South and East of NGC 4911 and NGC 4921
The X-ray deficit in the South and East is difficult to explain. Comparing the overall morphology of the gas and temperature distribution with recent studies based on hydrodynamical simulations, such as Roettiger et al. (roettiger (1997)) and Ricker & Sarazin (ricker (2001)), we cannot find a scenario which matches all observed features. We therefore think that this decrement in X-ray emission is either due to tidal forces linked to the merger with the Western structure 444in this case the gas could follow the mass enhancement linked to the structure falling onto the centre from the West and provoking a diminuition of gas density in the East and South East, or to an older merger, possible connected to the Northern part of the Western substructure. This might be the remnant of a sub group, which already passed the core once. However, the physics of this deficit in emission might be more complex. We want to stress, again, that this decrement is not an artefact of our beta-model fitting. Changing the parameters for the model (position angle, core radius, centre position and background) over a considerable range does not alter the result (see above).
6 Conclusion
We performed a substructure and spectroimaging study based on the XMM-Newton data of the Coma cluster. The data show the existence of substructures which are very likely interacting with the main cluster. The combination of spatial and spectral information based on data obtained with XMM-Newton allows us to put global constraints on the dynamical state of the Coma cluster. These are important for our understanding of the physics of clusters. The results presented here show the large potential of future studies of clusters of galaxies observed with XMM-Newton .
Acknowledgements.
We would like to thank the XMM-Newton EPIC-team for support. In particular we are grateful to K. Dennerl, M. Freyberg and F. Haberl for fast and very competent replies to our questions. Furthermore we would like to thank J. Ballet for his help concerning the analysis based on the XMM-Newton SAS software. We are grateful for the discussions with S. Schindler concerning cluster mergers and M. Arnaud in general. We would also like to thank J. Huchra, who acted as referee for the careful reading of the manuscript. This research has made use of the NASA/IPAC Extragalactic Database (NED) which is operated by the Jet Propulsion Laboratory, California Institute of Technology, under contract with the National Aeronautics and Space Administration. We acknowledge the use of NASA’s SkyView facility (http://skyview.gsfc.nasa.gov) located at NASA Goddard Space Flight Center. This research has made use of NASA’s Astrophysics Data System Service. This work is based on observations obtained with XMM-Newton, an ESA science mission with instruments and contributions directly funded by ESA Member States and the USA (NASA).References
- (1) Arnaud, M., et al., 2001, A&A, 365, L67
- (2) Arnaud, M., Neumann, D.M, Aghanim, N., Gastaud, R., Majerowicz, S., & Hughes, J. P., 2001, A&A, 365, L80
- (3) Biviano, A., 1998, in Untangling Coma Berenices: A New Vision of an Old Cluster, ed. A. Mazure, F. Casoli, F. Durret, & D. Gerbal (Singapore: World Sci.), 1
- (4) Briel U. G., Henry J. P., & Böhringer H., 1992, A&A, 259, L31
- (5) Briel, U. G., et al., 2001, A&A, 365, L60
- (6) Burns J. O., Roettiger K., Ledlow M., & Klypin A., 1994, ApJ, 427, L87
- (7) Colless M., & Dunn A. M., 1996, ApJ, 458, 435
- (8) Doi, M., Fukugita, M., Okamura, S., & Tarusawa, K., ApJ, 1995, 97, 77
- (9) David, L. P., Jones, C., & Forman, W., 1995, ApJ, 445, 578
- (10) Donnelly, R. H., Markevitch, M., Forman, J., Jones, C., Churazov, E., & Gilvanov, M., 1999, ApJ, 513, 690
- (11) Dow K. L., & White S. D. M., 1995, ApJ, 439, 113
- (12) Evrard, A. E., Metzler, C., A., & Navarro, J. F., 1996, ApJ, 469, 494
- (13) Feretti, L., & Giovannini, G. 1998, in A new view of an old Cluster: untangling Coma Berenices, ed. A. Mazure, F. Casoli, F. Durret, & D. Gerbal (Word Scientific Publishing Co Pte Ltd), 123
- (14) Fusco-Femiano, R., dal Fiume, D., Feretti, L., Giovannini, G., Grandi, P., Matt, G., Molendi, S., & Santangelo, A., 1999, ApJ, 513, L21
- (15) Fitchett M., & Webster R., 1987, ApJ, 317, 653
- (16) Helsdon, S. F., & Ponman, T. J., 2000, MNRAS, 319, 933
- (17) Honda, H., et al. 1996, ApJ, 473, L71
- (18) Huchra, J. P., Geller, M. J., & De Lapparent, V., 1990, ApJS, 72, 433
- (19) Hughes, J. P., 1989, ApJ, 337, 21
- (20) Jansen et al., 2001, A&A, 365, L1
- (21) Matsushita, K., 2001, ApJ, 547, 693
- (22) Majerowicz, S., Neumann, D. M., & Reiprich, T., 2002, A&A, 394, 77
- (23) Mellier Y., Mathez G., Mazure A., Chauvineau B., & Proust D., 1988, A&A, 199, 67
- (24) Merritt D., & Tremblay B., 1994, AJ, 108, 514
- (25) Mulchaey, J. S., 2000, ARA&A, 38, 289
- (26) Neumann, D. M., & Böhringer, H., 1997, MNRAS, 289, 123
- (27) Neumann, D. M., & Böhringer, H., 1999, ApJ, 512, 630
- (28) Neumann, D. M., 1999, ApJ, 520, 87
- (29) Neumann, D. M., et al., 2001, A&A, 365, L74
- (30) Ricker, P. M., & Sarazin, C. L. 2001, ApJ, 561, 621
- (31) Roettiger, K., Loken, C., & Burns, J. O. 1997, ApJS, 109, 307
- (32) Scharf, C. A., 2002, ApJ, 572, 157
- (33) Schindler S., & Müller E., 1993, A&A, 272, 137
- (34) Smith, R. J., Lucey, J. R., Hudson, M. J., & Schlegel, D. J., 2000, MNRAS, 313, 469
- (35) Strueder, L. et al., 2001, A&AL, 365, 18
- (36) Turner, M. et al. 2001, A&A, 365, L27
- (37) Vikhlinin, A., Forman, W., & Jones, C., 1997, ApJ, 474, L7
- (38) Vikhlinin, A., Markevitch, M., Forman, W., & Jones, C., 2001, ApJ, 555, L87
- (39) Watanabe M., Yamashita K., Furuzawa A., H. Kunieda, & Y. Tawara, 1999, ApJ, 527, 80
- (40) White S. D. M., Briel U. G., & Henry J. P., 1993, MNRAS, 261,L8