Structural Evidence for Environment-Driven Transformation of the Blue Galaxies in Local Abell Clusters - A85, A496, and A754
Abstract
We present a detailed comparison of structural properties in the rest-frame -band of cluster and field galaxies, selected and analyzed in the same manner, to test the hypothesis that much of the current cluster galaxy membership resulted from the fairly rapid (1-2 gigayears) transformation of infalling, field spirals into red, cluster early-types. Specifically, we have selected galaxies from three nearby Abell clusters (A85, A496 and A754) that have colors significantly bluer than the red sequence population, and compared them to field galaxies with similar colors and luminosities from Jansen et al. (2000, ApJS, 126, 271). The comparison is based on the hypothesis that recent (1-4 gigayears) cluster arrivals were originally blue and star-forming, then stopped forming stars to dim and redden in a few gigayears. For the comparison we quantify galaxy internal structure and morphology from two-dimensional bulge/disk decompositions using GIM2D.
We observe structural differences between blue galaxies in local () clusters, compared to field environments. All cluster galaxies have spectroscopic membership. The majority of blue cluster members, presumably recent additions, are physically smaller and fainter than their equally-colored field counterparts. At a matched size and luminosity, the newer cluster arrivals are quantifiably smoother in appearance, yet their total light is as disk-dominated as in normal field spirals. Moreover, half of the blue cluster members appear to have blue cores or globally blue color profiles, in contrast with field spirals, which typically exhibit red inward color gradients. Blue cores suggest enhanced nuclear star formation, possibly a starburst, while uniformly blue profiles are consistent with an episode of fairly strong global star formation in the past few gigayears. Our previous work (McIntosh et al. 2004, ApJ submitted) shows that the blue membership of local clusters is a recently infalling population that has yet to encounter the dense core. In a Universe without environmental dependent evolution outside of cluster cores, we would expect blue disk galaxies inhabiting field and cluster regions to have similar morphology, size, and color gradient distributions. Our findings show conclusively that not only the abundance of red and blue galaxies depends on environment, but also that fundamental structural and morphological galaxy properties do indeed reflect the environment in which the galaxy is found. Moreover, the data show that the transformation of accreted galaxies is not confined to the dense cluster core. The overall properties of bluer cluster members are best explained by environment-driven transformation of accreted field spirals, and our results suggest that the processes that govern color and morphological evolution occur separately.
1 Introduction
If structure in the Universe forms hierarchically, the massive galaxy clusters we observe locally should have been built through the infall and accretion of matter (i.e. galaxies, groups, subclusters) along large-scale filaments (White & Rees, 1978; White & Frenk, 1991; West, Jones, & Forman, 1995; Kodama et al., 2001, and references therein) As new galaxies fall into regions of greater density, they must interact with both the hot, inter-cluster medium (ICM) and the increased numbers of nearby, cluster neighbors. Given these interactions, it seems plausible that infalling populations undergoing “normal” star formation rates (SFR) will be transformed into red lenticular (S0) galaxies (hereafter the “transformation scenario”, Gunn & Gott, 1972; Charlot & Silk, 1994; Abraham et al., 1996; Dressler et al., 1997; van Dokkum et al., 1998; Moore et al., 1999; Poggianti et al., 1999). The transformation scenario has been invoked to explain the well-known evolution of cluster galaxy color (the Butcher-Oemler effect, e.g. Butcher & Oemler, 1978a, 1984; Rakos & Schombert, 1995; Margoniner et al., 2001; Ellingson et al., 2001) and morphology (Lavery & Henry, 1988; Couch et al., 1994; Dressler et al., 1994a, b; Ellis et al., 1997; Oemler, Dressler, & Butcher, 1997). This scenario is key to the idea of “progenitor bias” put forth by van Dokkum & Franx (2001), which states that the progenitors of the youngest early-type galaxies in clusters were morphologically transformed from later types, and thus would not be considered as part of the early-type population of clusters at larger redshifts. Moreover, this environmental based scenario is compatible with the observed correlations between increased density and cluster galaxy morphology (the relation, e.g. Melnick & Sargent, 1977; Butcher & Oemler, 1978b; Dressler, 1980; Postman & Geller, 1984; Dressler et al., 1997; Hashimoto & Oemler, 1999) and star formation (SF) properties (Balogh et al., 1997, 1998; Hashimoto et al., 1998; Lewis et al., 2002).
Establishing whether the transformation scenario is occurring in low redshift clusters provides important confirmation for the continued hierarchical evolution of these massive systems to the present epoch. For example, finding cluster members in the midst of this predicted evolution will secure the present-day whereabouts of the blue galaxies that were more abundant in clusters (Butcher-Oemler effect), and may give us additional clues to how and where galaxies evolve in dense environments. The literature is replete with evidence for the evolution and environmental dependence of cluster galaxy properties. Yet, even with the huge body of observational data on galaxy clusters in the local Universe, there has been no direct confirmation showing any fraction of their members in the midst of this predicted galaxy transformation. Therefore, this lack of confirmation means either that such transformations are no longer ongoing in the present-day Universe, or that the data and observational tests have been insufficient. To this end we have wide-field imaged three nearby Abell clusters with hundreds of spectroscopic member galaxies to look for evidence of the transformation scenario. In McIntosh et al. (2004, hereafter Paper 2) we established the existence of significant fractions () of blue and moderately blue members with kinematic and spatial properties as expected for a recently infalling population (Diaferio et al., 2001). Finding these populations of late arrivals provided one crucial test of the validity of the transformation scenario. Moreover, we found that many of the blue members have disky visual morphologies, yet lack strong spiral features, perhaps the result of morphological smoothing. In this paper we use quantitative measures of morphology and structure to determine whether the appearances of the recent cluster arrivals differ from those of a control sample of star-forming spirals from the lower density “field” environment. Physical differences between cluster members and field galaxies with similar star-forming blue colors will provide direct observational confirmation for the morphological smoothing aspect of the transformation scenario.
Various physical mechanisms have been put forth to explain the transformation scenario in clusters. There is general agreement that the denser environment will have an effect on the SF properties of new arrivals. The cold neutral gas supply may be removed by ram-pressure stripping during a galaxy’s virial motion through the hot ICM (Gunn & Gott, 1972; Solanes & Salvador-Sole, 1992; Abadi, Moore, & Bower, 1999; Quilis, Moore, & Bower, 2000), or tidal stripping by either the cluster potential or individual galaxies (Spitzer & Baade, 1951; Valluri & Jog, 1990). Alternatively, the star-forming gas could be rapidly consumed in a burst of SF triggered by ram-pressure effects (Dressler & Gunn, 1983; Fujita & Nagashima, 1999), tidal effects (Byrd & Valtonen, 1990; Hashimoto et al., 1998; Bekki, 1999), or galaxy merging (Barnes & Hernquist, 1991; Bekki, 1998). Other authors have suggested that the replenishment of star-forming gas is cut off instead, and that the continuing formation of stars gradually ( gigayear) exhausts the remaining supply of H I (Larson, Tinsley, & Caldwell, 1980; Kodama & Bower, 2001; Balogh, Navarro, & Morris, 2000; Balogh & Morris, 2000). Whether the SF fuel supply is removed, used up or cut off, the result is the eventual end of SF and the passive fading and reddening of the once blue galaxies as their hot, young stars die and their mean stellar population age grows older. This passive “color evolution” has a minimum timescale equal to the lifetimes of the short-lived luminous stars (i.e. 1-2 gigayears for A-type stars), and longer if SF is slowly diminished, rather than suddenly truncated.
It stands to reason that the cessation of SF in spirals will eventually produce an overall smoother galaxy profile by reducing substructure (e.g. spiral arms, H II knots), yet this may take several gigayears or longer. Some dynamical simulations predict that galaxies falling into dense clusters will undergo more rapid ( gigayear) changes in their physical morphology due to encounters with other cluster members. Among processes that predict rapid spiral to S0 evolution are “galaxy harassment”, the smoothing of galaxy appearances and stripping of matter from multiple tidal encounters with other cluster members (Moore, Katz, & Lake, 1996; Moore et al., 1996; Moore, Lake, & Katz, 1998; Moore et al., 1999), and unequal-mass spiral mergers (Bekki, 2001; Cretton et al., 2001). Other processes, such as “passive” spiral formation from halo gas stripping and subsequent “starvation”, predict a much more gradual transition ( gigayears) into S0s (Bekki, Couch, & Shioya, 2002). Presently, it is unclear whether color and physical morphology evolution occur simultaneously, or if they are decoupled (Poggianti et al., 1999; Couch et al., 2001; Kodama & Smail, 2001).
Typical Abell clusters have measured velocity dispersions of km s-1 (e.g. De Propris et al., 2002), which correspond to roughly 1 Mpc per gigayear. At this rate, recent arrivals would take several gigayears to make their way from the cluster outskirts to the inner regions and, given the timescales for the various proposed mechanisms, much of the predicted rapid evolution would have already transpired. Furthermore, the extreme environments within the inner half megaparsec of clusters will destroy or seriously truncate disk galaxies (Moore, Lake, & Katz, 1998), hence looking for recent arrivals and evidence of transformation towards the centers of clusters is not profitable. Unfortunately, until quite recently CCD imagers were limited to small fields of view so that it was quite difficult to image large angular regions of the sky. Thus, the bulk of cluster imaging work in the nearby Universe ( km s-1) has concentrated on galaxies belonging to the core. For example, at the distance to the well-studied Coma cluster, 2 Mpc in diameter is projected across two degrees of arc on the sky. Terlevich, Caldwell, & Bower (2001) used overlapping CCD frames to study a square-degree region of Coma that still only provided a view of the inner Mpc. They found no evidence for a population of recent arrivals in mid-transformation. Yet, observations of more distant () clusters have yielded cluster S0s with blue colors – possible mid-evolution examples of transforming blue spirals into red S0s (van Dokkum et al., 1998; Rakos et al., 2000; Smail et al., 2001).
Therefore, our observing campaign has taken advantage of recent wide-field imaging capabilities and large redshift surveys to explore galaxies at outer ( Mpc) regions in three local Abell clusters: A85 (), A496 () and A754 (). Most cluster studies rely upon statistical corrections to remove foreground and background galaxy contaminates; therefore, cluster membership using such corrections becomes more uncertain at larger cluster radii. Using the large cluster galaxy redshift survey of Christlein & Zabludoff (2003), we have limited our study to only galaxies confirmed as members with spectroscopic redshifts within of the mean cluster redshift.
To test the transformation scenario we look for structural differences between blue galaxies residing in cluster and field environments through a detailed analysis of their -band structural properties from two-dimensional bulge/disk (B/D) decompositions using GIM2D (Simard et al., 2002). We assume that infalling galaxies suffer SF truncation and evolve rapidly in color and luminosity; hence, relative blueness gives us an estimate of cluster accretion time and “membership age”. In Paper 2 we performed a detailed color-magnitude relation (CMR) analysis for 637 galaxies belonging to the three clusters in our sample. The bluer members reside preferentially in the cluster outskirts (typically Mpc) and have kinematics suggesting a non-virialized, infalling population (Diaferio et al., 2001). For this study we select the 143 members with and colors more than bluer than their cluster CMR, where is the measured CMR scatter ( mag) in color (Paper 2). For comparison, we select 78 galaxies with similar colors and luminosities from the Nearby Field Galaxy Survey (NFGS) of Jansen et al. (2000). We degrade and resample the field members to measure their properties as if they were observed at .
In the transformation scenario we expect that the most recent cluster arrivals will have bluish colors from recent (within gigayears) SF, disk-like morphologies reflective of an infalling spiral population, and smoother appearances sometime after SF cessation. In Paper 2 we find most blue members in these clusters are classified visually as disk-dominated systems with weak spiral features. SF and morphology evolution may be decoupled in cluster galaxies (e.g. Couch et al., 2001), and whether or not the newest (blue) members already exhibit morphological smoothing provides a key motivation for this work. Furthermore, processes like galaxy harassment will reduce the relative disk substructure and size (Moore, Lake, & Katz, 1998), and a variety of mechanisms predict centralized starbursts. In our third paper (hereafter Paper 3, D. H. McIntosh, H.-W. Rix, & N. Caldwell, in preparation) we establish and -band structural differences between three color-magnitude (C-M) selected cluster populations. The bluer membership found typically at large cluster-centric distances consists of predominantly disky systems with uniformly blue to blue centered profiles, lending additional credence to their recent infall origin. Of interest, we notice that the blue members have little excess substructure relative to the redder, presumably older members with smooth morphologies. By looking for structural differences between cluster and field blue galaxies, we can determine whether recent cluster arrivals have undergone transformation compared to their presumed progenitors, star-forming galaxies believed to be the infall source in an hierarchical cosmology. Here we concentrate our effort on -band properties given the higher signal-to-noise (S/N) and better seeing characteristics of our cluster imaging in this passband.
In this paper we present evidence for environment-driven galaxy transformation through a detailed comparison of cluster members and field galaxies with similar luminosities and blue colors. We briefly summarize the cluster and field blue galaxy sample selections in §2. In §3 we describe our two-dimensional B/D decompositions to measure quantitative morphologies in both the cluster and field samples. We include a detailed study of the limitations of this method to yield useful morphological measurements from the cluster and field data. In §4 we analyze detailed comparisons for the observed properties of cluster members against field counterparts selected in the same manner. We discuss our results in light of morphological transformation processes in §5. And we give our conclusions in §6. Throughout this paper we use km s-1 Mpc, and we assume a -CDM (cold dark matter), and , flat () cosmology.
2 Galaxy Data
2.1 Cluster Sample
The cluster galaxy data come from wide-field (one square degree) and (Johnson system) imaging of three local Abell clusters (A85, A496, and A754) using the NOAO Mosaic Image on the Kitt Peak National Observatory (KPNO) 0.9-meter Telescope. Complete details of the sample selection, observations, data reduction, photometric calibration, and cluster membership catalog construction are reported in Paper 2. The clusters were selected primarily due to the availability of a large spectroscopic redshift database (Christlein & Zabludoff, 2003) providing memberships in excess of 100 galaxies per cluster. The final sample contains a total of 637 spectroscopically confirmed cluster member galaxies over a large range of absolute magnitudes (). In Paper 2 we provide a detailed assessment of the completeness of our cluster membership selection (see Paper 2, Fig. 2). Specifically, at we have -band photometry for 95% (727/765) of our -band extended source detections, and we find that 85% (615/727) of these have redshifts. For each cluster, we give membership information in Table 1.
The full details of our galaxy photometry and CMR analysis are published in Paper 2. Briefly, we used maximum-likelihood fits to each CMR to measure relative cluster galaxy color. Compared to the population of old early-types that define the mean CMR, galaxies with bluer integrated colors than expected for a given luminosity are interpreted as having younger luminosity-weighted mean ages (van Dokkum et al., 1998; Terlevich et al., 1999). Given that clusters form hierarchically through the accretion of star-forming, field galaxies which then have their star production shut down once they become associated with the parent cluster, it follows that more recent arrivals would contain a younger stellar population and hence, have bluer colors (Kodama & Bower, 2001; Bicker et al., 2002). Therefore, the SF history (colors) of cluster galaxies appears to depend on their time since arrival (Balogh, Navarro, & Morris, 2000).
Based on the assumption that the color difference between the mean CMR and a galaxy provides a rough division of arrival timescales, we separated the cluster galaxies into three color-based populations to identify newer cluster members (see Paper 2 for details):
-
1.
Red sequence galaxies (RSGs) with colors redward of .
-
2.
Intermediately blue galaxies (IBGs) with mag.
-
3.
Very blue galaxies (VBGs) with mag.
The VBG cutoff corresponds to the Butcher & Oemler (1984) criteria of mag, and represents spiral-like integrated colors. We defined a second, somewhat blue population (IBGs) with the aim of locating galaxies belonging to clusters for an intermediate time between the recently arrived VBGs and the majority population of long resident red galaxies. We selected as the dividing line between the red cluster galaxies and the IBGs because it provides a good match to the blue envelope of the RSGs and it is roughly midway between the default CMR and the Butcher & Oemler (1984) criteria. In Paper 2 we established that the blue (IBGVBG) members make up of each cluster population more luminous than .111We assume for red-sequence galaxies from (Binney & Merrifield, 1998) and a mean E/S0 galaxy color of mag (Fukugita, Shimasaku, & Ichikawa, 1995). Moreover, we found that the spatial and kinematic properties of blue cluster galaxies, taken together, are distinct from RSGs confirming the late arrival nature of the blue members.
We give the number of blue members in each cluster in Table 1. To look for evidence of transformation in more recent cluster arrivals, we focus in this paper on the observed properties of the blue cluster populations in relation to field galaxies selected with similar colors and luminosity. For this reason we limit the cluster IBG and VBG samples to galaxies brighter than to match the field sample selection (next section). This selection results in 143 blue members, the “cluster sample”, which we use throughout this paper. We discuss the structural properties of RSG members in Paper 3.
2.2 Field Sample
To construct a useful field galaxy comparison sample we select galaxies from the Nearby Field Galaxy Survey (NFGS) of Jansen et al. (2000). The NFGS was selected from the first CfA redshift catalog of Huchra (1983). The actual Johnson -band and Cousins -band CCD images for 195 of 198 NFGS galaxies were made available by Rolf Jansen. The NFGS provides a representative sample of local ( have km s-1, with a median of 3000 km s-1), field galaxies spanning the full range of morphological types along the Hubble sequence. With similar luminosities and rest-frame colors as our cluster galaxy data, this sample makes an ideal data base for comparing galaxies residing in different environments. We point out that Jansen et al. consider “field” to cover a wide range of environments with no specific local density criteria, except for purposefully leaving out Virgo cluster galaxies. Although the NFGS is not a purely low density sample, we are satisfied that it represents non-cluster galaxies.
Prior to applying a C-M cut, we discard all 27 NFGS galaxies with irregular or peculiar morphological classification (T-type, Jansen et al., 2000). Irregular/peculiar surface brightness profiles often have multiple flux peaks and no clearly defined center resulting in poor or failed profile fits. We will compare cluster and field member structural properties derived from two-dimensional surface photometry fitting using GIM2D (described in §3). In Paper 3 we found that the majority of cluster members were reasonably well fit by a combined bulge and disk profile because these galaxies have “normal” (not irregular) light distributions. Although the removal of irregulars could skew the overall field sample structural morphology distribution towards lower values, we will show that a strong difference in the amount of residual substructure observed in cluster and field systems remains.
An additional 30 NFGS galaxies are left out due to foreground stars that are superimposed on or near the galaxy’s disk. Line-of-sight foreground stellar contamination is difficult to model and, if not properly accounted for, will result in poor profile fits using GIM2D. We remove 14 field galaxies with Local Group standard of rest velocities km s-1. To make objective comparisons to our cluster data, we must artificially redshift and reobserve each field galaxy image to simulate its appearance at the distance to our clusters. The few NFGS objects closer than this velocity criteria are too poorly sampled following this procedure and, thus, are of no use in our comparative analysis. Finally, we leave out 3 NFGS galaxies with irregular or Seyfert nuclei which will be difficult to model, and 3 with mag corresponding to the faintest cluster galaxies. We note that 14 of the 27 irregular/peculiar (T) galaxies cut from the field sample have mag.
Our selection leaves 117 field galaxies split into 35 early-types (, E-S0/a) and 82 late Hubble types (, Sa-Sdm), based on qualitative classifications given in Jansen et al. (2000). We make no additional morphological cuts because our C-M criteria for blue galaxies does not necessarily exclude early-types such as E/S0s. We plot the T-type distribution for our field galaxy selection compared to the total NFGS distribution in the top panel of Figure 1. For early and late types our selection provides a similar distribution as the total NFGS over ; i.e., a simple K-S test finds a probability of 49.4% that the two distributions are different over this range of T-types.
Next, we apply our C-M criteria to select a blue field galaxy sample. One drawback to using the Jansen et al. (2000) sample to compare to our cluster data is that it has been imaged in ; therefore, it is necessary to transform from to colors. First, using the redshift of each galaxy, we convert the Jansen et al. (2000) -band apparent magnitude to an absolute magnitude using the k-correction from Poggianti (1997) and a cosmological distance modulus (Hogg, 2000), assuming , , and . The given apparent magnitudes were corrected for Galactic extinction using the Burstein & Heiles (1982) H I maps. Next we estimate the of each field galaxy using the following color relation:
| (1) |
where the effective colors (measured within elliptical half-light radii) are given in Jansen et al. (2000). This color relation is based on Bruzual and Charlot single burst models over a full range of age and metallicities, and is consistent with the mean integrated colors of all spirals in de Jong (1996c). This color translation has an estimated uncertainty of mag. Last the field sample colors are estimated from provided in the NFGS. We show the estimated C-M diagram for the field sample of 117 galaxies in the bottom panel of Figure 1. With the IBG and VBG population divisions defined using the mean CMR of A754, we select the final subset of 78 blue galaxies – the “field sample”. These galaxies span an absolute magnitude range of and a redshift range of . The field sample has an excess of bright () galaxies and a deficit of fainter systems relative to the cluster sample. In §4.4.3 we show that the difference between bright cluster and field VBG distributions is representative of these two environments, while the deficiency of faint blue field galaxies is partially due to our culling of irregular galaxies. Our findings are not affected by the difference in numbers of faint blue galaxies.
We want to look for differences in amounts of residual substructure, left over after the best GIM2D fits to our -band cluster images and to the field sample images. In spiral galaxies the strength of residual and asymmetric features (spiral arms, H II knots, etc.) is wavelength dependent because such features are predominantly due to recent and localized SF, which is more prominent in blue light. If recent cluster arrivals (bluer members) are being transformed, we expect to measure significantly less substructure in these galaxies, relative to field counterparts of similar color and luminosity. To compensate for the lack of -band NFGS imaging, we will estimate field galaxy parameters by averaging the results from fits to the and the passband data straddling the -band. We opt to concentrate our analysis on -band properties, rather than , owing to the improved S/N and seeing characteristics of our cluster imaging in this passband.

3 Two-dimensional BulgeDisk Decompositions
For our analysis we use GIM2D (Galaxy IMage 2D)222Available at http://www.hia.nrc.ca/STAFF/lsd/gim2d/ v2.2.1 to perform multi-component model fits to the two-dimensional (2D) surface brightness distribution of each galaxy in the cluster and field samples. Hereafter we will refer to the 2D galaxy profile fitting and parameterization as bulge/disk (B/D) decomposition. A full description of GIM2D is given in Simard et al. (2002). We select GIM2D for the following reasons: (i) it accounts for the effects of seeing by convolving the best-fit model with an input point-spread-function (PSF); (ii) it provides a variety of model profiles including the traditional de Vaucouleurs (1948) bulge, plus exponential disk; and (iii) it is well-tested as evident in a growing body of published galaxy structure work using GIM2D (e.g. Simard et al., 1999; Im et al., 2001, 2002; Tran et al., 2001; Balogh et al., 2002a, b; Simard et al., 2002). Furthermore, a true 2D fitting routine is advantageous over traditional one-dimensional methods because it quantifies non-axisymmetric information contained in galaxy images, such as residual flux from spiral arms (de Jong, 1996a).
3.1 Structure and Morphology Measurements
We have used GIM2D to fit an bulge and an exponential disk to the surface brightness profiles of our sample of 637 known members from imaging of clusters A85, A496, and A754. For this analysis we concentrate on the GIM2D fitting to our -band imaging. Our B/D decomposition procedure and a detailed analysis of the internal structure of red and blue cluster members are given in Paper 3. Briefly, GIM2D fits each sky-subtracted galaxy (“postage stamp”) image with a PSF-convolved model. We use daophot to construct a variable, high S/N PSF model for each cluster using hundreds of bright but unsaturated stars from its -band mosaic image. This model reproduces the PSF “shape” for each galaxy. Through detailed testing we find that this PSF is sufficient for this galaxy fitting (see Paper 3). During fitting GIM2D holds the background to a constant zero value. Here we add B/D decompositions of the 78 blue galaxies selected from the NFGS. As stated in §2.2, we estimate galaxy properties in the -band from fits to the and passband images. For the field sample we employ the same fitting procedure as for our cluster imaging, with one exception – for each NFGS galaxy image we use a 2D Gaussian matched to the seeing size for PSF convolution. The seeing FWHM is given in the image header of each NFGS image and represents an average of several nearby stars. Many of the NFGS images lack stars of sufficient S/N and sampling to construct a useful PSF; therefore, we elect to always use a Gaussian for consistency. We compare galaxy parameters derived from fits to NFGS images using Gaussian PSFs and neighboring bright stars (when they are available), and we find little () difference.
For each galaxy, GIM2D produces model and residual (model-subtracted) images (see Figure 2), along with a set of basic structural parameters, including their internal confidence limits. Measurements of internal structure include size estimates such as the bulge effective radius , disk scale length , overall profile half-light radius ; bulge ellipticity ; disk inclination ; and the position angles of each component (, ). The internal errors for size measurements are typically quite small with a mean of for the cluster galaxy fits. In addition, GIM2D provides quantitative and repeatable morphological classification of cluster members through the bulge-to-total ratio and residual flux measures (asymmetric and total) of galaxy substructure . This two-parameter set lends itself to our search for signs of recent evolution in cluster galaxies. provides a measure of morphology (e.g. is the galaxy spheroidal or disk-like). gives a measure of how much, or how little, substructure (e.g. spiral features) is present within a galaxy. Our B/D decompositions have two limitations: (i) we assume a constant bulge model profile; and (ii) we have no bar component. We discuss these limitations in detail in Paper 3.
We use the quantitative morphology measurements ( and ) to explore possible differences between cluster and field galaxies with similar photometric properties. The use of quantitative morphological classification is advantageous over visual (qualitative) classification because it is reproducible and it is objective. Im et al. (2002) show that the GIM2D and parameters are successful at selecting E/S0s, without substantial contamination from later-type galaxies, from a sample of local field galaxies. measures how centrally concentrated the galaxy surface brightness profile is by quantifying the relative contributions of the bulge and disk model components to fitting the overall galaxian light profile. The residual substructure parameter measures how discrepant a galaxy’s surface brightness is from the simple bulgedisk (BD) model. Thus, E/S0s will typically have larger measurements and near zero, whereas spirals should have low bulge light fractions and greater measurable substructure.
Following Im et al. (2002), we quantify the substructure contained within and define it as
| (2) |
From Simard et al. (2002) we have
| (3) |
and
| (4) |
is the residual image flux at pixel () and is the () pixel flux in the residual image rotated by 180 degrees. Similar flux measures for the background noise, and , are calculated over an area comparable in size to the model and drawn randomly from the full set of all background pixels in each postage stamp image. is the galaxy image flux at pixel (). Morphological features such as spiral arms, bars, H II regions, active nuclei or dust lanes produce measurable residuals, hence, provides a measure of the total substructure (deviations from a smooth model profile) in a galaxy. Note that is not a measure of the total residual flux. represents the total summed positive and negative residuals, while quantifies the absolute value of the asymmetric residuals (e.g. asymmetric spiral arms or H II regions). Therefore, a galaxy that exhibits symmetric positive and negative residuals of equal flux would result in an specifying correctly its inherent substructure.
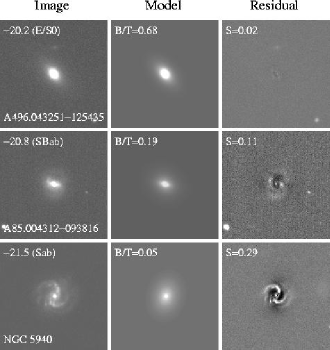
To illustrate GIM2D’s ability to quantify morphologies, we show images of three example galaxies, along with their corresponding best-fit models and residual frames in Figure 2. The galaxies span a range of and measurements. For each galaxy we include the rest-frame , qualitative morphology, , , and identification. Two galaxies are -band images from our cluster data, the third (NGC 5940, ) is -band data from the NFGS. GIM2D does an excellent job reproducing the general appearance of each galaxy’s bulge and disk as depicted by the 2D model images. Moreover, the amplitude of residuals as measured by provide a reasonable method for quantifying the amount of substructure observed, from little residual flux ( for an E/S0 fit) to large values due to strong spiral features.
In Figure 3 we plot the mean quantitative morphologies from our fits to the and -band field galaxy images as a function of qualitative (“by eye”) classifications given in Jansen et al. (2000). The bottom panel shows a trend between and T-type in the sense that early-type galaxies are bulge-dominated while the fraction of bulge light diminishes to for late-type spirals. This rough correlation has been documented in other studies (de Jong, 1996b; D’Onofrio, 2001; Graham, 2001)333In these studies the authors use the bulge-to-disk luminosity ratio which is directly related to the bulge fraction by .; however, this trend has large scatter and does not provide a good indicator of Hubble type (de Jong, 1996b; Lilly et al., 1998; Im et al., 2001, 2002). We find an -T correlation (top panel) with similarly large scatter. Recall that is a measure of total deviations from a smooth model profile and, hence, quantifies the amount of substructure due to a variety of processes. In disk galaxies () the dominate source of substructure is spiral features which represent SF process, thus, the -T correlation follows the SFR dependence on Hubble type (Kennicutt, 1994, 1998; James et al., 2003).
In Figure 4 we show the cluster and field samples plotted in the quantitative morphology plane. The cluster results are from GIM2D fits to the higher S/N -band data for the complete cluster membership (including RSGs) from Paper 3. The mean uncertainties in depend somewhat on the value of this parameter: (), (), and (). GIM2D does not estimate an internal confidence interval for the residuals and , thus, we estimate an average error of in our measurement from multiple fits to a subset of galaxies. The region of - space occupied by E/S0 types in Im et al. (2002) is shown for both samples. Im et al. (2002) showed that and provide a good method for discriminating E/S0s from other morphological types in lower S/N data. We note a handful of cluster galaxies exist in Figure 4. Such measurements result from larger background values relative to the flux residuals (see equations 3 & 4). In our subsequent analysis we consider these galaxies to be morphologically smooth and fix their total substructure to . Finally, there is significantly more observed substructure in the field galaxies than the cluster members. Nearly all disk-dominated () cluster galaxies have , in stark contrast to the disky later types in the field. This finding is consistent with the low spiral fractions () found in local, rich clusters (e.g. Oemler, 1974; Butcher & Oemler, 1978b). Yet, the difference we observe may be merely due to the different observational characteristics of these two samples. This gross comparison underlines the necessity to test what effect our observations play on the differences in observed substructure.


3.2 Limitations of Morphologies Derived From the Cluster Data
It is important to understand the effects that observational resolution and S/N have on quantitative morphology measurements, especially those that rely on residual fluxes from a smooth best-fit model profile. The telescope aperture, pixel scale, seeing, and object distance all determine the effective resolution and minimum surface brightness detection limit for a set of galaxy observations. Therefore, faint features such as spiral arms in a flocculent disk galaxy may be measurable locally, yet not seen in a similar galaxy at a somewhat larger distance when using the same telescope and detector system under the same observing conditions. The strong difference in values derived from our field and cluster galaxy fitting (see Figure 4) may be simply because cluster members are observed through a smaller (1-meter) telescope, and at distances twice as far on average as the field sample. Therefore, we must quantify the limitations of our quantitative morphology measurements to establish the significance of any evidence for recent evolution among cluster members. To this end, we artificially place the local field sample galaxies at a redshift corresponding to our most distant cluster (A85, km s-1), simulate reobservation through our 0.9-meter/Mosaic configuration, and repeat our B/D decompositions on the re-imaged data. Artificially redshifting and reobserving galaxy data is a straightforward procedure outlined by various authors (e.g. Tran et al., 2001); however, to produce our artificially redshifted field images requires an extra level of complexity because we are simulating reobservation through a different telescope/detector configuration than originally used. We describe our method in Appendix A.
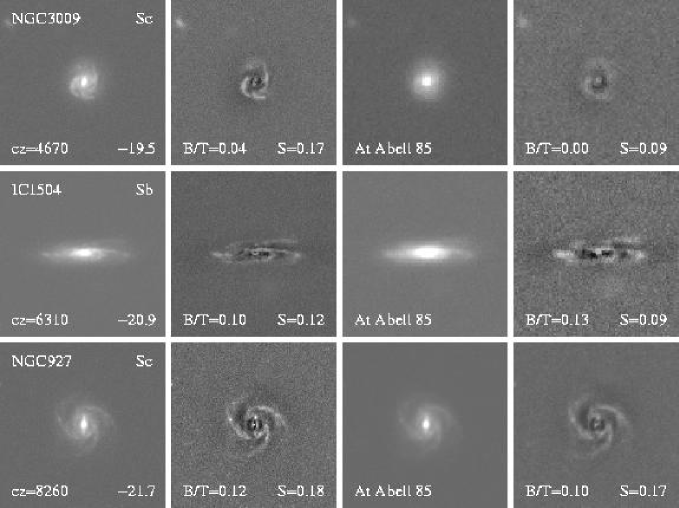
We determine the limitations on the parameters and for distinguishing morphological information in our cluster observations by comparing these morphology measurements from B/D decompositions for field galaxies in their observed frame and artificially placed at distances corresponding to cluster A85. At this distance we are illustrating the maximum degradation in the and measurements from our cluster data. The effect that our redshifting and reobserving simulations have on the measured quantitative morphologies for three spirals from our field galaxy sample are shown in Figure 5. For each field spiral we show its original NFGS observed-frame image, the corresponding GIM2D residual flux image, its re-imaged appearance through our 0.9-meter/Mosaic -band system at the distance of A85, and the GIM2D model subtracted residual for the artificially redshifted image. Not surprising, the features of galaxies reobserved at further distances are washed out compared to their original image counterparts. In these three cases, is more strongly affected (reduced) by our simulations than , and the difference between original and reobserved morphology measurements appears most dependent on object luminosity, at a given distance. We note that in all three cases, the spiral substructure, after artificially redshifting to the distance of A85 and reobserving through our 0.9-meter/Mosaic system, is still conspicuous (). Therefore, while it is true that our cluster observations are somewhat limited for quantifying the full extent of potential substructure in spiral galaxies, the differences in the distribution of between disk galaxies in the field and in the cluster (see Figure 4) are not entirely due to the limitations of our observations.
To establish a brightness limit for achieving reliable measures of and , we study the luminosity dependence at a given distance of how quantitative morphologies measured from original field galaxy images using GIM2D are diminished after redshifting and reobservation.
3.2.1 Reliable Measurements
Here we quantify how well our observations can detect the existence of spiral substructure in galaxies at the distance to cluster A85. First we compare distributions of measured from blue-selected (IBGVBG) field galaxies in observed and redshifted frames, subdivided into four bins of roughly equal numbers (see Figure 6, top). Recall that each galaxy value is the average from GIM2D fits to and -band data. For the field IBG and VBG galaxies brighter than , the distributions from fits to the original data appear qualitatively similar from one brightness bin to the next – a broad distribution spanning with mean . A comparison to the re-imaged distributions shows an abrupt change for such that fainter galaxies moved to A85 appear to have much less observed substructure () than seen in the original observations. A K-S test finds the rest and redshifted distributions are different in the two faintest bins.
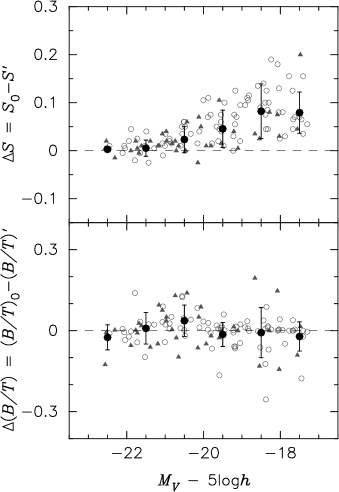
In addition, we calculate the difference between substructure measures from fits to the original () and artificially redshifted () images; this difference represents how much spiral morphology information is “lost” when reobserving galaxies with known morphological features at a greater distance. We plot for each field galaxy in our sample against in the top panel of Figure 7. We calculate the average change in substructure per magnitude bin for only the IBGVBG galaxies over the full range of field galaxy luminosities. There is a clear luminosity dependence on , such that increases in amplitude and spread for intrinsically fainter galaxies. Nevertheless, does not deviate from zero by more than 0.05 until the bin, corresponding to the same brightness where we see gross differences in the overall distributions of original and redshifted images (Figure 6).
With this analysis we demonstrate that observing a galaxy at a further distance reduces its S/N and increases the physical size each pixel samples (pixel smoothing) – i.e. spiral galaxies with intrinsic substructure appear smoother. These effects lead to an underestimated measure of from GIM2D fitting. If we assume that the brightness of features, such as spiral arms or H II regions, correlates with a galaxy’s overall luminosity, then we may determine the average luminosity at a given distance at which this effective smoothing inhibits our ability to quantify the existence, and absence, of substructure in galaxies from our cluster -band observations. Provided this assumption holds and based on our above analysis, we select to be the brightness limit for measuring reliable substructure in our cluster sample. In Figure 3 we distinguish field galaxies brighter and fainter than this limit using separate symbols; however, considering only reliable quantitative morphology measures does not reduce the large scatter found between and Hubble type.
3.2.2 Reliable Measurements
Following our analysis of the luminosity dependence of at a given distance, we construct similar plots for average ( and image) . First, we subdivide the distributions into the same four bins as with (see bottom portion of Figure 6). For the bulge light fraction parameter we consider all galaxies within the field sample including those with red colors. The original and re-imaged distributions appear quite similar in all brightness bins. Again we apply a K-S test to compare the rest and shifted distributions in each luminosity bin and find they are statistically similar with low probabilities () of not being drawn from the same parent sample.
In Figure 7 (bottom) we plot versus for all field sample galaxies. Although there is increasing scatter in towards fainter magnitudes, the majority of objects show little change between measurements from original and redshifted images.
Therefore, we conclude that bulge morphology measurements derived from our -band cluster observations are reliable for galaxies spanning the full range of bulge fraction and total luminosity . We note that is less affected than because the effects of pixel binning are incorporated in GIM2D (Im et al., 2002), and galaxy bulge light is typically well sampled (i.e. has much higher S/N than disk).

3.3 Estimated Color Profiles
Our B/D decompositions provide a useful estimate of the internal color gradient of each galaxy. In Paper 3 we established that the ratio of intrinsic half-light radii measured from GIM2D fits to and -band images provides a reasonable color gradient estimate () for each cluster member. Briefly, red color gradients () produce more peaked -band profiles () and thus a redder central region, while galaxies with profiles that become bluer towards the center will have . If a galaxy has identical sizes in each passband (), then we infer that the color distribution across the galaxy is uniform (i.e. no color gradient). The average error in our color gradient estimates is .
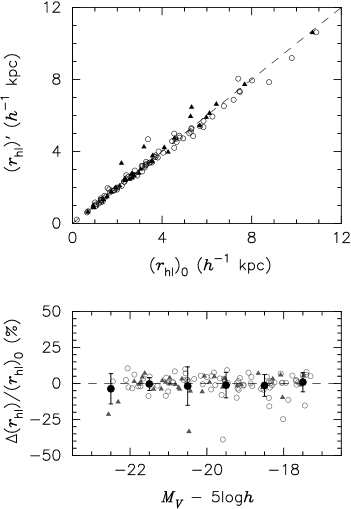
depends directly on our measurement of galaxy size which may be affected by observational resolution and light gathering power. Therefore, we compare the physical sizes measured from original and artificially redshifted field galaxy images during our tests of and reliability. At a redshift , the physical size is given by the product of angular size and distance . As shown in Figure 8, the average sizes from field galaxy B/D decompositions of original and redshifted () and -band imaging are in excellent agreement over the full luminosity range of our cluster sample at the distance of cluster A85. We note that the three galaxies in the bottom panel of Figure 8 with percent differences in excess of have poor sky determination due to proximity to very bright foreground stars.
In Paper 3 we found that more than of blue cluster members either lack a significant color gradient or have bluer centers relative to their outer regions. The color profiles of the blue galaxies were in stark contrast to the red members which had red gradients in qualitative agreement with those seen in early-types (Peletier et al., 1990).
Red color gradients appear to be a common property of spirals, and they are due to a combination of age and metallicity effects resulting in the outer disks having younger ages and lower metallicity measurements (de Jong, 1996c). Spectroscopic studies have shown that local clusters contain a fair fraction of galaxies that had a recent episode of enhanced SF (Couch & Sharples, 1987; Barger et al., 1996), or even a starburst (Caldwell & Rose, 1998; Poggianti et al., 1999). Furthermore, Bartholomew et al. (2001) have found that strong Balmer absorption (so-called “KA” galaxies) cluster members at have bluer color gradients indicating their recent SF activity. If galaxies entering the dense cluster environment have SF truncation proceeded by a starburst, especially a centrally located burst (as seen in Rose et al., 2001), their color profiles may be quite different compared to those of normal field spirals. Thus, we will compare the blue cluster galaxy results to similar measures from their field counterparts to look for differences in centrally concentrated SF histories.
4 Cluster-Field Comparison
We have analyzed 143 cluster and 78 field galaxies in a consistent manner to make direct comparisons between blue galaxy populations with similar luminosities () that reside in two distinctly different environments seen in the local Universe. Specifically, we have performed B/D decompositions on images of cluster and field blue-selected (IBG and VBG) galaxies. Recall that VBGs have spiral-like colors mag bluer than the well-defined CMR, while IBGs are intermediately blue in color between the VBG cut and red sequence galaxies within of the CMR. We have artificially redshifted and reobserved the field galaxy data and all A496 () galaxies prior to fitting to assure that we compare the structural properties of cluster and field galaxies derived from similar S/N and resolution quality data – i.e. at a common distance corresponding to that of A85 and A754 (). In the transformation scenario the field population represents the source of recent arrivals; therefore, to look for signs of evolution among recent cluster arrivals we need to make comparisons with their field counterparts. In this section we compare measures of bulge light fraction, observed morphological substructure, estimated color profile gradient, physical size, and luminosity to quantify whether differences exist between matched blue galaxy populations in the cluster and field environments.
4.1 Bulge-to-Total Light Morphology
Typical values for ellipticals and spheroids are (e.g. Im et al., 2001, 2002), while later-type disk-dominated galaxies usually have (e.g. Lilly et al., 1998; Im et al., 2002). This coarse separation at into early and late morphologies is illustrated in Figure 3 using a representative field galaxy sample spanning the full range of Hubble types (E-Sd). In Paper 3, we showed that of red cluster galaxies have , while of blue members are . We stress that we are not making qualitative morphology comparisons and we have not visually classified the cluster members using any standard system. We will simply make cluster-field comparisons using this quantifiable and repeatable measure of the fraction of light matched by the best-fit model bulge component.
In Figure 9 we plot the -band distributions for the IBG and VBG populations from the cluster and field environment. The local field results are derived from and -band images artificially reobserved at the distance of cluster A85. All cluster measurements are based on imaging at the same distance. The cluster and field VBGs shown in the bottom panel have typically low () bulge fractions, with the majority peaked at . A K-S test for the cluster versus field VBGs shows no significant difference between the relative fraction of disk light in very blue galaxies residing in these two disparate environments. We find a similar result when comparing the distributions for cluster and field IBGs. The IBG galaxies (top panel) are disk-dominated although they have a much flatter low () distribution than VBGs. The cluster IBG and VBG distributions are different at confidence, while a similar comparison between the field sample blue populations shows a moderate difference. We provide details of the K-S tests in Table 2. If we assume that relative color correlates with cluster arrival time, then the difference between the IBG and VBG populations may be evidence for processes within the dense cluster that reduce the disk light profile. We discuss the physical mechanisms that might produce evolution from disk-dominated to bulge-dominated systems in §5.1.

4.2 Structural Morphology
Im et al. (2002) have shown that residual substructure values can be used in conjunction with bulge-dominated measures to successfully select E/S0 galaxies from a sample of local field galaxies, without substantial contamination from later-types. In Figure 3 we note the the majority of E/S0 galaxies from our field sample do indeed have , and conversely most spirals (Sa-Sd) show . Naturally, the degree of SF activity correlates at some level with the observable amount of spiral substructure.
In Figure 10 we present the field and cluster -band distributions for IBGs and VBGs brighter than . In § 3.2.1 we used the local field sample to find that we can reliably measure for galaxies brighter than this absolute magnitude limit at the distance of cluster A85 (). Recall that all measurements are from images degraded to the same effective resolution, and the local field sample results are from the averaged and -band NFGS data. Recall that we have removed 27 irregular/peculiar galaxies from our field comparison sample. None of these galaxies are brighter than the reliability magnitude limit, thus, their removal does not affect our results.
As shown in Table 2, the cluster VBG and IBG substructure morphology distributions given in Figure 10 are not statistically different from each other. Using to denote galaxies with significant residual substructure, most blue cluster galaxies with exhibit little substructure. Roughly of VBGs and of IBGs have , which is contrary to expectations given the high fraction of disk-dominated () systems seen in the previous section. In the field environment, we expect blue disk galaxies to have significant substructure associated with spiral arms and late Hubble types (see Figure 3). Indeed, in Figure 10 we see that of field VBGs have , in stark contrast to the clusters. While the cluster and field VBG populations have similar relative fractions of disks, there is a striking difference (at confidence) in their residual substructure properties. Even after diminishing the observable spiral substructure by re-imaging blue field galaxies at a distance given by , they show much stronger deviations from a smooth light profile compared to cluster members with the same effective resolution, color, luminosity, and morphologies. The cluster and field IBGs brighter than are somewhat different in their substructure distributions.
On average, the cluster VBGs appear smoother, i.e. have less substructure (e.g. spiral arms, H II regions, bars, SF knots and dust lanes) than field VBGs. As discussed by van den Bergh (1976), these so-called “anemic” spirals have morphological characteristics intermediate between S0s and normal spirals. While the quite blue colors of these galaxies from different environments suggest similar relative fractions of young stellar populations, the strong differences in residual substructure suggest different current SF properties. Similarly, Balogh et al. (1998) found a lower mean O II equivalent width in disk-dominated galaxies near the cluster virial radius compared to the field. In addition, many disk-dominated galaxies in X-ray weak clusters have smooth morphologies and lack emission lines (Balogh et al., 2002b), which shows a direct connection between the absence of spiral features and ongoing SF. Galaxies in poor groups also exhibit less asymmetric substructure than their field counterparts (Tran et al., 2001). This analysis provides evidence for morphological smoothing, presumably related to SF activity. It is not clear whether the smoothing takes place in groups or subclusters prior to reaching the cluster, upon entry to the cluster, or sometime thereafter. We contemplate the possible origins of structural morphology transformation of the infalling disk galaxy population in the discussion section.

4.3 Estimated Color Gradients
In Paper 3 we showed that represents a reasonable estimate of a galaxy’s profile color gradient using GIM2D half-light radii from fits to red and blue passband images. We found that most blue cluster galaxies, especially VBG types, lacked the significant red color gradient exhibited by the bulk of the red members. Our focus here is to determine whether blue galaxies in the field and clusters show differences in their overall color profiles. For our field galaxy comparison sample we set and use half-light radii derived from the redshifted and -band images. This is a crude measure of color gradient, thus, subtle differences due to different choices of blue and red passband should have little consequence when trying to discern if a galaxy is redder or bluer towards its center.
We plot the distributions for IBGs and VBGs from cluster and field environments in Figure 11. The blue field galaxies have distributions that are redder on average than their counterparts found in clusters. The field results are in qualitative agreement with red color gradients observed in late-types (e.g. de Jong, 1996c). A K-S test shows a significant () difference between the cluster and field VBG distributions (see Table 2) given in the bottom panel. We find the fraction of VBGs with estimated blue color gradients () to be in clusters and only in the field. A similarly strong difference in relative fractions of blue gradient IBGs exists between the cluster () and field () samples (top panel), although the overall cluster and field IBG distributions are not statistically different. This result implies that, unlike normal star-forming field spirals, many of the bluer cluster members are blue throughout or even show blue cores. This appears to be true especially for cluster VBGs.
Color profile differences are presumably evidence for a recent deviation from “normal” SF activity. Overall blue colors may suggest an episode of fairly strong global SF within the past few gigayears, while blue centers imply recent or on-going centrally concentrated SF. For example, these uniformly blue cluster galaxies are consistent with populations of galaxies found in distant () clusters showing enhanced Balmer absorption spectra (Couch & Sharples, 1987; Barger et al., 1996). Additionally, Bartholomew et al. (2001) found that distant cluster galaxies with strong Balmer absorption have blue color gradients, and are presumed to be a post-starburst population (Caldwell & Rose, 1998; Poggianti et al., 1999). Furthermore, Rose et al. (2001) found that currently star-forming galaxies in local clusters often show blue cores and have more centrally concentrated emission lines than field galaxies. As with the structural morphology differences, the color gradient difference we find between very blue cluster and field members provides further evidence that the VBG populations in these two environments have undergone quite different recent star formation histories. We discuss physical processes that may produce blue color gradients in cluster galaxies in the discussion section. We note that recent starburst activity could correlate with increased luminosity in the bluer cluster galaxies; however, we find no preference for brighter IBG and VBG members to have .
Certainly, our finding that many recent cluster arrivals lack typical red color gradients should be investigated further. This result is based on simple global size measurements in different passbands. A formal color gradient analysis of this large cluster galaxy sample will be addressed in a future paper. Additionally, we will include a study of fiber spectra from the central regions ( kpc at cluster A85) of each cluster member.

4.4 Scaling Relations
Galaxy sizes and how they scale with brightness are fundamental observables. Our 2D B/D decompositions of cluster galaxy -band light profiles yield PSF de-convolved, and thus intrinsic, half-light radii and disk scale lengths . In the following comparison, we estimate -band field galaxy sizes using the average radii from GIM2D B/D decompositions of NFGS and -band imaging redshifted to the distance of cluster A85.
4.4.1 Global Scaling Relations
We have established that red and blue cluster members occupy somewhat different regions of luminosity-size () space (Paper 3). Briefly, cluster galaxies with colors redder than VBGs show a broad correlation between absolute magnitude and size, similar to that seen for local ellipticals, while VBG members are concentrated around and kpc. Moreover, cluster VBGs appear to concentrate towards lower mean surface brightness when compared to fiducial values from large field spiral studies (e.g. Burstein et al., 1997). In the previous sections we have observed differences between structural properties of blue galaxies selected from clusters and the field; therefore, it is likely that scaling relations may be affected by environment as well.
First we compare the global relations found in blue selected cluster and field systems. Our analysis shows that these galaxies typically contain significant disk components, therefore, we correct the absolute magnitudes for internal extinction and the global half-light sizes to face-on values. The circular half-light radius is , where is the half-light semi-major axis given by GIM2D, and is the overall inverse galaxy axis ratio that we estimate from the disk inclination () for systems, or from the bulge ellipticity () for galaxies. The internal extinction corrected absolute magnitude is . The amount of internal disk absorption is governed by the factor which varies from one (optically thick) to zero (optically thin). How is computed is highly debated in the literature (see Giovanelli et al., 1994; Tully et al., 1998). For our -band measurements we use which is extrapolated from internal extinction corrections given in Burstein, Willick, & Courteau (1995). Both the cluster and field magnitudes have been corrected for Galactic extinction using Schlegel, Finkbeiner, & Davis (1998) and Burstein & Heiles (1982), respectively. A slight magnitude difference may exist between the two samples because of the different dust corrections used.
For the cluster and field samples split into two blue C-M types, we plot half-light radius against -band absolute magnitude in the top two panels of Figure 12. We see that the cluster and field IBGs follow similar relations between face-on size and inclination-corrected luminosity. For comparison, we delineate the region of parameter space occupied by local spirals corrected for internal absorption (Burstein et al., 1997; Simard et al., 1999), and transformed to -band quantities using average colors of for Sab/Sbc types (Fukugita, Shimasaku, & Ichikawa, 1995). The VBG populations (Fig. 12b) have luminosities and sizes that fall within the region defined by local Sc-Sdm spirals from Burstein et al. (1997); Simard et al. (1999), using . Yet it is clear that, unlike the field, clusters contain very few large ( kpc), bright () VBG members. We are confident in the spectroscopic and photometric completeness of the cluster data at . In §4.4.3 we establish that the bright end of the field VBG luminosity function studied here is fairly representative.

4.4.2 Disk Scaling Relations
Besides the global scaling relations seen in our cluster galaxies, we analyze similar correlations for the disk components of the IBG and VBG populations. Using GIM2D derived disk parameters we compute the internal extinction corrected disk luminosity , and the face-on disk scale length , where is the semi-major axis scale length. We plot the disk component relations for blue galaxies in the bottom two panels of Figure 12.
The disks of blue cluster members occupy the same regions of disk luminosities and scale lengths as their field counterparts. The disk correlations have similar slopes and scatter as their global analogies shown in Figures 12a,b. Cluster IBG disks (panel c) and all blue field galaxy disks (panels c and d) are evenly distributed over the observed correlation from small and faint (0.5 kpc, ) to large and bright (5.0 kpc, ). Yet most of the more recent cluster arrivals (panel d) have disks that are even more tightly concentrated towards small sizes and low luminosities than when shown using global scaling relations (panel b). The paucity of bright (), large ( kpc) disks among the VBG cluster members, compared to field spirals with equally blue colors, is likely related to the difference we measure between the morphological substructure of VBGs in these two environments – i.e. galaxies with small, faint disks will exhibit less substructure.
Up to now we have shown that, in general, cluster and field VBGs spanning a similar range in luminosity have quite different distributions. Here, we test whether the lack of substructure in cluster VBGs contains an environmental component independent of luminosity, or whether the distributions differ solely because of the differences we find between the blue galaxy luminosity functions of our cluster and field samples. In Figure 13 we plot as a function of for cluster and field VBGs. We see that substructure and disk luminosity correlate in VBG populations as expected; nevertheless, the spread along in this relation appears governed by the global environment. Within any disk luminosity bin, the division between low substructure (cluster) and high substructure (field) remains among blue selected galaxies. We illustrate this for two disk luminosity bins in the right panel of Figure 13. We surmise that a physical process such as galaxy harassment (Moore et al., 1996; Moore, Lake, & Katz, 1998; Moore et al., 1999) is responsible for decreasing disk size, luminosity, and substructure in recent cluster arrivals. We note that harassment is most effective on lower mass objects such as the blue cluster galaxies we study here. We discuss galaxy harassment and other possible mechanisms for transforming the appearance of the latest cluster members in §5.1.

4.4.3 Bright End Luminosity Functions of Very Blue Galaxies
In our global and disk scaling relation analyses we notice the bright end () of the cluster and field VBG luminosity functions are quite different. In Figure 12b we find very few bright VBGs in local clusters compared to field spirals with equally blue colors. This luminosity difference appears even more pronounced in Figure 12d when only the disk components are considered. Our finding is interesting if the distributions of bright blue galaxies in the two environments reflect the local Universe.
At the cluster sample is complete spectroscopically, thus, we are confident that the relative number of cluster galaxies brighter than this limit are representative of rich clusters out to roughly a virial radius. To rule out field sample selection biases, we show the luminosity function of our field VBGs in Figure 14. The bold outline shows the overall fraction of galaxies per absolute -band magnitude bin for the full NFGS sample. Jansen et al. (2000) have selected these objects to sample the varying morphological mix as a function of brightness, and to approximate the local galaxy luminosity function of Marzke, Huchra, & Geller (1994). Next we show the distributions for all NFGS galaxies that obey our VBG selection criteria (dash-dot outline), and the subsample of 63 field VBGs that we select (see §2.2) for our analysis (binned histogram). We apply a K-S test to compare the luminosity distributions of the two field VBG samples at the bright end. For (corresponding to ) we find a probability that the subsample of VBGs that we select are different from the total set of Jansen et al. (2000) galaxies in the VBG region of C-M space. Therefore, if the NFGS provides a representative sampling of the local field population, we assume that the bright VBGs in our field sample are fairly representative also.
We plot the luminosity distributions of the cluster and field VBGs in Figure 15. Given the above arguments, we assume that our cluster and field selections of VBGs brighter than are characteristic of their corresponding environments. We see a striking difference in the bright end luminosity functions of very blue selected galaxies in high and low density regions of the local Universe. Specifically, VBGs brighter than are much more abundant in the field than in clusters. We note that if we include the bright VBGs in the NFGS that we exclude in our field sample selection, the observed difference between cluster and field LFs for bright blue galaxies would be even larger. It is well-known that the high luminosity population of rich clusters is largely early-types (red galaxies), while the field is spiral-rich (Oemler, 1974). Previous studies of the environmental dependence of galaxy luminosity functions have shown an overall excess of bright galaxies in clusters relative to the field (Goto et al., 2002). Here we demonstrate that the membership of rich clusters is deficient of bright, blue galaxies in contrast with the field.


5 Results and Discussion
In this paper we have compared blue galaxies residing in clusters, to galaxies of similar color in field environments, through a detailed analysis of their -band structural properties from 2D profile B/D decompositions. Our cluster sample consists of 143 blue galaxies drawn from the combined catalog of spectroscopically confirmed members in local clusters: A85 (), A496 () and A754 (). The field comparison sample of 78 blue galaxies comes from Jansen et al. (2000). Both samples are limited to . We have degraded and resampled the field galaxies and the cluster A496 members to measure their structural properties at a matched effective resolution to clusters A85 and A754 at . We have divided each of the two samples into very blue galaxy (VBG) and intermediately blue galaxy (IBG) populations (see Table 1), based on the relative color difference between the color of each galaxy and the well-defined CMR. Evolutionary synthesis models following the C-M evolution of field galaxies that suffer SF truncation upon entering the overall cluster environment, with or without an initial starburst, confirm that relative blueness tells us something about cluster accretion time and “membership age” (e.g. Bicker et al., 2002). In particular, we are interested in the relative properties of the most recent cluster arrivals (VBGs) and field counterparts of the same color and luminosity – “normal” spirals thought to be the supply of infalling galaxies in an hierarchical framework. The observed difference of cluster galaxies is thought to be driven by the morphological transformation of newer members. In each cluster we find significant fractions () of VBG and IBG galaxies that have spatial and kinematic properties consistent with being a recently arrived population (see Paper 2 for details). Here we discuss the results of our blue galaxy cluster-field comparison in relation to the transformation scenario.
Our findings are summarized as follows:
-
1.
The VBG population in clusters has typically low bulge light fractions (), consistent with disk morphologies. The distribution of cluster VBGs is well matched to that of field spirals, while the cluster IBGs show a broader distribution that is significantly different ( confidence) than the bluer cluster members, with a ratio of 3/4 disk-dominated () to 1/4 bulge-dominated () systems.
-
2.
The distribution of residual substructure morphology differs between cluster and field VBGs at confidence. Even after diminishing the observable spiral substructure in field VBGs by artificially redshifting to the maximum cluster redshift, these GIM2D fitted galaxies have much stronger deviations from a smooth light profile in contrast to cluster members with the same color, luminosity, and morphologies. Even when considering the brightest () VBGs, cluster disks show little evidence of spiral arm substructure associated with current SF. The cluster IBGs show an average lack of substructure similar to the more recent arrival VBG population.
-
3.
From our estimates of color gradient we find that cluster VBGs have color profiles that lack any clear inward reddening (). Half of the recent cluster arrivals are globally blue or even have blue cores (). The IBG cluster population likewise has a fair fraction of blue cores. Moreover, the estimated color profiles seen in cluster VBGs are quite different ( confidence) from those exhibited in normal field spirals.
-
4.
For both the blue cluster and field populations, selected by C-M properties and analyzed in the same manner, the relation for either the total galaxy or just its disk falls in the same range of parameter space defined by field surveys, if we identify IBGs with Sa-Sbc types and VBGs with Sc-Sdm. However, at the bright end of the VBG luminosity functions, where we are confident in the completeness for both cluster and field membership, the cluster population has a striking deficiency of bright () VBGs compared to the field. In contrast to field VBGs, the cluster VBG population tends to concentrate towards having small ( kpc), faint () disks. Furthermore, the VBG disk properties appear linked to the lack of significant morphological substructure seen in these presumed recent cluster arrivals.
To summarize, the relative differences we find between very blue cluster members at large projected radii, and field galaxies with matched colors and luminosities analyzed in the same manner, rule out the dense cluster core as the only site where cluster galaxy transformation occurs. This result is qualitatively similar to the work of Gomez et al. (2003) who found that the SFRs of late-type cluster galaxies are diminished, at cluster-centric distances (3-4 virial radii) well outside of the cluster core, compared with the field population. We note that our data are not sufficient to favor a single well-defined transformation process. For example, we lack observations at large enough cluster-centric radii to extend to the cluster-field transition region where transformation may begin. Moreover, we are magnitude-limited and thus unable to explore the cluster dwarf galaxy population, which could harbor transformed galaxies in some scenarios (e.g. Moore et al., 1999). Nevertheless, in what follows we interpret our findings by examining the predictions of several popular transformation mechanisms.
5.1 Galaxy Transformation Mechanisms
Several physical processes have been suggested to explain the transformation of infalling, star-forming spirals into red cluster S0s. Major mergers are known to create ellipticals (Toomre & Toomre, 1972), and may represent the origin of the homogeneous population of older cluster ellipticals (Kauffmann, 1996); however, this mechanism is likely unimportant considering the high relative velocities ( km s-1) found in massive present-epoch clusters (van Dokkum et al., 1999), and the steadily declining merger rate to the present-day (Dressler et al., 1994a; Couch et al., 1998). Furthermore, only in special cases can mergers produce S0s (Bekki, 2001; Cretton et al., 2001). The removal of hot gas, followed by the subsequent consumption of available fuel with no replenishing source, may be responsible for disk-dominated galaxies with no signs of ongoing SF (“strangulation” or “starvation”, Larson, Tinsley, & Caldwell, 1980; Balogh, Navarro, & Morris, 2000; Balogh et al., 2002b; Bekki, Couch, & Shioya, 2002). For example, halo gas stripping can gradually transform normal star-forming spirals into red cluster S0s with a passive (or anemic) spiral as a transitionary phase (Bekki, Couch, & Shioya, 2002), yet this process has trouble explaining low disk substructure with simultaneous blue colors as seen in cluster VBGs.
The process of galaxy harassment (Moore, Lake, & Katz, 1998; Moore et al., 1999), acting on infalling galaxies within the cluster virial radius, works well to explain the bulk of our observations under the following assumptions: (1) accreted galaxies follow infall orbits like those presented in Bekki, Couch, & Shioya (2002), such that galaxies take several gigayears to move from cluster-centric distances of 2 Mpc to 1 Mpc; (2) the transformation is ongoing and slow (due to the nature of the orbit); and (3) the progenitors of cluster VBGs were late-type spirals (i.e. Sc-Sm), while IBGs were earlier types (Sa-Sb). Galaxy harassment is the tidal induced evolution of a disk galaxy from multiple, high-speed interactions with massive galaxies and the cluster gravitational field (originally Moore, Katz, & Lake, 1996). In simulations harassment is effective at transforming late-type disks (cluster VBG progenitors) into dwarf ellipticals (dEs) or dwarf spheroidals (Moore et al., 1996; Moore, Lake, & Katz, 1998; Moore et al., 1999), and early-type spirals (cluster IBG progenitors) into S0s (Moore et al., 1999). These transformations occur primarily through disk heating and stripping from multiple encounters with other cluster members. The harassment timescale is gigayears, with the effectiveness greatest towards the cluster center where interactions are more frequent (Sensui, Funato, & Makino, 1999); therefore, galaxies on more radially extended orbits may take longer to accumulate harassment effects due to the lower number density of galaxies at larger cluster radii.
Galaxy harassment provides a reasonable process for explaining the relative differences between cluster and field VBGs. Harassment is most effective on lower mass (luminosity) galaxies such as the VBGs we study in this paper. The lack of bright (), large ( kpc) VBG disks in local clusters is consistent with the expectations of harassment where the large scale length ( kpc) disks of low surface brightness galaxies are decreased to kpc through severe () stripping of their stellar disks (Moore et al., 1999). We show in Figure 13 that decreased substructure in VBGs is correlated with disk luminosity; therefore, the significant contrast between the morphological substructure of cluster and field VBGs is highly suggestive of harassment which claims to remove spiral substructure through disk heating (Moore et al., 1999). Finally, the cluster VBGs show evidence of recent SF activity in their color profiles, with some fraction exhibiting blue cores consistent with the large post-starburst population seen in clusters (Caldwell & Rose, 1998; Poggianti et al., 1999; Bartholomew et al., 2001). Harassment may initiate central starbursts, especially in lower luminosity spirals (Sc-Sm), by setting up instabilities that funnel gas towards the galaxy center (Fujita, 1998; Abadi, Moore, & Bower, 1999).
The three conditions we impose above constrain the effects of harassment to be consistent with the spiral-like colors and disk-dominated morphologies of cluster VBGs. Specifically, assumptions (1) and (2) mean that not enough time, nor enough interactions, have transpired to fully strip away the disk of a late-type progenitor (condition 3). Moreover, even though the cluster VBG disks are smaller, they maintain a small measure if their progenitors were nearly pure disks to begin with. In other words, stripping a pure large disk merely produces a small disk.
In addition, the observed properties of cluster IBGs are consistent with the predictions of galaxy harassment if condition (3) holds – namely the progenitors of cluster IBGs were early-type spirals. For this case, the effects of galaxy harassment on these high surface brightness (HSB) systems is less severe than for low surface brightness later types (Moore et al., 1999). Early types will transform into S0s, that is bulge-dominated galaxies with smooth appearances, in agreement with cluster IBGs that have significantly different distributions compared to the disk-dominated VBGs, yet have equally little substructure. Furthermore, the cluster IBGs have a higher fraction of larger ( kpc) disks compared to the VBGs, which is consistent with galaxy harassment because this process will heat, but not destroy, the disks of HSB galaxies (Moore et al., 1999). In fact, many of these moderately blue cluster members are likely the modern-day counterparts to the blue S0s found in more distant () clusters (van Dokkum et al., 1998; Rakos et al., 2000; Smail et al., 2001). We note that some cluster IBGs, especially the fraction that are small and faint, may be further evolved galaxies along a sequence from VBG to IBG. As such, the progenitors of these galaxies would be the same as VBGs, but accreted at earlier times and thus midway to a dE morphology, the cluster VBG endpoint in the galaxy harassment scenario.
Finally, it is likely that gas stripping is responsible ultimately for reducing SFRs in accreted galaxies and producing predominantly red cluster populations over time, especially as infalling galaxies enter the dense central regions (Valluri & Jog, 1990; Abadi, Moore, & Bower, 1999; Quilis, Moore, & Bower, 2000; Bekki, Couch, & Shioya, 2002). Ram-pressure stripping, first proposed by Gunn & Gott (1972), is the removal of the cold, neutral gas reservoir in a star-forming spiral by its rapid motion through the hot ICM. Stripping appears responsible for the H I deficiencies in cluster later types (e.g. Magri et al., 1988; Vollmer et al., 2001), and for X-ray wakes trailing behind ellipticals observed in nearby clusters (Drake et al., 2000). Recent 3D simulations show this process is efficient at quickly ( yrs) removing gas from disk galaxies and thus suppressing SF (Abadi, Moore, & Bower, 1999). Adding the effects of turbulent and viscous stripping, Quilis, Moore, & Bower (2000) find that of the H I gas in a luminous spiral like the Milky Way is removed within yrs via this mechanism when the galaxy passes through a dense cluster core ( kpc). These authors find that stripping quickly extinguishes SF and, thus, provides an explanation for the enhanced Balmer absorption observed in many cluster galaxies (e.g. Couch & Sharples, 1987; Barger et al., 1996). Yet the required close core passage presents a problem with invoking ram-pressure stripping to explain the properties we observe in the blue cluster galaxy population. This process is likely limited to work well only within the cluster core (Abadi, Moore, & Bower, 1999; Quilis, Moore, & Bower, 2000); therefore, stripping is probably unimportant for the IBG and VBG members that are not yet physically located near the dense cluster center (Paper 2). Nevertheless, the blue and moderately blue cluster galaxies must eventually experience stripping when their orbits bring them within .
We note that given the spiral-like colors of cluster VBGs, it appears that morphological transformation is separate from, and begins before, color evolution. This intriguing results runs contrary to previous work on more distant clusters that find red galaxies with late-type morphologies (passive spirals) suggesting color evolution precedes morphological transformation (e.g. Couch et al., 1998; Poggianti et al., 1999; Dressler et al., 1999). We note that we find examples of rare passive spirals in our cluster sample (Paper 2), which underscores the complex nature of galaxy transformation and the likelihood that multiple processes must be important at different times and under varying conditions. For example, there exists observational evidence that ram-pressure stripping is occurring well outside of cluster cores (Neumann et al., 2001). In addition, galaxies on semi-circular orbits that pass within a few may experience a slow gas removal resulting in a SF decline rather than a truncation (Kodama & Bower, 2001). This is similar to the predicted effects of hot halo gas stripping (e.g. Larson, Tinsley, & Caldwell, 1980; Balogh, Navarro, & Morris, 2000; Balogh et al., 2002b; Bekki, Couch, & Shioya, 2002). Nevertheless, while it is possible that hot or cold gas stripping can explain certain unique examples found within the cluster sample, it cannot explain simultaneously the very blue colors, blue cores, and lack of morphological substructure we find in the bulk of cluster VBGs.
6 Conclusions
The morphological transformation of field (or filament) spirals during infall into the dense cluster environment (e.g. Kodama & Smail, 2001) has been proposed to explain the rapid evolution of cluster galaxies over the past 5 gigayears. In particular, the spiral-to-S0 ratio in clusters has decreased from at to at present day, suggesting a direct evolutionary link between the decreasing numbers of spirals and increasing numbers of S0s (Dressler et al., 1997). In this paper we uncover evidence for environment-driven galaxy transformation through a detailed comparison of recent cluster arrivals with galaxies of similar luminosities and blue colors in the field. In a Universe without environmental dependent evolution outside of the dense cluster cores, we would expect blue disk galaxies inhabiting field and cluster regions to have similar morphology, size, and color gradient distributions. Our findings show conclusively that fundamental galaxy properties do indeed reflect the environment in which the galaxy is found.
We find structural differences between the blue galaxies inhabiting nearby () clusters, compared to field environments. The majority of blue cluster members are physically smaller and fainter than their field counterparts. At a matched size and luminosity, the newer cluster arrivals have quantifiably less internal substructure, yet have equally disk-dominated morphologies as normal field spirals. Furthermore, half of blue cluster galaxies have blue cores or globally blue color profiles in contrast with field spirals which typically show redward color gradients. Blue cores suggest enhanced nuclear star formation, possibly a starburst, while uniformly blue profiles are consistent with an episode of fairly strong global star formation in the past few gigayears. We show in Paper 2 that blue cluster galaxies are members of a recently infalling population that has not yet encountered the cluster core. Therefore, the differences we observe between very blue cluster and field galaxies show that galaxy transformation occurs in accreted galaxies before the violent effects (e.g. strong tides, ram-pressure) of the cluster core come into play.
Much of what we observe in the blue galaxy populations of local clusters can be explained by the process of galaxy harassment (Moore, Katz, & Lake, 1996; Moore et al., 1996; Moore, Lake, & Katz, 1998; Moore et al., 1999), under several imposed conditions. Nevertheless, ram-pressure stripping (Gunn & Gott, 1972; Abadi, Moore, & Bower, 1999; Quilis, Moore, & Bower, 2000) must play an important role in assuring that SF is eventually quenched in cluster galaxies to produce the strong color evolution, especially towards the cluster core, implied by the Butcher-Oemler effect (Butcher & Oemler, 1984; Rakos & Schombert, 1995; Margoniner et al., 2001, and references therein). The fact that transformation has occurred in cluster galaxies with spiral-like colors (the VBGs) shows that the processes that govern color (SF) and physical morphology evolution are decoupled.
Appendix A Artificially Redshifting and Reobserving the Field Data
To “move” a galaxy out to a further distance, we must artificially degrade the observed image to mimic a larger redshift and different seeing conditions by reducing the flux and smearing the effective resolution. Then we rebin the flux and add noise to construct a new image as if observed with the telescope and detector used to obtain the cluster data.
For each field galaxy we first determine the amount of flux dimming by requiring that the rest-frame magnitude (estimated in §3) is conserved for the observed and artificially redshifted images. Recall that we are using both the NFGS and -band images and transforming these intensity values to rest-frame to match our cluster observations configuration. The expected -band flux of each galaxy that is artificially redshifted to and reobserved through our 0.9-meter/Mosaic system is then
| (A1) |
where is the cosmological distance modulus, mag is the -band Poggianti (1997) -correction, and refers to the total system zero point from the cluster observations (for a 600 second exposure at 1.33 airmass). We reduce the flux of each galaxy image by the ratio
| (A2) |
where is the total model flux from the B/D decomposition to the original NFGS image observed at redshift .
Next, we want each re-imaged galaxy to have the same effective resolution (0.76 kpc) as our furthest cluster imaging. To achieve this seeing we convolve the original, dimmed image with a Gaussian of width
| (A3) |
where is the image’s original full-width at half-maximum seeing and is the desired resolution given by
| (A4) |
The target seeing disk is related to the ratio of physical sizes of an object at redshift and at , which are given by their corresponding angular diameter distance (=153 Mpcfor A85). The additional factors are the -band mode seeing () in the A85 image and the original NFGS image pixel scale . Following Hogg (2000), where is the line-of-sight comoving distance for a given redshift . Assuming a flat Universe,
| (A5) |
Finally, to reimage each galaxy as if through the telescope and detector used during observations of cluster A85, we rebin each galaxy image by a factor
| (A6) |
where is the Mosaic pixel scale. The additional factor of pixel scale ratio is necessary because we are rebinning to a different pixel scale than the original images. We rebin each image with flux conservation. To reproduce the noise characteristics of our cluster imaging, we add the A85 mean sky level with random Poisson noise using the effective Mosaic gain. We apply the full procedure to each and image from our field galaxy sample.
References
- Abadi, Moore, & Bower (1999) Abadi, M. G., Moore, B., & Bower, R. G. 1999, MNRAS, 308, 947
- Abraham et al. (1996) Abraham, R. G., Smecker-Hane, T. A., Hutchings, J. B., Carlberg, R. G., Yee, H. K. C., Ellingson, E., Morris, S., Oke, J. B., & Rigler, M. 1996, ApJ, 471, 694
- Balogh & Morris (2000) Balogh, M. L., & Morris, S. L. 2000, MNRAS, 318, 703
- Balogh, Navarro, & Morris (2000) Balogh, M. L., Navarro, J. F., & Morris, S. L. 2000, ApJ, 540, 113
- Balogh et al. (1997) Balogh, M. L., Morris, S. L., Yee, H. K. C., Carlberg, R. G., & Ellingson, E. 1997, ApJ, 488, L75
- Balogh et al. (1998) Balogh, M. L., Schade, D., Morris, S. L., Yee, H. K. C., Carlberg, R. G., & Ellingson, E. 1998, ApJ, 504, L75
- Balogh et al. (2002a) Balogh, M. L., et al. 2002a, ApJ, 566, 123
- Balogh et al. (2002b) Balogh, M. L., et al. 2002b, MNRAS, 337, 256
- Barger et al. (1996) Barger, A. J., Aragon-Salamanca, A., Ellis, R. S., Couch, W. J., Smail, I., & Sharples, R. M. 1996, MNRAS, 279, 1
- Barnes & Hernquist (1991) Barnes, J. E., & Hernquist, L. E. 1991, ApJ, 370, 65
- Bartholomew et al. (2001) Bartholomew, L. J., Rose, J. A., Gaba, A. E., & Caldwell, N. 2001, AJ, 122, 2913
- Bekki (1998) Bekki, K. 1998, ApJ, 502, L133
- Bekki (1999) Bekki, K. 1999, ApJ, 510, 15
- Bekki (2001) Bekki, K. 2001, Ap&SS, 276, 847
- Bekki, Couch, & Shioya (2002) Bekki, K., Couch, W. J., & Shioya, Y. 2002, ApJ, 577, 651
- Bicker et al. (2002) Bicker, J., Fritze-von Alvensleben, U., & Fricke, K. J. 2002, A&A, 387, 412
- Binney & Merrifield (1998) Binney, J., & Merrifield, M. 1998, Galactic Astronomy, Princeton University Press
- Burstein & Heiles (1982) Burstein, D., & Heiles, C. 1982, AJ, 87, 1165
- Burstein, Willick, & Courteau (1995) Burstein, D., Willick, J. A., & Courteau, S. 1995, in “The Opacity of Spiral Disks”, NATO ASI Series C, Vol. 469, ed. Davies, J. I., & Burstein, D. (Kluwer: Dordrecht), p. 73
- Burstein et al. (1997) Burstein, D., Bender, R., Faber, S. M., & Nolthenius, R. 1997, AJ, 114, 1365
- Butcher & Oemler (1978a) Butcher, H. R., & Oemler, A., Jr. 1978, ApJ, 219, 18
- Butcher & Oemler (1978b) Butcher, H. R., & Oemler, A., Jr. 1978, ApJ, 226, 559
- Butcher & Oemler (1984) Butcher, H. R., & Oemler, A., Jr. 1984, ApJ, 285, 426
- Byrd & Valtonen (1990) Byrd, G., & Valtonen, M. 1990, ApJ, 350, 89
- Caldwell & Rose (1998) Caldwell, N., & Rose, J. A. 1998, AJ, 115, 1423
- Charlot & Silk (1994) Charlot, S., & Silk, J. 1994, ApJ, 432, 453
- Christlein & Zabludoff (2003) Christlein, D., & Zabludoff, A. I. 2003, ApJ, 591, 764
- Couch et al. (2001) Couch, W. J., Balogh, M. L., Bower, R. G., Smail, I., Glazebrook, K., & Taylor, M. 2001, ApJ, 549, 820
- Couch et al. (1998) Couch, W. J., Barger, A. J., Smail, I., Ellis, R. S., & Sharples, R. M. 1998, ApJ, 497, 188
- Couch et al. (1994) Couch, W. J., Ellis, R. S., Sharples, R. M., & Smail, I. 1994, ApJ, 430, 121
- Couch & Sharples (1987) Couch, W. J., & Sharples, R. M. 1987, MNRAS, 229, 423
- Cretton et al. (2001) Cretton, N., Naab, T., Rix, H.-W., & Burkert, A. 2001, ApJ, 554, 291
- de Jong (1996a) de Jong, R. S. 1996a, A&AS, 118, 557
- de Jong (1996b) de Jong, R. S. 1996b, A&A, 313, 45
- de Jong (1996c) de Jong, R. S. 1996c, A&A, 313, 377
- De Propris et al. (2002) De Propris, R., et al. 2002, MNRAS, 329, 87
- de Vaucouleurs (1948) de Vaucouleurs, G. 1948, Ann. d’Astrophys., 11, 247
- Diaferio et al. (2001) Diaferio, A., Kauffmann, G., Balogh, M. L., White, S. D. M., Schade, D., & Ellingson, E. 2001, MNRAS, 323, 999
- D’Onofrio (2001) D’Onofrio, M. 1994 MNRAS, 271, 523
- Drake et al. (2000) Drake, N., Merrifield, M. R., Sakelliou, I., & Pinkney, J. C. 2000, MNRAS, 314, 768
- Dressler (1980) Dressler, A. 1980, ApJ, 236, 351
- Dressler & Gunn (1983) Dressler, A., & Gunn, J. E. 1983, ApJ, 270, 7
- Dressler et al. (1994a) Dressler, A., Oemler, A., Jr., Butcher, H. R., & Gunn, J. E. 1994, ApJ, 430, 107
- Dressler et al. (1994b) Dressler, A., Oemler, A., Jr., Sparks, W. B., & Lucas, R. A. 1994, ApJ, 435, L23
- Dressler et al. (1997) Dressler, A., et al. 1997, ApJ, 490, 577
- Dressler et al. (1999) Dressler, A. et al. 1999, ApJS, 122, 51
- Ellingson et al. (2001) Ellingson, E., Lin, H., Yee, H. K. C., & Carlberg, R. G. 2001, ApJ, 547, 609
- Ellis et al. (1997) Ellis, R. S., et al. 1997, ApJ, 483, 582
- Fujita (1998) Fujita, Y. 1998, ApJ, 509, 587
- Fujita & Nagashima (1999) Fujita, Y., & Nagashima, M. 1999, ApJ, 516, 619
- Fukugita, Shimasaku, & Ichikawa (1995) Fukugita, M., Shimasaku, K., & Ichikawa, T. 1995, PASP, 107, 945
- Giovanelli et al. (1994) Giovanelli, R., et al. 1994, AJ, 107, 2036
- Girardi et al. (1998) Girardi, M., Giuricin, G., Mardirossian, F., Mezzetti, M., & Boschin, W. 1998, ApJ, 505, 74
- Gomez et al. (2003) Gomez, P. L., et al. 2003, ApJ, 584, 210
- Goto et al. (2002) Goto, T., et al. 2002, PASJ, 54, 515
- Graham (2001) Graham, A. W. 2001, AJ, 121, 820
- Gunn & Gott (1972) Gunn, J. E., & Gott, J. R., III 1972, ApJ, 176, 1
- Hashimoto et al. (1998) Hashimoto, Y., Oemler, A., Jr., Lin, H., & Tucker, D. L. 1998, ApJ, 499, 589
- Hashimoto & Oemler (1999) Hashimoto, Y., & Oemler, A., Jr. 1999, ApJ, 510, 609
- Hogg (2000) Hogg, D. W. 2000, astro-ph/9905116v4
- Huchra (1983) Huchra, J., Davis, M., Latham, D., & Tonry, J. 1983, ApJS, 52, 89
- Im et al. (2001) Im, M., et al. 2001, AJ, 122, 750
- Im et al. (2002) Im, M., et al. 2002, ApJ, 571, 136
- James et al. (2003) James, P. A., et al. 2003, A&A accepted (astro-ph/0311030)
- Jansen et al. (2000) Jansen, R. A., Franx, M., Fabricant, D., & Caldwell, N. 2000, ApJS, 126, 271
- Kauffmann (1996) Kauffmann, G. 1996, MNRAS, 281, 487
- Kennicutt (1994) Kennicutt, R. C., Jr., Tamblyn, P., & Congdon, C. W. 1994, ApJ, 435, 22
- Kennicutt (1998) Kennicutt, R. C., Jr. 1998, ARA&A, 36, 189
- Kodama & Bower (2001) Kodama, T., & Bower, R. G. 2001, MNRAS, 321, 18
- Kodama & Smail (2001) Kodama, T., & Smail, I. 2001, MNRAS, 326, 637
- Kodama et al. (2001) Kodama, T., Smail, I., Nakata, F., Okamura, S., & Bower, R. G. 2001, ApJ, 562, L9
- Larson, Tinsley, & Caldwell (1980) Larson, R. B., Tinsley, B. M., & Caldwell, C. N. 1980, ApJ, 237, 692
- Lavery & Henry (1988) Lavery, R. J., & Henry, J. P. 1988, ApJ, 330, 596
- Lewis et al. (2002) Lewis, I., et al. 2002, MNRAS, 334, 673
- Lilly et al. (1998) Lilly, S., et al. 1998, ApJ, 500, 75
- Magri et al. (1988) Magri, C., Haynes, M. P., Forman, W., Jones, C., & Giovanelli, R. 1988, ApJ, 333, 136
- Margoniner et al. (2001) Margoniner, V. E., de Carvalho, R. R., Gal, R. R., & Djorgovski, S. G. 2001, ApJ, 548, L143
- Marzke, Huchra, & Geller (1994) Marzke, R. O., Huchra, J. P., & Geller, M. J. 1994, ApJ, 428, 43
- McIntosh et al. (2004) McIntosh, D. H., Rix, H.-W., Caldwell, N., & Zabludoff, A. I. 2004, ApJ, submitted (astro-ph/ Paper 2)
- Melnick & Sargent (1977) Melnick, J., & Sargent, W. L. W. 1977, ApJ, 215, 401
- Moore, Katz, & Lake (1996) Moore, B., Katz, N., & Lake, G. 1996, ApJ, 457, 455
- Moore, Lake, & Katz (1998) Moore, B., Lake, G., & Katz, N. 1998, ApJ, 495, 139
- Moore et al. (1996) Moore, B., Katz, N., Lake, G., Dressler, A., & Oemler, A., Jr. 1996, Nature, 379, 613
- Moore et al. (1999) Moore, B., Lake, G., Quinn, T., & Stadel, J. 1999, MNRAS, 304, 465
- Neumann et al. (2001) Neumann, D. M. et al. 2001, A&A, 365, 74
- Oemler (1974) Oemler, A., Jr. 1974, ApJ, 194, 1
- Oemler, Dressler, & Butcher (1997) Oemler, A., Jr., Dressler, A., & Butcher, H. R. 1997, ApJ, 474, 561
- Peletier et al. (1990) Peletier, R. F., Davies, R. L., Illingworth, G. D., Davis, L. E., & Cawson, M. 1990, AJ, 100, 1091
- Poggianti (1997) Poggianti, B. M. 1997, A&AS, 122, 399
- Poggianti et al. (1999) Poggianti, B. M., Smail, I., Dressler, A., Couch, W. J., Barger, A. J., Butcher, H., Ellis, R. S., & Oemler, A. 1999, ApJ, 518, 576
- Postman & Geller (1984) Postman, M., & Geller, M. J. 1984, ApJ, 281, 95
- Quilis, Moore, & Bower (2000) Quilis, Moore & Bower 2000, Science, 288, 1617
- Rakos & Schombert (1995) Rakos, K. D., & Schombert, J. M. 1995, ApJ, 439, 47
- Rakos et al. (2000) Rakos, K. D., Schombert, J. M., Odell, A. P., & Steindling, S. 2000, ApJ, 540, 715
- Rose et al. (2001) Rose, J. A., Gaba, A. E., Caldwell, N., & Chaboyer, B. 2001, AJ, 121, 793
- Schlegel, Finkbeiner, & Davis (1998) Schlegel, D. J., Finkbeiner, D. P., & Davis, M. 1998, ApJ, 500, 525
- Sensui, Funato, & Makino (1999) Sensui, T., Funato, Y., & Makino, J. 1999, PASJ, 51, 943
- Simard et al. (1999) Simard, L., et al. 1999, ApJ, 519, 563
- Simard et al. (2002) Simard, L., et al. 2002, ApJS, 142, 1
- Smail et al. (2001) Smail, I., Kuntschner, H., Kodama, T., Smith, G. P., Packham, C., Fruchter, A. S., & Hook, R. N. 2001, MNRAS, 323, 839
- Solanes & Salvador-Sole (1992) Solanes, J. M., & Salvador-Sole, E. 1992, ApJ, 395, 91
- Spitzer & Baade (1951) Spitzer, L., Jr., & Baade, W. 1951, ApJ, 113, 413
- Terlevich, Caldwell, & Bower (2001) Terlevich, A. I., Caldwell, N., & Bower, R. G. 2001, MNRAS, 326, 1547
- Terlevich et al. (1999) Terlevich, A. I., Kuntschner, H., Bower, R. G., Caldwell, N., & Sharples, R. 1999, MNRAS, 310, 445
- Toomre & Toomre (1972) Toomre, A., & Toomre, J., Galactic Bridges and Tails, 1972, ApJ, 178, 623
- Tran et al. (2001) Tran, K.-V. H., Simard, L., Zabludoff, A. I., & Mulchaey, J. S. 2001, ApJ, 549, 172
- Tully et al. (1998) Tully, R. B., et al. 1998, AJ, 115, 2264
- Valluri & Jog (1990) Valluri, M. & Jog, C. J. 1990, ApJ, 357, 367
- van den Bergh (1976) van den Bergh, S. 1976, ApJ, 206, 883
- van Dokkum & Franx (2001) van Dokkum, P. G., & Franx, M. 2001, ApJ, 553, 90
- van Dokkum et al. (1998) van Dokkum, P. G. et al. 1998, ApJ, 500, 714
- van Dokkum et al. (1999) van Dokkum, P. G., Franx, M., Fabricant, D., Kelson, D. D., & Illingworth, G. D. 1999, ApJ, 520, 95
- Vollmer et al. (2001) Vollmer, B., Cayatte, V., Balkowski, C., & Duschl, W. J. 2001, A&A, 369, 432
- West, Jones, & Forman (1995) West, M. J., Jones, C., & Forman, W. 1995, ApJ, 451, L5
- White & Frenk (1991) White, S. D. M., & Frenk, C. S. 1991, ApJ, 379, 52
- White & Rees (1978) White, S. D. M., & Rees, M. J. 1978, MNRAS, 183, 341
| Cluster | ||||||||
|---|---|---|---|---|---|---|---|---|
| (1) | (2) | (3) | (4) | (5) | (6) | (7) | (8) | (9) |
| A85 | 00 41 50.5 | -09 18 11.6 | 16607 | 993 | 180 | 17 | 33 | 1.94 |
| A496 | 04 33 37.8 | -13 15 43.5 | 9910 | 728 | 146 | 7 | 27 | 1.37 |
| A754 | 09 08 32.4 | -09 37 46.5 | 16369 | 953 | 311 | 39 | 24 | 1.32 |
Note. — Abell cluster name (1) and coordinates (2,3) of the central cD galaxy. The mean cluster recessional velocity (4) and internal velocity dispersion (5), in units of km , are given from the spectroscopic survey of Christlein & Zabludoff (2003). Total number of spectroscopically confirmed members (5), number of IBGs (6), and number of VBGs (7). In (8) we give the virial radius ( Mpc) from data compiled in Girardi et al. (1998).
| Sample 1 | Sample 2 | ||||||
|---|---|---|---|---|---|---|---|
| (1) | (2) | (3) | (4) | (5) | (6) | (7) | (8) |
| cluster VBG | field VBG | 80:63 | 44.3 | 16:29 | 99.6 | 80:63 | |
| cluster IBG | field IBG | 63:15 | 72.1 | 26:10 | 92.9 | 63:15 | 83.6 |
| cluster VBG | cluster IBG | 80:63 | 16:26 | 1.6 | 80:63 | 96.4 | |
| field VBG | field IBG | 63:15 | 94.4 | 29:10 | 83.3 | 63:15 | 83.6 |
Note. — Descriptions of the pair of samples we use for each K-S test are in (1) and (2). The number of galaxies in the two samples and the K-S probability that the distributions are not drawn from the same parent sample are given for (3 and 4), for (5 and 6), and for (7 and 8). The number of galaxies we use for comparisons are reduced due to the reliability limit for measurements at the common effective resolution.