Send correspondence to
W. H. Baumgartner
Address: NASA Goddard Space Flight Center, Code 661, Greenbelt, MD
20771, USA
E-mail: wayne@astro.umd.edu
The InFOCS Hard X-ray Telescope: Pixellated CZT Detector/Shield Performance and Flight Results
Abstract
The CZT detector on the InFOCS hard X-ray telescope is a pixellated solid-state device capable of imaging spectroscopy by measuring the position and energy of each incoming photon. The detector sits at the focal point of an 8 m focal length multilayered grazing incidence X-ray mirror which has significant effective area between 20–40 keV. The detector has an energy resolution of 4.0 keV at 32 keV, and the InFOCS telescope has an angular resolution of 2.2 arcminute and a field of view of about 10 arcminutes. InFOCS flew on a balloon mission in July 2001 and observed Cygnus X-1. We present results from laboratory testing of the detector to measure the uniformity of response across the detector, to determine the spectral resolution, and to perform a simple noise decomposition. We also present a hard X-ray spectrum and image of Cygnus X-1, and measurements of the hard X-ray CZT background obtained with the SWIN detector on InFOCS.
keywords:
CZT, background, shielding, balloon flights, hard X-ray astronomy, instrumentation1 INTRODUCTION
The International Focusing Optics Collaboration for -Crab Sensitivity (InFOCS) is a balloon borne hard X-ray telescope for the hard X-ray bands 20–40 and 65–70 keV. InFOCS uses grazing incidence multilayer mirrors[1, 2, 3, 4] to focus astronomical photons onto a pixellated planar CdZnTe (CZT) detector.
CZT detectors are a natural fit for high energy X-ray astronomy. They have better energy resolution than scintillator detectors such as CsI or NaI, and the rather large bandgap allows us to dispense with the cryogenic cooling necessary for Ge detectors. The high atomic number of the CZT constituents provides a large cross section for photoelectric interaction with photons, allowing detectors to be built with small thicknesses in order to reduce sensitivity to volume dependent background components such as the particle flux in the upper atmosphere. CZT can be manufactured with pixellated contacts that allow fine spatial determination of the incoming photons, and when operated at moderate temperatures (around 0∘ C) the low leakage current of the CZT causes minimal noise and permits a very high sensitivity.
The complete InFOCS design calls for four mirrors and four focal planes. This plan allots one mirror for the low energy band of 20–40 keV, and three mirrors to cover the higher energy band 65–70 keV around the 68 keV 44Ti line from supernova remnants. Each of the confocal 8 meter focal length mirrors will have its own CZT detector and shield. The design parameters for the complete InFOCS telescope are given in Table 1.
| Parameter | Low Energy | High Energy |
|---|---|---|
| Focal Length | 8.0 m | 8.0 m |
| Bandpass | 20–40 keV | 65–70 keV |
| Number of Mirrors | 1 | 3 |
| Mirror Diameter | 40 cm | 30 cm |
| Effective Area | 42 cm2 @ 30 keV | 70 cm2 |
| Field of View | 9.6 arcmin | 2–3 arcmin |
| Angular Resolution | 2.2 arcmin FWHM | 1 arcmin |
| PSF | 4 mm FWHM | 2 mm FWHM |
| Detector Material | CdZnTe (CZT) | CZT |
| Detector Size | 2.72.70.2 cm | |
| Pixel Array Size | 12 12 | |
| Pixel Spacing | 2.1 mm | |
| 54 arcsec | ||
| Active Shield | 3.0 cm CsI | |
| Energy Resolution | 4.0 keV @ 32 keV | 5 keV |
| E/E | 8% at 60 keV | |
| Threshold | 18 keV | |
| Shield FOV | 8.1∘ | |
| Background | ||
| cts/cm2/sec/keV |
The detectors on InFOCS have flown on two balloon flights: a June 2000 flight of only the focal plane, and the first science flight of the entire telescope in July 2001. The first science flight in July 2001 included only one mirror and detector in the low energy band; future flights will add more mirrors and detectors as they are completed. This paper concentrates on the detector performance; mirror results can be found in[1, 2, 3, 4]. For reference, the effective area of the first InFOCS 20–40 keV multilayer mirror is given in Figure 1.

2 FOCAL PLANE
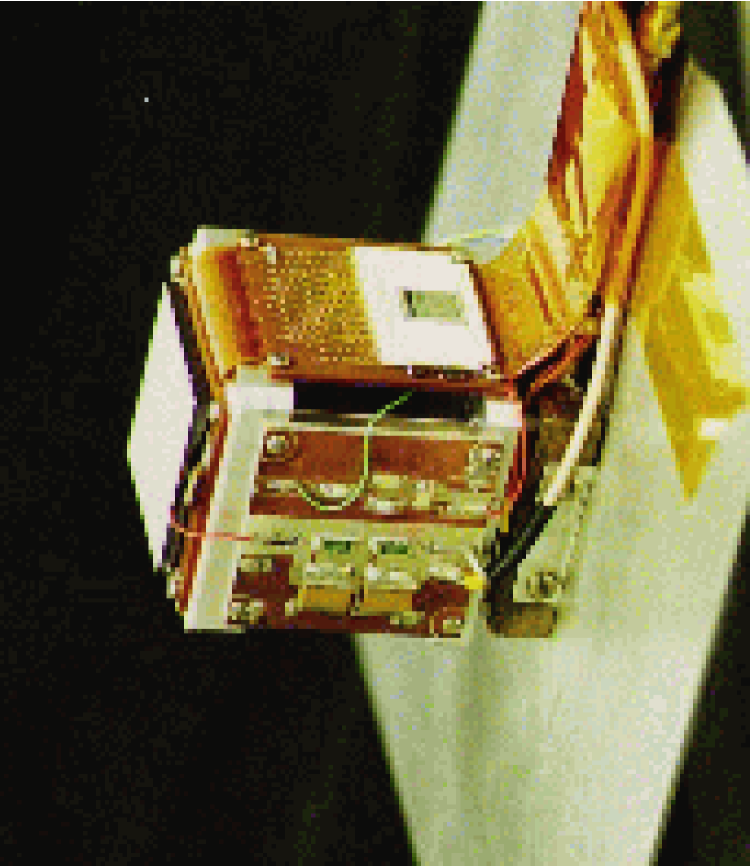
The active components of the InFOCS focal plane consist of a 2.7 cm 2.7 cm 0.2 cm piece of CZT, and a 3 cm thick CsI anticoincidence shield. The CZT detector is configured with a planar Pt contact on one of the large faces, and a 12 12 segmented array of contacts on the opposite face delineating the detector pixels. The pixels are 2.0 mm square, and are placed on 2.1 mm centers. The detector is mounted on the top of a 4 cm cube of aluminum that serves as a base for the detector and its associated electronics, and as a coldfinger to connect the detector to a thermoelectric cooler and liquid heat exchanger. A photograph of the detector cube assembly is shown in Figure 2.
The detector is connected with conductive epoxy dots under each pixel to traces on a PC board that route the detector signals through a semi-rigid flex cable and onto a separate circuit board on the side of the cube. This circuit board contains the decoupling capacitors and bleed off resistors for each pixel, a ceramic fan-in assembly, and an XA-1 ASIC. The filter circuitry for the detector bias voltage is located on a separate side panel of the cube. The detector bias voltage is applied so that the top planar contact acts as the cathode and the pixels as anodes. The operating voltage is typically volts applied to the cathode, leaving the pixels and the ASIC inputs at ground potential.
The XA-1 ASIC we use is the same one used in the Swift BAT detector, and accepts 128 input channels. (Four pixels in each corner of the 12 12 detector pixel array are left unconnected in order to arrive at 128 input signals for the XA-1.) The ASIC contains a charge sensitive preamplifier and shaping circuit for each pixel, and allows the setting of a threshold for event detection. The ASIC also contains a pulser circuit that can be routed to the inputs in order to test the response of the system.
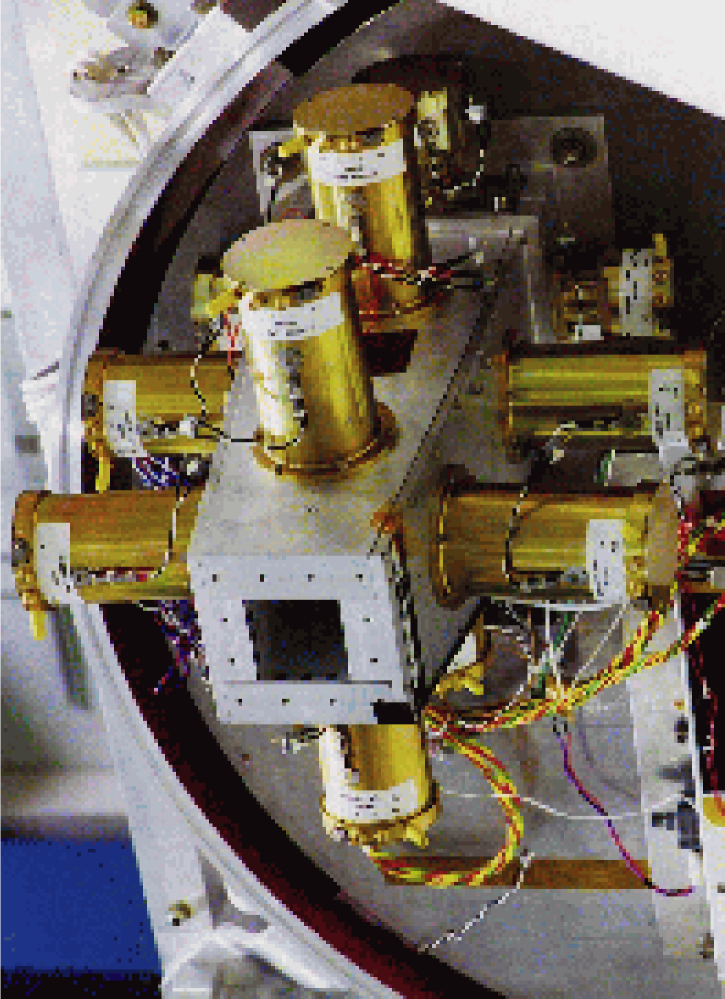
We place the detector cube assembly in the bottom of a well of 3.0 cm thick CsI that acts as an active shield to reduce the background from particles and photons not incident along the mirror focal direction. We are able to set an operating threshold of 15 keV for the shield, and operate it as an anti-coincidence veto for signals recorded in the detector. The detector sits 32 cm behind the opening on the front surface of the shield, and sees a shield opening angle of 8.1∘. The 15 keV threshold is sufficient to reduce contamination from high energy background components. Figure 3 shows a photograph of the InFOCS shield assembly.
3 DETECTOR TEST RESULTS
The CZT detector program at Goddard has tested several designs for a CZT-ASIC combination. All of them are designed around the same size piece of CZT, 2.7 cm2.7 cm0.2 cm. We were able to achieve these large dimensions for our detector with the aid of IR scanning and X-ray screening techniques that allowed us to examine CZT wafers in order to find large homogeneous pieces without defects[5, 6].
The first generation detector system tested at Goddard was based on a University of Arizona ASIC designed for medical imaging. This ASIC utilized an integrating amplifier mechanism which read out every pixel each readout cycle, had a 6464 array of 380 m pixels, and was constructed so that the CZT detector could be directly connected to the ASIC using indium bump bonding. With this detector we achieved an energy resolution of 2.3 keV FWHM for the 22 keV 109Cd line (Figure 4),


but the ASIC readout mechanism had an unacceptable deadtime for astronomical applications. The main advantage of the UA detector was the excellent energy resolution that came from the small pixel effect111The small pixel effect is a geometry dependent effect present in pixellated planar detectors that have pixel sizes small compared to the detector thickness. The effect allows for increased spectral resolution because most of the signal is generated by high mobility electrons instead of low mobility holes. and the low input capacitance inherent to the bump bonding technique.
The second generation detector developed at Goddard was based on an ASIC that used a sparse readout mechanism. Like the UA detector, it also was an integrating ASIC meant to be directly bump bonded to a CZT detector with small pixels. The sparse readout mechanism was designed to only read out those pixels with events by comparing the pixel signals to a set of hold capacitors storing a bias frame. Unfortunately, the Mitel foundry 3 m process used in the ASIC construction was unable to produce a matched set of hold capacitors for each pixel that allowed a suitable triggering mechanism to be implemented. More troubling, the digital switching signals in the ASIC easily coupled through the CZT into the inputs, severly increasing noise and reducing the energy resolution achievable with this design. The switching signals also coupled onto the top side cathode signal, degrading it and preventing us from using it as an event trigger.
The third detector design tested at Goddard was a fallback plan based on the design for the Swift BAT CZT detector, and was called the SWIN detector (for Swift-InFOCS). This is the detector design that was flown on the balloon flights. The XA-1 is not an integrating ASIC, and uses the more conventional design of a charge sensitive preamplifier and shaping stages before a discriminator to detect events above a preset threshold. The SWIN detector also differs from the previous detectors in that the CZT is not directly bump bonded to the ASIC; in SWIN, the signal is routed from the CZT to the ASIC via traces on a circuit board and a fan-in assembly. Also, the XA-1 ASIC has only 128 channels, so the pixel size was increased from 380 m to 2.0 mm in order to match the number of pixels to the number of ASIC channels. A 2.0 mm pixel still oversamples the 4.0 mm PSF of the mirror, but no longer benefits from the small pixel effect.
We measured the SWIN detector for uniformity of response among the pixels and for gain and offset determination by flood illuminating the detector with a 133Ba source. Test data for the SWIN detector taken under flight-like conditions ( = 10∘ C and bias voltage = volts) are given in Figure 5.

Flood illumination data show that the SWIN detector response is rather uniform across the face of the CZT. About 10% of the pixels suffer from low gain or very high noise. The position of these pixels is not coincident with any known defects in the crystal found by imaging with an IR scan. Since most of these pixels are adjacent to each other on the detector, we conclude that they are shorted pixels caused by spreading of the conductive epoxy dots joining the CZT to the carrier board. Tests with a collimated source confirm this conclusion. This problem does not significantly affect the telescope performance because the central part of the pixel array at the focus of the mirror is relatively free of shorted pixels.
The spectral resolution of an average pixel in the SWIN detector under flood illumination at the 60 keV 241Am line is 4.8 keV (Figure 4). The overall leakage curent of the entire detector under flight conditions is about 20 nA. The measured resolution of the SWIN detector at the 137Cs 32.1 keV line is 4.0 keV FWHM (see Figure 6).

With these spectral resolution measurements at two different energies, we can begin to decompose the line spread function into its different components. To first order, the line spread function is composed of an energy independent part and a component that is linearly dependent on energy:
where is the measured energy resolution, is the constant term, and is the energy dependent term. The constant term, , is primarily due to noise (such as leakage current), and the energy dependent term, , depends heavily on the charge collection properties of the CZT material. If we take , then we have
an equation in the two unknowns and . Using our two measured spectral resolutions at 32.1 keV and 59.5 keV and eliminating , we obtain keV. Solving for , we get keV at 32.1 keV and keV at 59.5 keV. These numbers indicate that flat spectrum noise is the dominant contribution to the line spread function in our energy range of 20–40 keV. Incomplete charge collection in the CZT detector becomes important at higher energies, but is only a secondary factor at 30 keV.
In order to investigate the noise contribution to the line spread function, we used the internal XA-1 pulser circuit connected to the inputs of the ASIC. Pulser measurements of the ASIC alone show a line spread function of less than 1 keV, indicating that noise generated within the ASIC electronics is not the dominant component of the noise contribution. Pulser resolution measurements with the CZT detector connected to the ASIC inputs are consistent with measurements taken with a radioactive source, indicating that the dominant source of noise contributing to the energy independent noise term is external to the ASIC and comes from the detector and its circuitry. We varied the temperature of the detector/ASIC and the bias voltage to investigate the effects of leakage current on the line spread function and find that the leakage current component of the noise is not a dominant contribution. The most likely cause of the high noise term is the high input capacitance caused by the long lead lengths connecting the pixels to the ASIC.
4 FLIGHT RESULTS
4.1 The August 2000 Focal Plane Test Flight
In August 2000, we took InFOCS to Palestine, Texas to fly the detector at the National Scientific Balloon Facility. The main purpose of the flight was to test our detector at float altitudes to determine the count rate from the particle background, and the effectiveness of our anti-coincidence shield system. This measurement was a key parameter in the determination of the sensitivity of the instrument. No mirror was present, and no astronomical objects were observed. Also flying on this test flight were two BAT detectors from the Swift mission that were being checked for similar reasons. Another main goal of the flight was to check other flight systems in a realistic environment.
The balloon was launched on August 29, flew for seven hours at 118,000 ft, and was successful in measuring a relatively flat CZT background in flight of .
4.2 July 2001 Science Flight
In July, 2001 InFOCS flew its first science flight from with a complete mirror and detector system from Palestine, Texas. This flight achieved three hours at float altitude and allowed InFOCS to become the first telescope to utilize a multilayer mirror and detect an astronomical source using CZT detectors.
4.2.1 Cygnus X-1 results
During the July 2001 science flight, the pointing system failed to achieve the necessary one arcminute pointing to track a source. InFOCS concentrated on obtaining as many photons as possible from the bright source Cyg X-1. Analysis of the attitude data after the flight showed stochastic long time scale 30–45 arcminute pointing errors probably caused by turbulence and wind shifts in the upper atmosphere. Figure 7
S

shows the lightcurve for a two hour observation of Cyg X-1, and indicates several high count rate periods when we detected Cyg X-1 when the pointing was momentarily good.
Figure 8

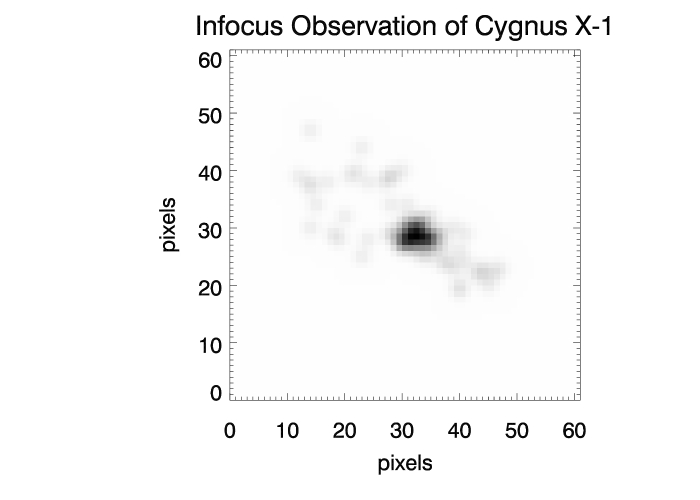
shows the spectrum extracted from these high count rate times and confirms the detection of Cyg X-1. The peak indicated in the spectrum between 30–50 keV falls in the approximate location of the mirror bandpass, trails off at low energy as would a continuum source attenuated by the atmosphere, and also falls at high energies as the effective area of the mirror decreases. The apparent mismatch between the 20–60 keV width of the peak and the 20–40 keV mirror bandpass is due to ASIC offset drift that could not be calibrated because of a defective inflight pulser system. The actual calibration used is based on the best available ground calibration with radioactive sources. Figure 8 also shows an image of the photons detected during these high count rate times derived from post-flight attitude reconstructed data convolved with the telescope PSF.
We also used the exposure corrected image to determine the flux of Cyg X-1. Starting from the exposure corrected image, we subtracted the background rate to obtain the observed Cyg X-1 count rate in the 20–40 keV band. We then folded the Cyg X-1 spectrum given by Doebereiner et al[7] through our model atmosphere (3.3 g cm-2 and an elevation of 75∘) and measured mirror effective area to obtain the model count rate. The ratio of the count rates multiplied by the model flux gives us our observed flux of . This value is in good agreement with the Doebereiner HEXE result of given the known variability of Cyg X-1.
4.2.2 Inflight background
The other principal goal of the flight was to measure the background for the CZT detectors in order to determine the sensitivity of InFOCS in future flights, to verify the measurement made in the test flight of 2000, and to demonstrate the suitability of our active CsI shield. Figure 9

shows the InFOCS detector background determined in July 2001. The measured background from a two hour observation is rather flat from 20–120 keV, and lies at cts sec-1 cm-2 keV-1. This number was determined by taking the spectrum in Figure 9 and computing the average and variance of the background level in all the 3 keV wide bins between 20–120 keV. The somewhat high uncertainty is mostly statistical and comes from the fact that even with a two hour observation we have very few photons () in each bin.
This measurement was taken at float altitude of 130,000 ft without using any depth determination techniques to further reduce the background. This measurement gives a lower background than the test flight measurement, but we are more confident of the lower value because the test flight background spectrum was slightly contaminated by interference noise in some of the pixels. We have carefully measured the deadtime in the detector, and find that the largest contribution (from the shield veto) gives less than 1.5% deadtime. The correct measurement of the Cygnus X-1 flux (Section 4.2.1) verifies that the signal chain is operating correctly and does not suffer from any deadtime effects that could affect the background level.
Rothschild[8] and Slavis[9] show that the dominant CZT background components are uniformly distributed in the volume of the CZT detector and that depth determination techniques can reduce the background level by a factor of seven. If we apply their factor of seven to our uncorrected measured results, the InFOCS background is the lowest CZT background yet measured. These results indicate that a heavy active shield operated with a low threshold in conjunction with a depth determination algorithm are both necessary to achieve the lowest possible CZT background levels and the best instrument sensitivity.
5 CONCLUSIONS AND FUTURE PLANS
The InFOCS telescope has demonstrated the effectiveness of a CZT detector coupled to a multilayer mirror for hard X-ray astronomy. The moderate resolution SWIN detector has become the first CZT detector to observe astrophysical photons, and our heavy CsI shielding has enabled us to achieve a very low in flight background. The InFOCS implementation needs improvements in the pointing system before it can do high precision astronomy, but the new technology behind the mirror and detector have proven sound. Even with an on target observation time of only about a minute, we have detected the astrophysical source Cyg X-1 with very high significance.
5.1 Detector Improvements
Our laboratory and flight experience with the SWIN CZT detector and the InFOCS telescope have given us valuable experience to direct future improvements. The most important goal is to improve the spectral resolution of the detector. Our plans for the next generation InFOCS detector will have an improved layout that will reduce input capacitance by shortening the lead length between the CZT and ASIC. Reducing the pixel size and adding steering electrodes will improve charge collection, also improving the energy resolution. Another possibility for reducing the input capacitance is to remove the decoupling capacitors between the CZT and ASIC. This requires a very low leakage current, but this can be achieved by running the detector much colder. Takahashi et al.[10] have shown improved energy resolution in CZT detectors by operating at a very high voltage in order to improve charge collection. This also requires very low temperatures in order to minimize the leakage current, but our detector temperature regulation system is able to go down to without modification, and colder with some minor hardware changes.
New ASICs are another important step towards improving energy resolution. We are currently designing a custom ASIC specifically for our detector configuration that should not be as sensitive to input capacitance effects. Also, a newer generation of XA-1 ASIC has been developed with much improved temperature stability that will significantly reduce our susceptibility to offset drifts. This ASIC is being used in the Swift BAT flight detectors, and will be tested for future InFOCS detectors.
Other groups have shown the importance of using a depth determination mechanism to achieve the lowest detector background and best sensitivity. We have been experimenting with two different techniques, one based on utilizing the cathode signal and another based on using the measured charge spreading in neighboring small pixels to determine the depth of interaction. The cathode signal method is simpler to operate but more difficult to implement since the cathode signal has an inherently worse resolution because most of its signal is generated by holes. A possible solution to this problem is to segment the cathode electrode into strips, lowering the capacitance and improving the resolution so that the cathode signal can be used.
Dan Marks has shown in his Ph.D. thesis[11] that determining the photon depth of interaction by observing the signal in the neighboring pixels is possible. However, this is also difficult in practice because of the computational complexity, and because it requires the neighboring pixel signals. More recent versions of the XA-1 ASIC than the one used in SWIN have this capability, and we will explore this method for background rejection.
5.2 Future Flight Plans
The most important enhancement to the InFOCS platform will be to improve the pointing system to allow long-term stable pointing at the one arcminute level. Our flight experience has given us valuable data on high-altitude winds and turbulence that will be incorporated into a future design utilizing more robust pointing mechanisms with a larger dynamic range.
Future flights of InFOCS will also fly more advanced technology as it becomes available. The Nagoya group is working on a second low-energy multilayer mirror that will have improved performance and will fly on the next flight. Future flights are planned to include the high-energy mirrors for 44Ti studies of supernovae remnants. Each of these planned future flights will use an improved CZT detector based on the knowledge we have gained with the SWIN detector and incorporating the changes mentioned above.
ACKNOWLEDGMENTS
We would like to thank the NSBF flight crew for all their help and for a successful flight. We would also like to especially thank Chris Miller, Steve Derdeyn, Kiran Patel, Steve Snodgrass, Holly Hancock and all the dedicated Goddard engineers and technicians whose hard work and countless extra hours made InFOCS possible.
References
- [1] F. Berendse et al., “Production and Performance of the Infocus 20-40 keV Graded Multilayer Mirror,” Applied optics, submitted, 2002.
- [2] Y. Ogasaka et al., “Supermirror hard X-ray telescope and the results of first observation flight of Infocus,” in X-Ray and Gamma-Ray Telescopes and Instruments for Astronomy, J. Truemper, H. Tannanbaum, eds., Proc. SPIE 4851, these proceedings, 2002.
- [3] T. Okajima et al., “Characterization of the supermirror hard X-ray telescope for the Infocus balloon experiment,” Applied optics, in press, 2002.
- [4] S. Owens et al., “Characterization and performance of the Infocus 20-40 keV X-ray focusing mirror,” in X-Ray Optics for Astronomy: Telescopes, Multilayers, Spectrometers, and Missions, P. Gorenstein; R. Hoover, eds., Proc. SPIE 4496, p. 115–126, 2002.
- [5] B. Parker et al., “Correlation between bulk material defects and spectroscopic response in cadmium zinc telluride detectors,” in Hard X-Ray, Gamma-Ray, and Neutron Detector Physics, R. James, R. Schirato, eds., Proc. SPIE 3768, p. 129–137, 1999.
- [6] B. Parker et al., “Effect of twin boundaries on the spectroscopic performance of CdZnTe detectors,” in Hard X-Ray and Gamma-Ray Detector Physics III, R. James ed., Proc. SPIE 4508, p. 68–78, 2001.
- [7] S. Dobereiner et al., “HEXE Observations of Cygnus X-1,” Astronomy and Astrophysics 302, p. 115, 1995.
- [8] R. Rothschild et al., “Actively shielded CZT focal plane detectors for the Fine Angular Resolution X-ray Imaging Telescope (FAR_XITE),” in EUV, X-Ray, and Gamma-Ray Instrumentation for Astronomy X, O. Siegmund, K. Flanagan, eds., Proc. SPIE 3765, p. 360–367, 1999.
- [9] K. Slavis et al., “High-altitude balloon flight of CdZnTe detectors for high-energy x-ray astronomy: II,”in EUV, X-Ray, and Gamma-Ray Instrumentation for Astronomy X, O. Siegmund, K. Flanagan, eds., Proc. SPIE 3765, p. 397–406, 1999.
- [10] T. Takahashi et al., “High-resolution CdTe detector and applications to imaging devices,” in IEEE Transactions on Nuclear Science 48, no. 3, p. 287, 2001.
- [11] D. A. Marks. Ph.D. thesis. University of Arizona, 2000.
- [12] F. Harrison et al., “Development of the High-Energy Focusing Telescope (HEFT) balloon experiment,” in X-ray Optics, Instruments, and Missions III, J. Truemper, B. Aschenbach, eds., Proc. SPIE 4012, p. 693, 2000.
- [13] P. Bloser et al., “Balloon flight background measurement with actively-shielded planar and imaging CZT detectors,” in X-Ray and Gamma-Ray Instrumentation for Astronomy XII, K. Flanagan, O. Siegmund; eds., Proc. SPIE 4497, p. 88, 2002.