Near-IR line-strengths in elliptical galaxies: evidence for IMF variations?
Abstract
We present new relations between recently defined line-strength indices in the near-IR (CaT∗, CaT, PaT, MgI, and sTiO) and central velocity dispersion () for a sample of 35 early-type galaxies, showing evidence for significant anti-correlations between Ca ii triplet indices (CaT∗ and CaT) and . These relations are interpreted in the light of our recent evolutionary synthesis model predictions, suggesting the existence of important Ca underabundances with respect to Fe and/or an increase of the dwarf to giant stars ratio along the mass sequence of elliptical galaxies.
keywords:
galaxies: elliptical and lenticular – galaxies: stellar content1 Introduction
During the last decade, the measurement and interpretation of blue optical line-strength indices in the spectra of early-type galaxies in the field have revealed the existence of an apparent spread of mean ages (González 1993; Faber et al. 1995; Jørgensen 1999) and element abundances ratios (Worthey 1998; Trager et al. 2000a), suggesting a variety of interpretations of scaling relations like the colour–magnitude or Mg2– relations (Bender, Burstein & Faber 1993; Kuntschner 2000; Trager et al. 2000b; Vazdekis et al. 2001). Since the picture from the blue is rather confused, if one wants to achieve a more complete understanding of the star formation history of these galaxies, it is necessary to look at other spectral regions in which the relative contribution of the distinct stellar types is very different. In this sense, the potential of the near-IR spectral range and, in particular, of the Ca ii triplet is still almost unexploited.
Since Ca is an -element like Mg, it should be enhanced compared to Fe in giant ellipticals (Es). However, as suggested by several authors, Ca seems to follow Fe (O’Connell 1976; Vazdekis et al. 1997; Worthey 1998; Mollá & García-Vargas 2000; Vazdekis et al. 2001; Proctor & Sansom 2002). Even so, given that variations of the Fe line-strengths among Es are not negligible (e.g. Gorgas, Efstathiou & Aragón-Salamanca 1990; González 1993; Davies, Sadler & Peletier 1993; Kuntschner 2000), one should not expect the small variation of the Ca ii triplet strength reported by previous work (Cohen 1979; Bica & Alloin 1987; Terlevich et al 1990; Houdashelt 1995). Furthermore, this result is difficult to interpret in the light of previous stellar population models (García-Vargas et al. 1998; Schiavon et al. 2000) which predict a high sensitivity of the Ca ii triplet to the metallicity of old, metal-rich stellar populations. Also, the absolute values of Ca ii in Es differ from the model predictions (Peletier et al. 1999; Mollá & García-Vargas 2000).
With the aim of clarifying the above inconsistencies, during the last years we have developed a new stellar library in the near-IR spectral range (Cenarro et al. 2001a, hereafter CEN01) with a homogeneous set of revised atmospheric parameters for the library stars (Cenarro et al. 2001b), deriving empirical fitting functions that describe the behaviour of new line-strength indices for the Ca ii triplet and the H Paschen series (CEN01; Cenarro et al. 2002) and other spectral features (Cenarro 2002, hereafter CEN02). Finally, in Vazdekis et al. (2002; hereafter VAZ02) we present a new evolutionary stellar population synthesis model which predicts both the integrated indices and the spectral energy distribution for single stellar populations (SSPs) of several ages, metallicities and initial mass functions (IMFs).
In this letter we present the first results for a spectroscopic sample of 35 early-type galaxies. After a brief description of observations and data reduction (Section 2), in Section 3 we describe the measurements of the new indices for the central regions of the galaxies and their relationship with the velocity dispersion. In Section 4 we discuss plausible interpretations of the data on the basis of new index–index diagrams derived from our model predictions.
2 Observations and data reduction
Our sample consists of 35 early-type galaxies (E – S0) spanning a wide range of absolute magnitudes ( mag, using H km s-1 Mpc-1) and central velocity dispersions ( km s-1). Most of them are field Es, although a few galaxies from Virgo (9) and one cD in the Coma cluster are also included.
Long-slit spectroscopy was carried out during three nights in 1999 using ISIS at the 4.2 m William Herschel Telescope (Observatorio del Roque de los Muchachos, La Palma), providing 2.9 Å (FWHM) spectral resolution in the red arm (8355 – 9164 Å). The slit (2 arcsec width) was aligned with the major axis except for two S0s (along the minor axis). Exposure times of 1200 – 2000 s per galaxy allowed us to obtain signal-to-noise ratios per angstrom from 43 to 253 Å-1 in the central spectra. We followed a typical spectroscopic reduction procedure with REDucm E (Cardiel 1999, see also CEN01), taking special care on the sky subtraction and the correction for fringing and telluric absorptions. The availability of error spectra for each galaxy frame allowed us to estimate reliable uncertainties in the measurements of the indices. The spectra were relative-flux calibrated using 4 spectro-photometric standard stars (Oke 1990) observed several times at different air masses. Also, in order to correct for small differences between the spectro-photometric systems of the galaxies and the model predictions, a sample of 49 stars (from B to late M spectral types) in common with CEN01 were observed during twilights. They were also employed as templates for velocity dispersion determinations.
3 Index– relations
In this section we present the behaviour of new line-strength indices in the near-IR spectral region (CaT*, CaT, PaT, sTiO and MgI) as a function of the central velocity dispersion () of the galaxy sample.
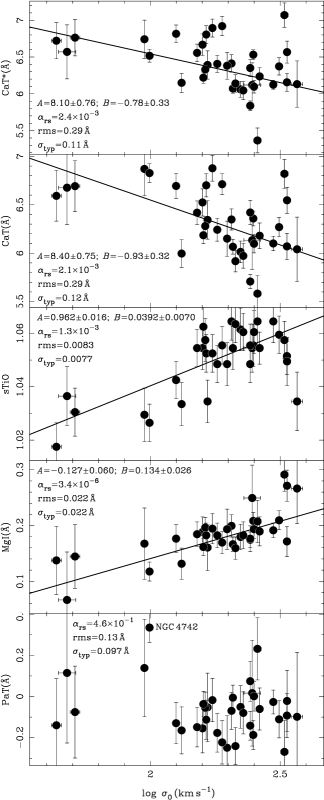
CaT and PaT measure the strength of the Ca ii triplet ( Å) and three lines of the H Paschen series. CaT∗ ( CaT – 0.93 PaT) is an index corrected for the contamination by the Paschen series in stars of the earliest spectral types (see CEN01 for full details about their definitions). The sTiO index is a measurement of the slope of the continuum at the Ca ii region. It is mainly governed by TiO absorption bands which are prominent in mid-late M types and observed in the integrated spectra of early-type galaxies. Following CEN02, it is computed as the ratio between the CaT* pseudo-continuum values () at the central wavelength of its reddest and bluest continuum bands, that is, sTiO . Finally, MgI measures the strength of the Mg i line at Å (Cenarro et al. 2001c; CEN02).
Central velocity dispersions for the galaxies were determined using the MOVEL and OPTEMA algorithms (described in González 1993) as explained in Pedraz et al. (2002). In each case, the template that was used was obtained as the mixture of 6 different spectral types (G5 V, G7 V, K0 III, K2 III, M3 III and M5 III) which minimizes intrinsic differences with the galaxy spectra. In order to avoid systematic differences between indices at diferent spectral resolutions, all the spectra were broadened up to the largest of the galaxy sample ( km s-1). The measured indices correspond to a central aperture of radius /8 (or 1 arcsec for galaxies with arcsec) and were corrected to the system defined by the models. See http://www.ucm.es/info/Astrof/ellipt/CATRIPLET.html for a database with the indices and velocity dispersions.
Figure 1 shows the obtained relations of the indices and the central velocity dispersions of the galaxies. Although, at first sight, the two Ca ii triplet indices do not follow a neat linear behaviour with , the significance levels of Spearman rank-order tests (see the labels) show that negative trends with velocity dipersion are significant. This result is highly surprising since it is the first evidence for an anti-correlation between a metal-line index and the velocity dispersion. Note that classical metallicity indicators in the blue spectral range increase with (e.g. Mg2, Fe). In any case, it is worth noting that the spread of CaT∗ and CaT values is only per cent of the mean values. Probably, this is the reason why previous works did not find significant variations of the Ca ii triplet in their galaxy samples. For the sTiO and MgI indices we find clear increasing trends with , whereas we do not detect any significant trend for the PaT index. Only NGC 4742 significantly departs from the mean PaT value, revealing a central young stellar population in agreement with other determinations in the optical (Gorgas et al. 1990; Trager 1997).
Although a linear fit is representative of the general behaviour as a whole, different trends with velocity dispersion are apparent. While the indices CaT∗, CaT and sTiO of low mass Es () are roughly independent of , galaxies with depart from the above trend showing lower (CaT∗ and CaT) and larger (sTiO) values. Also, some of the most massive Es () significantly deviate from the fit attaining the typical indices values of low mass Es.
4 Interpretation and discussion
To analyse the previous relations we make use of our SSP model predictions (VAZ02; CEN02), which were transformed to the spectral resolution of the data (370 km s-1) using specific polynomials corresponding to their own age, metallicity and IMF (see VAZ02).
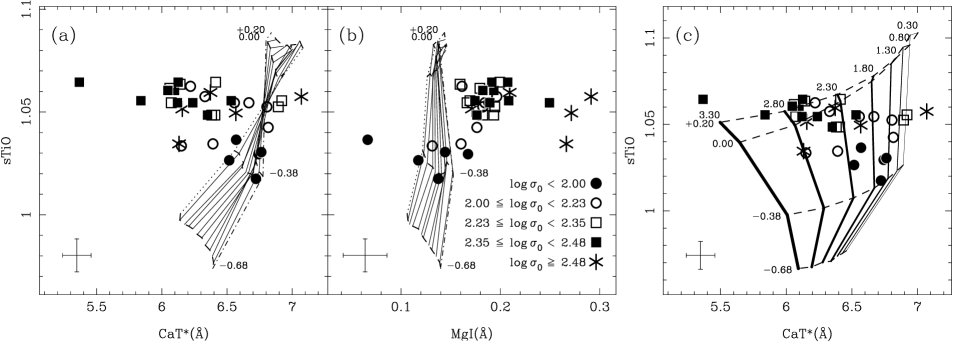
Given that the time evolution of the near-IR indices is virtually null for SSPs of all metallicities and ages Gyr (VAZ02, CEN02), we can consider that the age has a negligible effect in this spectral range. Figure 2 shows the distribution of the galaxy sample in the CaT∗–sTiO and MgI–sTiO planes, with symbols indicating different ranges of . The insensitivity of the indices to age is apparent in Figs. 2a,b. From Fig. 2a, one immediately can notice that, while low-mass Es (filled circles) can be roughly fitted by with SSPs of metallicity below solar ( dex), no age-metallicity combination can account for the low CaT∗ values of massive Es (filled squares). The spread and location of the most massive Es (asterisks) will be further discussed. Moreover, typical random errors in CaT∗ are not able to explain the spread among Es, suggesting that other parameters must be taken into account to explain the observed trend. In this sense, we consider the existence of i) non-solar abundance ratios (hereafter NSAR), and/or ii) systematic variations of the IMF, as possible solutions to the above inconsistency.
NSAR could play an important role to interpret Fig. 2a. In fact, the high MgI values in massive Es (Fig. 2b) confirm the behaviour found for Mg in the optical. In this scenario, the position of massive Es in Fig. 2a implies that Ca should be underabundant in these galaxies, as was already suggested by e.g. Vazdekis et al. (1997) using the Ca4227 Lick/IDS index. As discussed in VAZ02, the use of -enhanced scaled-solar isochrones (Salasnich et al. 2000) predicts even larger CaT∗ values (by Å) for metal rich, old SSPs. Therefore, given that overabundances of other -elements exist, and the contribution of Ca to the total metallicity is lower than 0.5 percent, massive Es should have extremely low abundances of Ca to account for the observed values. Isochrones with accurate degrees of enhancement for the different -elements as well as stellar spectral libraries with appropriate element ratios are indeed necessary to tackle with the above problem.
Could it be that massive Es are much more metal rich than the models, i.e., much more than two times solar metallicity? In this case, the shift of the red giant branch to lower temperatures would predict a significant decrease in the CaT∗ and CaT values. However, one would expect then sTiO values much larger than those observed (and also higher Fe values in the optical), but the measured indices are in reasonable agreement with the current model predictions.
The alternative to interpret the data on the basis of the current model predictions is to assume that the IMF may be varying among Es. Since age can be considered a secondary parameter, in Fig. 2c we plot the SSPs model predictions for 17.78 Gyr (a different age does not qualitatively alter the final conclusions) and different IMF slopes and metallicities. In this new scenario, the data can be interpreted by means of IMF slope and metallicity variations, suggesting that low-mass Es (filled circles) exhibit lower metallicities and lower IMF slopes (lower dwarf/giants ratio) than massive Es (filled squares). In the light of this interpretation, reading and [Fe/H] values from the grid in Fig. 2c allows us to fit a one-parameter relation between , [Fe/H] and for Es in the sense that, the larger , the larger the metallicity and the IMF slope (Figure 3). Note, however, that very massive Es (asterisks) deviate from the above relation exhibiting lower metallicities and slightly flatter IMFs. To guide the eye, solid lines represent simple polynomial fits to the data on the –[Fe/H] and [Fe/H]– planes, whilst the relation in the – plane is readily derived from the two previous ones. Using Monte-Carlo simulations (following a procedure similar to that of Kuntschner et al. 2001), we have checked that this relation is not driven by a combined effect of Poisson noise and non-orthogonal diagnostic diagrams, thus concluding that Es can indeed be explained using –[Fe/H]– curves.

Although the universality of the IMF is a highly controversial question (see e.g. Eisenhauer 2001 for a review), there are theoretical arguments suggesting that the IMF of metal-rich star-forming regions must be biased towards low mass stars due to a more efficient cooling rate (e.g. Larson 1998). On this base, the universal IMF by Padoan et al. (1997) –which depends on the physical conditions of the star formation site– predicts such a behaviour. The observational –[Fe/H] trend of Fig. 3c qualitatively agrees with these theoretical arguments, but it still needs to be related with the galactic mass (or ). A time-extended (non-instantaneous) star formation history or several star-forming episodes could drive such a relation. If mergers and accretion of other galaxies with pre-enriched gas have been frequent phenomena during the evolution of massive Es, subsequent star formation episodes should increase the metallicity and, as a consequence, the IMF would gradually tend to produce a larger relative number of low mass stars. In this case, the infall of non-primordial, previously enriched, gas is needed to ensure the increasing metallicity. Although an extended star formation could be enough to explain the increasing metallicity, the addition of dissipative hierarchical scenarios would emphasize such a behaviour.
This interpretation implicitly characterizes the IMF as a time-dependent function (it gets steeper with time) in agreement with several previous work (e.g. Larson 1998), suggesting that the IMF in the early Universe could be biased towards very massive stars. A prompt initial enrichment –straight consequence of a time-dependent IMF– could account for the observed -enhancements (Vazdekis et al. 1996). This could also explain several keys like the G-dwarf problem, the scarcity of Population III stars, and the high abundance of heavy elements in the intergalactic medium of clusters of galaxies (Larson 1998). In addition, the existence of a –[Fe/H]– relation would also have important consequences for the interpretation of the blue spectra of Es. In particular, the Fe–, H–, and the mass–luminosity (in band) relations could only be reconciled by introducing an age sequence in the sense that the larger the lower the mean age in the central parts (CEN02). Another problem could be visual-infrared colors. For example, for a model with , [Fe/H] and 12.6 Gyr one expects (Blakeslee et al. 2001). This is just at the edge of the range of observational values for Es (e.g., for Es in Frogel et al. 1978). However, and again, a younger mean age for the central regions would help to match the observed values ( for a model with , [Fe/H] and 5.01 Gyr).
The interpretation with a varying IMF actually revisits the classic debate about the existence of a dwarf-enriched population in the nuclei of Es, based on the strengths of the near-IR Na i doublet, the Ca ii triplet and the FeH Wing-Ford band (Cohen 1978; Faber & French 1980; Carter et al. 1986; Alloin & Bica 1989; Couture & Hardy 1993). In particular, the weakness of the FeH band was used as an argument against this possibility. Since these results are mainly based on rather limited empirical synthesis models, they are not strong enough to directly exclude the possibility of a dwarf-heavy IMF. A proper calibration of its sensitivity to the stellar parameters (in particular to metallicity; see Carter et al. 1986) and its inclusion in modern stellar population models must be performed before extracting any conclusion. In any case, since several model uncertainties affect the absolute scale of the predicted index strengths (by 0.5 Å in the case of CaT∗; see VAZ02), the derived –[Fe/H]– relation must be considered on a relative basis.
Finally, we speculate on the very massive Es labelled with asterisks in Figs. 2 and 3. Whereas all (except one) are boxy Es, with slow rotation and resolved cores, the rest of the sample are mostly disky Es, fast rotators with power-law cores. According to Faber et al. (1997), disky Es are consistent with their formation in gas-rich mergers, whereas boxy Es could be the by-products of gas-free stellar mergers. In the context of our interpretation, this suggests that boxy Es should exhibit lower metallicities (and, therefore, lower sTiO values) at the time that keep a more primordial, flatter slope IMF than disky Es (thus leading to larger values of CaT∗ and CaT), in agreement with what we observe in Figs. 1 and 3. Also, the fact that boxy Es seem to be older than disky Es (de Jong & Davies 1997; Ryden, Forbes & Terlevich 2001) favours the last interpretation.
We want to note that, at the time of submission of this letter, Saglia et al. (2002) presented similar anti-correlations between Ca ii indices and the velocity dispersion, using another large sample of high-quality spectra. Another paper by Falcón-Barroso et al. (2003) has been submitted with such anti-correlations for bulges of spiral galaxies.
To conclude, more work in the areas of SN yields, stellar interior models and stellar libraries is needed to clarify whether it is possible to explain the current discrepancy between Ca ii measurements and models using non-solar abundance ratios. Until this is accomplished, and in the light of the present models, the only way out is to advocate for variations in the IMF. By no means we think that we are presenting strong evidence against its universality. Furthermore, the scenario of a time-dependent IMF poses difficulties to explain other observables. More modern, careful work using indicators in the near-IR and the optical is needed to resolve the issue of a non-standard IMF.
ACKNOWLEDGMENTS
We are indebted to the anonymous referee for very useful suggestions. This work was supported by the Spanish research project No. AYA2000-977
References
- [] Alloin D., Bica E., 1989, A&A 217, 57
- [] Bender R., Burstein D., Faber S.M., 1993, ApJ, 411, 153
- [] Bica E., Alloin D., 1987, A&A, 186, 49
- [] Blakeslee J.P., Vazdekis A., Ajhar E.A., 2001, MNRAS, 320, 193
- [] Bower R.G., Lucey J.R., Ellis R.S., 1992, MNRAS, 254, 601
- [] Cardiel N., 1999, PhD thesis, Universidad Complutense, Madrid
- [] Carter D., Visvanathan N., Pickles A.J., 1986, ApJ, 311, 637
- [] Cenarro A.J., 2002, PhD thesis, Universidad Complutense, Madrid (CEN02)
- [] Cenarro A.J., Gorgas J., Cardiel N., Vazdekis A., Peletier R.F., 2002, MNRAS, 329, 863
- [] Cenarro A.J., Cardiel N., Gorgas J., Peletier R.F., Vazdekis A., Prada F., 2001a, MNRAS, 326, 959 (CEN01)
- [] Cenarro A.J., Gorgas J., Cardiel N., Pedraz S., Peletier R.F., Vazdekis A., 2001b, MNRAS, 326, 981
- [] Cenarro A.J., Gorgas J., Cardiel N., Vazdekis A., Peletier R.F., 2001c, in Highlights of Spanish Astrophysics II, Zamorano J., Gorgas J. and Gallego J., eds., Dordrecht: Kluwer Academic Publishers, p. 365
- [] Cohen J.G., 1978, ApJ, 221, 788
- [] Cohen J.G., 1979, ApJ, 228, 405
- [] Couture J., Hardy E., 1993, ApJ, 406, 142
- [] de Jong R.S., Davies R.L., 1997, MNRAS, 285, L1
- [] Davies R.L., Sadler E.M., Peletier R.F., 1993, MNRAS, 262, 650
- [] Eisenhauer F., 2001, in L. Tacconi & D. Lutz (eds.), “Starburst Galaxies: Near and Far”. Heidelberg: Springer-Verlag, p. 24
- [] Faber S.M., French H.B., 1980, ApJ, 235, 405
- [] Faber S.M. et al., 1997, AJ, 114, 1771
- [] Faber S.M., Trager S.C., González J.J., Worthey G., 1995, in van der Kruit P.C., Gilmore G., eds., Proc. IAU Symp. 164, Stellar Populations. Kluwer, Dordrecht, p. 249
- [] Frogel J.A., Persson S.E., Matthews K., Aaronson M., 1978, ApJ, 220, 75
- [] García Vargas M.L., Mollá M., Bressan A., 1998, A&AS, 130, 513
- [] González J.J., 1993, PhD thesis, University of California, Santa Cruz
- [] Gorgas J., Efstathiou G., Aragón-Salamanca A., 1990, MNRAS, 245, 217
- [] Houdashelt M.L., 1995, Ph.D. thesis, The Ohio State University
- [] Jørgensen I., 1999, MNRAS, 306, 607
- [] Kuntschner H., 2000, MNRAS, 315, 184
- [] Kuntschner H., Lucey J.R., Smith R.J., Hudson M.J., Davies R.L., 2001, MNRAS, 323, 615
- [] Larson R.B., 1998, MNRAS, 301, 569
- [] Mollá M., García–Vargas M.L., 2000, A&A, 359, 18
- [] O’Connell R.W., 1976, ApJ, 206, 370
- [] Oke J.B., 1990, AJ, 99, 1621
- [] Padoan P., Nordlund Å., Jones B.J.T., 1997, MNRAS, 288, 145
- [] Pedraz S., Gorgas J., Cardiel N., Sánchez-Blázquez P., Guzmán R., 2002, MNRAS, 332, L59
- [] Peletier R.F., Vazdekis A., Arribas S., del Burgo C., García–Lorenzo B., Gutiérrez C., Mediavilla E., Prada F., 1999, MNRAS, 310, 863
- [] Proctor R.N., Sansom A.E., 2002 MNRAS, 333, 517
- [] Ryden B.S., Forbes D.A., Terlevich A.I., 2001, MNRAS, 326, 1141
- [] Saglia R.P., Maraston C,. Thomas D., Bender R., 2002, ApJ, 579, L13
- [] Salasnich B., Girardi L., Weiss A., Chiosi C., 2000, A&A 361, 1023
- [] Schiavon R.P., Barbuy B., Bruzual G., 2000, ApJ, 532, 453
- [] Terlevich E., Díaz A.I., Terlevich R., 1990, MNRAS, 242, 271
- [] Trager S.C., 1997, Ph.D. thesis, University of California, Santa Cruz
- [] Trager S.C., Faber S.M., Worthey G., González J.J., 2000a, AJ, 119, 1645
- [] Trager S.C., Faber S.M., Worthey G., González J.J., 2000b, AJ, 120, 1651
- [] Vazdekis A., Cenarro A.J,. Gorgas J., Cardiel N., Peletier R.F., 2002, MNRAS, submitted
- [] Vazdekis A., Kuntschner H., Davies R.L., Arimoto N., Nakamura O., Peletier R.F., 2001, ApJ, 551, L127
- [] Vazdekis A., Peletier R.F., Beckman J.E., Casuso E., 1997, ApJS, 111, 203
- [] Vazdekis A., Casuso E., Peletier R.F., Beckman J.E., 1996, ApJS, 106, 307
- [] Worthey G., 1998, PASP, 110, 888