11email: kramer@ph1.uni-koeln.de, bhaswati@ph1.uni-koeln.de 22institutetext: Mullard Radio Astronomy Observatory, Cavendish Laboratory, Madingley Road, Cambridge CB3 0HE, England
22email: jsr@mrao.cam.ac.uk 33institutetext: European Southern Observatory, Karl-Schwarzschild-Strasse 2, 85748 Garching, Germany
33email: jalves@eso.org 44institutetext: Harvard-Smithsonian Center for Astrophysics, 60 Garden Street, Cambridge, MA 02138, USA
44email: clada@cfa.harvard.edu
Dust properties of the dark cloud IC 5146
We present the results of a submillimeter dust continuum study of a molecular ridge in IC 5146 carried out at 850 m and 450 m with SCUBA on the James Clerk Maxell Telescope (JCMT). The mapped region is in size ( pc0.3 pc) and consists of at least four dense cores which are likely to be prestellar in nature. To study the dust properties of the ridge and its embedded cores, we combined the dust emission data with dust extinction data obtained by Lada et al. (1999) from the NIR colors of background giant stars. The ridge shows dust extinctions above mag, rising up to 35 mag in the cores.
A map of dust temperatures, constructed from the continuum flux ratios, shows significant temperature gradients: we find temperatures of up to K in the outskirts and between the cores, and down to 10 K in the cores themselves. The cores themselves are almost isothermal, although their average temperatures vary between 10 K and 18 K. We used the extinction data to derive in addition a map of the dust emissivity parametrized by . The average value of agrees well with the canonical value of Mathis (1990). We find that increases by a factor of from to when the dust temperature decreases from K to K. A Monte Carlo simulation shows that this change is significant with regard to the estimated calibration uncertainties. This is consistent with models of dust evolution in prestellar cores by Ossenkopf & Henning (1994) which predict that grain coagulation and the formation of ices on grain surfaces in the cold, dense cloud interiors lead to a significant increase of the m dust opacity. This interpretation is furthermore supported by the previous detection of gas-phase depletion of CO in one of the IC 5146 cores (Kramer et al. 1999). Observations of dust fluxes at short wavelengths are however needed to verify this result.
Key Words.:
ISM: clouds - ISM: dust, extinction - ISM: evolution - ISM: structure - ISM: individual objects: IC 51461 Introduction
Dense, cold cores embedded in molecular clouds are the progenitors of protostellar cores which subsequently form low mass stars. Many observational studies have recently focused on the determination of the physical properties of these pre-protostellar or prestellar cores. This is because the initial conditions just before the collapse phase determine the properties of the protostar. There is consequently considerable interest in measuring their masses and thermal balance. Since cold molecular hydrogen cannot be detected in emission, trace constituents of the cloud have to be studied, requiring knowledge of their abundances. Two approaches have generally been used. The first is via the low- rotational emission lines of a rare CO isotopomer. The major difficulty with this technique is that CO can freeze out onto cold dust grains in the interiors of the prestellar cores thus changing significantly the CO gas-phase abundance from its canonical value of (e.g. Bergin et al. 2002; Tafalla et al. 2002; Caselli et al. 1999; Kramer et al. 1999) and also thus changing the thermal balance of the cores (Goldsmith 2001).
Since dust is by far the most important coolant and constitutes about 1% of the total mass, measuring the dust emission has proved popular as another method. The recent advent of large, sensitive bolometer arrays on millimeter and submillimeter telescopes now makes it possible to measure the weak continuum emission even from cool clouds showing no signs of star formation. The surface regions of prestellar cores are heated by the weak interstellar radiation field (ISRF) while cosmic rays penetrate easily even the densest cores. The cores therefore exhibit a small temperature gradient between the cold core interiors and the warmer surfaces. This argument was quantified by early radiation transport models (e.g. Leung 1975) and refined by recent calculations (e.g. Zucconi et al. 2001; Evans et al. 2001). These models show the dependence of the gradient on, for example, the grain material and on the core geometry. A comparison with observed fluxes should therefore allow to discriminate between these factors. Recent observations have indeed shown that many prestellar cores exhibit a temperature gradient while others appear to be isothermal (e.g. Ward-Thompson et al. 2002).
Another difficulty is that the grain opacity at submillimeter wavelengths is poorly known and may vary due to grain evolution in the dense, cold core interiors. At wavelengths longer than about 250 m, the wavelength dependence of the emissivity is customarily parametrized by a power-law function: . The dust properties are thus characterized by two parameters, the emissivity exponent and the opacity at a given wavelength . In general, the opacity may not even follow a power strict law, and so would require more than two parameters to describe it; given the lack of accurate multi-frequency submillimeter data we do not consider more complex models in this paper. The dust coagulation model of Ossenkopf & Henning (1994, OH94 hence on) shows that the formation of dirty ice mantles and grain coagulation increase the opacity at long wavelengths (cf. Pollack et al. 1994; Stognienko et al. 1995; Henning et al. 1995).
Some studies use the spectral energy distribution in the FIR and submm regime to disentangle dust temperature and opacity (e.g. Ward-Thompson et al. 2002). These observations indicate a constant spectral index of .
Here, we try to tackle this task by combining optical extinction data, obtained via NIR observations of background stars obtained by Lada et al. (1999), with deep dust emission maps at 450 and 850 m, obtained with the SCUBA bolometer on the JCMT. There are two key strengths of this technique. First, the submillimeter flux ratios in themselves are an excellent temperature diagnostic in cold gas, if the dust index is nearly constant, because the Raleigh-Jeans corrections are large at these frequencies ( K at 450 m). Second, the optical extinctions are an accurate tracer of dust column densities independent of the dust temperature. Combining the three data sets therefore allows us to determine at each position the dust temperature and the grain opacity, averaged along the line of sight.
We observed an area of 2 pc0.33 pc of a filamentary cloud in the IC 5146 complex which consists of several dense starless condensations. This study thus covers a much larger region than the previous work of Kramer et al. (1998, 1999, Paper I and II henceforth) who studied one core of the IC 5146 filament.

2 Observations and data reduction
2.1 SCUBA data
We used the Submillimeter Common User Bolometer Array (SCUBA, Holland et al. 1999) on the James Clerk Maxwell Telescope (JCMT111The JCMT is operated by the JAC, Hawaii, on behalf of the UK PPARC, the Netherlands OSR, and the Canadian NRC.) to map IC 5146. On September, 13th and 15th, 2000, we observed a region simultaneously at 850 m and 450 m. The SCUBA array covers a hexagonal field of view of with 91 and 37 pixels at 450 and 850 m respectively. To create fully-sampled maps, the ‘jiggle’ mode was used, in which the telescope beam is moved in a 64-position pattern by the secondary mirror, spending 1 s at each sample point while simultaneously chopping at 7.8 Hz to remove atmospheric emission. Since the filament is elongated in right ascension and smaller than about in declination, we chopped in declination using the maximum throw of .
Pointing, focus, and calibration checks were done on NGC 7027 and Uranus at regular intervals. The zenith opacity was derived from simultaneous skydips at 850 and 450 m. It stayed almost constant at and during the first and second night respectively, with a repeatability being better than 3% at 850 m. The half power beamwidths were measured on Uranus to be at 850 m and at 450 m. The main beam is almost Gaussian at 850 m. At m the main beam efficiency is %, with the remaining power forming an error beam around the main beam roughly in size.


We reduced the data primarily using the SCUBA User Reduction Facility (SURF; Jenness & Lightfoot (1998); Jenness et al. (2002)) in the standard way. The data were corrected for individual bolometer gains (i.e. flat-fielded), for atmospheric extinction and correlated sky noise, and regridded and calibrated to yield the final images in Jy beam-1. To improve the image quality, we deconvolved both maps using our own CLEAN algorithm to deconvolve the triple beam response of the observations: this final step made only small changes to the maps because there is little emission extended by more than 150 arcsec in declination. At 450 m, our beam model is composed of three symmetric Gaussians similar to the model fitted by Hogerheijde & Sandell (2000). We restored the cleaned images back to the original resolutions. Next, we smoothed the images to resolution using a Gaussian convolving kernel. And we resampled the data onto a common grid with spacing. This allows for a pixel-by-pixel comparison of the m and m maps with the data at the same resolution and grid.
2.2 Sources of errors
The most important source of statistical error comes from fluctuations in the atmospheric opacity. At m, there are also possible errors from changes in dish shape and thus in the beam pattern as the dish temperature changes, and errors when deconvolving the error beam. Finally, the absolute flux scales at 850 and 450 m are derived from the flux of Uranus, and these are uncertain to % (Sandell 1994). Since this error is entirely systematic, it cannot account for any point to point variations in cloud properties, only stretching monotonically the derived temperature or scales.
Uncertainties in the 450 m maps due to the error beam should be small, because the CLEAN deconvolution included the error beam pattern and because we are only interested in data at resolution, which includes most of the power in the error beam. In addition, most of the data were taken in cool nighttime conditions when the dish temperature is stable.
The best estimate of the fluctuations in atmospheric transmission are probably the opacities at 225 GHz measured at the CSO every ten minutes using a tipping radiometer (Archibald et al. 2000). These opacities varied very smoothly and by small amounts, indicating very stable atmospheric conditions during our observations. We applied the opacities at 850m measured via SCUBA skydips to the data. The scatter of these opacities, scaled to 225 GHz (Archibald et al. 2002) relative to the fitted opacities is less than % during the 11 hours of the two night observations. At the average CSO-zenith opacity of 0.055 and typical airmass of 1.56, this translates into a calibration uncertainty of % at 450m. Temporal variations in opacity are expected to be slow, of the order of 10 minutes, so the error on close by parts of the maps will be much smaller.
We thus estimate that the calibration error of the flux density ratio , observed simultaneously through the same atmosphere, is % and for the ratio since the latter is dominated by the error of the flux density. In fact, the resulting dust temperatures of between 10 and 20 K and their small scatter (Figs. 4, 5) also indicate that errors cannot be much larger.
2.3 NIR data
The NIR observations of IC 5146 are described in Lada et al. (1999, 1994). The determined color excess is proportional to dust column density. Following convention, the dust column density is represented in terms of optical extinctions by converting the color excess at each position to the optical extinction using the normal reddening law: (Rieke & Lebofsky 1985) with the ratio of total to selective extinction . Although the resulting map accurately reflects the distribution of dust column density and mass, it may not accurately predict the true visual extinction through the cloud. This is because grain growth in cold clouds can alter the reddening law at wavelength m (e.g. Fig.2 in Mathis 1990). Conversion to near-infrared extinctions (e.g. ) would avoid this problem. In this paper, like in Papers I and II, we stick to and therefore compare the dust absorption in IC 5146 to the absorption in the NIR of general interstellar grains rather than to the actual value of of grains in IC 5146.
3 Properties of the dust
3.1 Maps
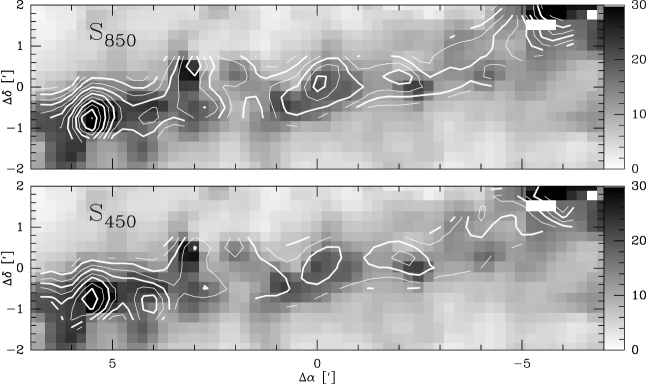
The IC 5146 complex of molecular clouds lies in Cygnus at a distance of 460 pc (Lada et al. 1999). The part we analyzed is called Northern Streamer (Dobashi et al. 1992, 1993) for its filamentary appearance which is strikingly visible in the map of optical extinctions of Lada et al. (1999). We mapped at and m the inner part of the ridge above about 10 mag of optical extinction covering an area of about pcpc. The resulting maps of flux densities are shown in Fig. 1 at a resolution of 0.04 pc (). The filament has a clumpy appearance. About nine cores are discernible at both wavelengths. Most prominent is the bright clump at the eastern edge of the mapped region near (,). Many clumps appear much more distinct at 850m than at 450m, which is probably an indication that the dust is cold, with the Rayleigh-Jeans correction suppressing the 450 m emission. This holds for example for the center core near (,). There are exceptions. For example the clump near (,) is much more distinct at 450m than at 850m which probably indicates a much higher fraction of warm dust.
In Fig. 2 we show the same data set, but smoothed to a common resolution of 0.067 pc () in comparison with the optical extinctions at that resolution. Currently, the number of detected background stars does not allow to create an map of still higher spatial resolution. At least four cores show up at all three wavelengths reaching peak extinctions between 20 and 35 mag. An exception is the core near (,) which exhibits a peak in extinctions of 28 mag, while it does not show maxima in dust emission. Almost no background stars are found near this position (see Fig. 1 in Kramer (1999)) but only one strongly reddened star. This indicates high extinctions, but the position of the AV maximum may be shifted.
The mapped region shows no signs of star-forming activity. Two protostellar cores associated with CO outflows and IRAS point sources (Dobashi et al. 1993; Levreault 1983), the FU Ori source El1-12 with a luminosity of 25 L⊙ and another much weaker protostar, lie just outside of the SCUBA maps at offsets (,) and (,). The H ii region S125 and its associated young open cluster IC 5146 lie more than to the east.
3.2 Deriving the distribution of dust properties over the surface of the map
3.2.1 Basic equations
The dust temperature is determined by the ratio of flux densities per beam at m and m which are optically thin up to very high column densities:
| (1) |
At the low temperatures of about 10 K prevalent in dark clouds and at submillimeter wavelengths, deviations from the Rayleigh-Jeans law are highly significant and so this ratio is a strong function of both the dust temperature and the dust emissivity index . To derive the dust temperature distribution over the surface of the cloud, we assume as has generally been found for dust grains in molecular clouds (Ward-Thompson et al. 2002; Johnstone & Bally 1999; Sandell et al. 1999; Huard et al. 1999; Visser et al. 1998; Goldsmith et al. 1997) and is also consistent with theory. A relative error of the flux density ratio of 10% would result in an error of of 1.4 K at 12 K.
Next, we used the observed optical extinctions to derive the distribution of the ratio of absorption and extinction coefficients over the surface of the cloud via:
| (2) |
is the Planck function at m and is the main beam solid angle. This analysis assumes , it may thus miss any variations of , if present. Dust flux densities in the FIR would be needed to analyze the frequency dependence of the dust absorptivity in more detail. However, we do derive variations of . This approach is supported by the dust models of e.g. OH94 which indicate that grain evolution in dense, cold prestellar cores leads to significant changes in but leaves rather constant.
3.2.2 Scatterplots
We use the three data sets , , of the full region at the common resolution of and for each position on a grid. Figure 3a shows a scatterplot of the observed ratios versus . Mean and rms values are (38%) and (24%). The scatter is thus significantly larger than the estimated calibration errors of 10% and 15% respectively. The reason may be variations of dust temperature and/or of the -ratio , assuming that stays constant. Using the data allows to disentangle these two variations. We plot in Fig. 3a lines of constant for dust temperatures in the range 6 to 30 K using eqs. 1 and 2. These lines clearly show that the observed data with its uncertainty is inconsistent with a constant dust temperature and kappa-ratio. High kappa-ratios are found for regions of low dust temperatures. The resulting scatterplot of kappa-ratio versus dust temperature (Fig. 3b) also shows this anti-correlation.
Care has to be taken when interpreting this plot, since the scatter of points is influenced by the calibration errors and also by the interdependency of the two equations used to derive the numbers for and . We therefore conducted a Monte Carlo simulation to create two samples of data shown in Fig. 3c. The rms scatter of these distributions equals the estimated calibration errors. Their mean values lie at the low and high end of the observed data but also well within its scatter (Fig. 3a): , mJy beam-1 mag-1 10%, and , mJy beam-1 mag-1 10%. From these distributions we derived again a scatterplot of and (Fig. 3d). The two selected distributions are significantly different at the level. We thus find a significant drop of dust temperatures from 20 K to about 12 K while the -ratio rises at the same time from to .
3.2.3 Dependence on assumed dust emissivity
The absolute derived values of dust temperature and are dependent on the assumed value , but as long as is constant, it cannot affect the derived point-to-point variations in properties. The same is true if the absolute flux scales are in error. For example, if , the set of curves delineating constant in Fig. 3a is shifted to the left. The resulting temperatures are increased. They range between 12 and K and corresponding values for range between and . The average value lies at , significantly lower than the canonical value. Such high dust temperatures are not expected for the weak interstellar FUV field warming IC 5146 (see next chapter). We thus infer that a dust emissivity index of is the more realistic value. Of course, if the assumed fluxes of Uranus (which set the absolute flux scales) are in error, a different value of may also be fully consistent with the data.
3.2.4 Residual emission at the OFF-positions
The dust emission at the positions of the OFF-beam of the SCUBA jiggle maps may be estimated from the large scale maps of optical extinctions obtained by Lada et al. (1999) and shown in Fig. 2. To improve slightly, we used a recently observed, new NIR map, covering the extended extinction of IC 5146 (unpublished observations by T. Huard, J. Alves, C. Lada). The average optical extinction in the Northern area of the OFF-beam is 3.5 mag, in the Southern area it is 2.8 mag. For a rough estimate of the corresponding dust emission at 850 and 450 m, we used eqs.1, 2, and assumed an average dust temperature of 20 K and -ratio of which is roughly appropriate for the inter-core regions (cf. Fig. 5). The resulting flux densities are 8 mJy beam-1 at 850 m and 61 mJy beam-1 at 450 m corresponding to about 6% of the peak emission at both wavelengths.
The resulting error may be higher in the outskirts of the cores, where dust emission is rather low and thus the relative contribution of off-source emission may be high. This is e.g. the case at position between cores #2 and #3, where flux densities drop to mJy beam-1 and mJy beam-1. The resulting dust temperature and -ratio at this position are 18.4 K and . The average off-source contamination is % of the measured flux densities at both frequencies when using the above rough estimate of the OFF-source flux densities. However, the ratio is largely unaffected and thus is the dust temperature determination.
We did not correct for this error which leads to a slight but systematic underestimate of fluxes.
3.2.5 Maps of and
The resulting maps of and are shown in Fig. 4. Dust temperatures are low and lie between and 20 K for the bulk of the filament. Still higher temperatures are reached at a few positions at the edges of the ridge but are probably insignificant as discussed above. The average and rms are K. In the center region, dust temperatures are low at about 10 K and there is only little variation. To the east of the center, the map of dust temperatures shows vertical stripes: temperatures are low at the positions of clumps #3 and #2, while the temperature rises to above K in the interclump regions and at the eastern edge of clump #2. The western part of the map is less well characterized.
3.2.6 Discussion
Our finding is consistent with and being constant, while the absorption coefficient is rising with dropping temperatures.
The colder regions are in general associated with regions of high column densities as is seen in the map of (Fig. 4) and in the radial profiles of the four cores discussed in the next chapter (Fig. 5). Assuming that high column densities correlate with high volume densities, grain coagulation may be of importance. In addition, gas-phase molecules may freeze out on dust grains at low temperatures, altering their emissivities. Sandford & Allamandola (1993) e.g. found a sublimation temperature of CO onto CO-ice of 17 K from laboratory experiments under interstellar conditions. In Paper II, we indeed found evidence for depletion of the CO gas-phase abundance in one of the IC 5146 cores, which we attributed to freeze-out on grain surfaces.
This view is supported by the results of the dust model of OH94 who show that coagulation and formation of ices on grains in the dense and cold cloud interiors leads to an increase of long wavelength absorption. Depending on parameters like the density or ice thickness, OH94 predict enhancements by upto a factor of 3.4 (Table 2 in OH94) while we have observed an increase by about a factor of 3.8 (Fig. 3). Grain coagulation has a larger influence than formation of ices which contributes only a factor of 1.7. Dust opacity spectra of icy grains displayed in OH94 (Fig. 5b,c) show the rise in long wavelength opacity with coagulation. These calculations also indicate that the emissivity index stays almost constant for ice covered grains.
Furthermore, Fig. 5 in OH94 shows that the slopes of the dust opacity spectra stay rather constant in the NIR while the absolute opacities in the NIR rise only slightly when coagulation becomes important. The constancy of the slopes is consistent with the NIR extinctions law analyzed by Lada et al. (1994) who found that the ratio of color excess stays constant upto optical extinctions of 30 mag.

3.3 Four prestellar cores in more detail
The positions of four embedded cores are shown in the map of optical extinctions (Fig. 4). Center extinctions rise above 20 mag and all cores show some central symmetry. We therefore derived radially averaged profiles of optical extinction, dust temperature and (Fig. 5). Radially averaged extinctions drop by about 50% at a distance of corresponding to 0.13 pc. Mean radial values are listed in Table 1.
The peak in near (,) was excluded since it exhibits an east-west orientated gradient in dust temperature and , but no central symmetry.
Columns 5 to 7 give core masses within a radius of and masses of the total region mapped at 850 and 450 m. is the mass calculated from the data. is calculated independently from the flux densities using K and cm2g-1. is the mass calculated using the derived radial profiles of and . Mass ratio are presented in Col. 8 and 9: , .
| (1) | (2) | (3) | (4) | (5) | (6) | (7) | (8) | (9) |
|---|---|---|---|---|---|---|---|---|
| no. | / | |||||||
| K | [M⊙] | [M⊙] | [M⊙] | |||||
| #1 | / | 4.12 | 4.43 | 3.56 | 1.07 | 0.86 | ||
| #2 | / | 6.66 | 6.08 | 5.66 | 0.91 | 0.85 | ||
| #3 | / | 4.97 | 4.37 | 4.19 | 0.88 | 0.84 | ||
| #4 | / | 3.85 | 2.79 | 3.19 | 0.72 | 0.83 | ||
| sum | 19.6 | 17.7 | 16.6 | 0.90 | 0.85 | |||
| total | 106.5 | 124.4 | - | - | - |
3.3.1 Dust temperatures
The average temperatures of the four cores differ significantly: they range between 10 K and 18 K (Table 1). Mean temperatures of cores #1 and #3 are only 10 and 12 K, much lower than the globally averaged temperature of 16.5 K. These findings correspond well with typical dust and gas temperatures of starless molecular cores observed previously. The survey of ammonia in dense cloud cores by Benson & Myers (1989) shows typical gas temperatures of between 10 and 15 K. The observational derivation of dust temperatures is more difficult. Often, a canonical dust temperature of 12 K is used for quiescent dark clouds (Visser et al. 2001). Dust- and gas temperatures couple only at high densities of more than cm-3 (Goldsmith 2001; Krügel & Walmsley 1984).


Cores #1 and #4 appear to be almost isothermal. They show an almost constant temperature profile of 10 K and 16 K, respectively. The other two cores show a constant inner temperature of 15 K (core #2) and 12 K (core #3) for , and a rise of the temperatures by 7 and 3 K respectively at greater radii which trace the interclump medium when the radially averaged optical extinctions stay constant. This rise is also prominent in the map of dust temperatures (Fig. 4), in particular for the eastern most core #2.
For the center region of the IC 5146 filament, we have in addition obtained a small map (pc pc, ) of 1.2 mm flux densities which had been presented in Paper I. We derived from the observed ratio and from the independently observed ratio (assuming again ). The resulting dust temperatures vary only between 9 and 14 K. There is again a systematic anti-correlation between and : the dust temperature varies from 9 K and to 14 K and . The dust temperature drops slightly from an average of K at 10 mag optical extinction to 10 K at 20 mag. This gradient is shallower than the gradient derived solely from in Paper I, where a constant, canonical dust emissivity had been assumed.
A natural explanation for inwardly decreasing temperature gradients is that these cores are prestellar and only externally heated by the weak ambient ISRF. This leads to cool, dense dust in the core interiors surrounded by outer, less dense layers of warmer dust. The FUV field impinging on IC 5146 is probably slightly enhanced due to the small IC5146 star cluster (Wilking et al. 1984) which lies at a distance of to the east. Assuming that BD, a B0V star and the most massive member of the cluster, is the only source of FUV photons, that the star is a black body at the effective temperature of 30900 K corresponding to its spectral type (Panagia 1973), and that its radiation is not diluted by material along the way, we derive a flux of in units of the average interstellar radiation field at a distance of 8.1 pc.a 222 The integrated flux of the FUV field is given here in units of erg cm-2 s-1 (Draine & Bertoldi 1996). This unit is a factor of 1.71 stronger than the Habing field (Habing 1968).
Ward-Thompson et al. (2002) observed 18 prestellar cores using ISOPHOT data at 170 and m. From the flux ratio, assuming , they also find similarly low dust temperatures of between and 20 K. About half of their sources show a uniform temperature distribution while the other half shows an inwardly decreasing temperature profile.
We find low l.o.s. averaged dust temperatures of 10 K in some cloud cores. This corresponds well with models of Mathis et al. (1983) who find that deep inside clouds, both silicate and graphite grains attain local temperatures between 5 and 7 K. We have found indications for increased opacities in the cloud interiors due to grain coagulation and formation of ices. This increased emissivity may lead to more efficient cooling of the dust grains, thus further lowering the dust temperatures.
Recent models by Zucconi et al. (2001) and Evans et al. (2001) quantify the temperature gradient expected for prestellar cores illuminated only by the external average ISRF. These models show that local temperatures vary between 8 K in the interior and 14 K at the surface. An increase of the ISRF by a factor of 2 would lead to an increased dust temperature by only 15-20%.
3.3.2 Dust emissivity
The average dust temperatures and values (Table 1) are anticorrelated, as had already been found when analyzing all the mapped positions (Fig. 3). Cores #2 and #4 show a low average ratio of (and at the same time relatively high temperatures) while cores #1 and #3 show a high ratio of 5 and respectively (and relatively low temperatures). The radial profiles (Fig. 5) are mostly flat (#1, #2, #4). Only core #3 shows a large radial variation of the kappa-ratio between 3 and .
3.3.3 Masses
We calculated the masses of the prestellar cores (Fig. 4, Table 1) by integrating over a disk with a radius of 0.067 pc (), i.e. covering the inner region of the radial profiles shown in Fig. 5. We use three different methods to derive core masses. (1.) Optical extinctions were used to derive masses via the canonical ratio of H/ cm-2mag-1 observed by Bohlin et al. (1978) in the diffuse interstellar medium: with the area and the mean particle mass in units of the hydrogen atom mass . (2.) The flux density at m was also used to independently derive the total mass , where is the distance, and is the integrated flux. Here, we used canonical values for the dust temperature and : K and cm2g-1. The masses derived from dust emission are a sensitive function of dust temperatures. For example, assuming a temperature of 10 K would result in an overestimate by a factor of 2.1 relative to the mass at 15 K temperature. Assuming on the other hand a temperature of 20 K would lead to an underestimate by a factor of 0.6 relative to the mass at 15 K. (3.) We therefore employed a third method, using the radial profiles of (Fig. 5) and to derive masses 333To calculate from the profile, we assumed a constant extinction coefficient in the V band of cm2g-1. This value was in turn derived using the canonical values of Mathis (1990) (Eq. 3) and a mean cm2g-1..
Core masses lie between 3 M⊙and 7 M⊙, thus constituting only about 20% of the total mass. The masses derived by the three methods agree to within 30%. This excellent agreement is surprising, given that the masses and were derived from two independent data sets i.e. the data on the one hand and the submillimetric flux densities on the other hand and given the observational errors of both methods. The agreement shows that the observational errors are still smaller and the underlying assumptions are valid to within that accuracy.
When comparing with core masses derived from the profiles of dust temperature and , we find that the latter are smaller by an almost constant factor of . The scatter is significantly smaller than the scatter of /. The main factor contributing to the improved mass estimate is probably the determined dust temperature. A correction of the canonical conversion factor N(H2)/ or, alternatively, of the extinction coefficient by only 15% would be needed to explain the constant deviation of from .
4 Summary
We mapped the submillimeter dust emission at 850 and 450 m and the optical extinction of the IC 5146 molecular cloud filament. All data was smoothed to the resolution of the data, i.e. to 0.067 pc (). The map covers a region of pc0.3 pc. Several peaks of mag show up along the east-west orientated dust ridge which we interpret as dense prestellar cores.
-
•
The maps of dust emission correspond well with the map of dust extinction. Most cores show up in all three maps. However, the map of dust extinction shows a higher contrast. The subsequent analysis relies on the estimated calibration accuracy, i.e. mainly on the assumption that the ratio of flux densities is accurate to within %. This accuracy is established by accurate correction for the atmospheric opacity, by deconvolving the error beam at m, and by smoothing all three data sets to resolution. The validity of the estimated calibration error is indicated by the smooth variation of dust temperatures over the surface of the dust ridge (Fig. 4) and the small sampling errors of within the annuli of the radial core profiles (Fig. 5). These errors are less than 1 K for all annuli.
-
•
We constructed a map of dust temperature from the dust emissivities, assuming a constant dust emissivity index of and only one dust temperature component along each line of sight. A Monte Carlo simulation shows that the significant part of the dust temperature distribution is restricted to temperatures between K and K. Cores have rather low temperatures of less than K, while the inter clump dust shows temperatures of about K.
-
•
A map of the dust absorption ratio was constructed by using in addition the map of optical extinctions. Its mean value corresponds well to the ratio found by Mathis (1990). The Monte Carlo simulation indicates a systematic and significant rise of with dropping dust temperature, i.e. from at K to at K.
This translates into a corresponding variation of , assuming that stays constant. Such a variation is in fact predicted by the grain evolutionary model of OH94 when coagulation and formation of ices on grain surfaces becomes important in the cold, dense cloud interiors.
This is also consistent with the previously observed reduction of the CO gas phase abundance due to freeze out onto grains in the IC 5146 center region (Paper II).
-
•
We identified four cores with high optical extinctions along the ridge. Radial profiles of dust temperature show almost isothermal profiles for the inner radius of 0.067 pc (). Two of the cores show a significant increase of dust temperature at larger radii which we attribute to the presence of externally heated dust of the inter clump medium.
-
•
Core masses derived from and integrated over a diameter of 0.13 pc () vary between 4 and 7 M⊙. Masses derived independently from the 850 m dust emissivity assuming canonical values for and agree with by better than 30%. This indicates that both completely independent methods trace the distribution of total dust and gas column densities with that accuracy. Masses derived from taking into account the radial profiles of and are offset from by an almost constant factor of 0.85.
Dust fluxes at shorter wavelengths than m are however needed to better disentangle variations of dust temperature, dust emissivity index , and the absolute opacities. This is because the spectral energy distributions of cold cloud cores peak around m. Since this wavelength range is inaccessible from the ground, it will be space-borne instruments like PACS and SPIRE on board the Herschel space observatory, which is scheduled to start in 2007, which will provide unprecedented sensitivity and spatial resolution to access this wavelength regime (e.g. André 2001).
Acknowledgements.
We thank M. Walmsley and V. Ossenkopf for helpful comments on a first version. We are grateful to T. Huard for using a new NIR-dataset prior to publication, to derive optical extinctions in the area of the OFF beam. CJL acknowledges support from NASA Origins grant NAG5-9520. BM is supported by an Alexander von Humboldt research fellowship.References
- André (2001) André, P. 2001, in The origins of stars and planets: the VLT view, ed. J. Alves & M. Mc.Caughrean (Berlin: Springer-Verlag series ESO Astrophysics Symposia)
- Archibald et al. (2002) Archibald, E., Jenness, T., Holland, W., et al. 2002, MNRAS, 336, 1
- Archibald et al. (2000) Archibald, E., Wagg, J., & Jenness, T. 2000, Calculating Sky Opacities: a re-analysis for SCUBA data, Tech. rep., JCMT, sCD System Note 2.2
- Benson & Myers (1989) Benson, P. & Myers, P. 1989, ApJ, 71, 89
- Bergin et al. (2002) Bergin, E., Alves, J., Huard, T., & Lada, C. 2002, ApJ, 570, 101
- Bohlin et al. (1978) Bohlin, R. C., Savage, B. D., & Drake, J. F. 1978, ApJ, 224, 132
- Caselli et al. (1999) Caselli, P., Walmsley, M., Tafalla, C., Dore, L., & Myers, P. 1999, ApJ, 523, 165
- Dobashi et al. (1993) Dobashi, K., Onishi, T., Iwata, T., et al. 1993, AJ, 105, 1487
- Dobashi et al. (1992) Dobashi, K., Yonekura, Y., Mizuno, A., & Fukui, Y. 1992, AJ, 104, 1525
- Draine & Bertoldi (1996) Draine, B. & Bertoldi, F. 1996, ApJ, 468, 269
- Evans et al. (2001) Evans, N., Rawlings, J., Shirley, Y., & Mundy, L. 2001, ApJ, 557, 193
- Goldsmith (2001) Goldsmith, P. 2001, ApJ, 557, 736
- Goldsmith et al. (1997) Goldsmith, P., Bergin, E., & Lis, D. 1997, ApJ, 491, 615
- Habing (1968) Habing, H. 1968, Bull. Astr. Inst. Netherlands, 19, 421
- Henning et al. (1995) Henning, T., Michel, B., & Stognienko, R. 1995, Planet. Space Sci., 43, 1333
- Hildebrand (1983) Hildebrand, R. 1983, QJRAS, 24, 267
- Hogerheijde & Sandell (2000) Hogerheijde, M. & Sandell, G. 2000, ApJ, 534, 880
- Holland et al. (1999) Holland, W., Robson, E., Gear, W., et al. 1999, MNRAS, 303, 659
- Huard et al. (1999) Huard, T., Sandell, G., & Weintraub, D. 1999, ApJ, 526, 833
- Jenness & Lightfoot (1998) Jenness, T. & Lightfoot, J. 1998, in Astronomical Data Analysis Software and Systems VII, ed. R. Albrecht, R. Hook, & H. Bushouse (ASP Conf. Ser. 145)
- Jenness et al. (2002) Jenness, T., Stevens, J., Archibald, E., et al. 2002, MNRAS, 336, 14
- Johnstone & Bally (1999) Johnstone, D. & Bally, J. 1999, ApJ, 510, 49
- Kramer (1999) Kramer, C. 1999, in The physics and chemistry of the interstellar medium, ed. V. Ossenkopf, J. Stutzki, & G. Winnewisser (Herdecke: GCA Verlag)
- Kramer et al. (1998) Kramer, C., Alves, J., Lada, C. J., et al. 1998, A&A, 329, 33, (Paper I)
- Kramer et al. (1999) —. 1999, A&A, 342, 257, (Paper II)
- Krügel & Walmsley (1984) Krügel, E. & Walmsley, C. 1984, A&A, 130, 5
- Lada et al. (1999) Lada, C. J., Alves, J., & Lada, E. A. 1999, ApJ, 512, 250
- Lada et al. (1994) Lada, C. J., Lada, E. A., Clemens, D. P., & Bally, J. 1994, ApJ, 429, 694
- Leung (1975) Leung, C. 1975, ApJ, 199, 340
- Levreault (1983) Levreault, R. 1983, ApJ, 265, 855
- Mathis (1990) Mathis, J. S. 1990, A&AR, 28, 37
- Mathis et al. (1983) Mathis, J. S., Mezger, P. G., & Panagia, N. 1983, A&A, 128, 212
- Ossenkopf & Henning (1994) Ossenkopf, V. & Henning, T. 1994, A&A, 291, 943, (OH94)
- Panagia (1973) Panagia, N. 1973, AJ, 78, 929
- Pollack et al. (1994) Pollack, J., Hollenbach, D., Beckwith, S., et al. 1994, ApJ, 421, 615
- Rieke & Lebofsky (1985) Rieke, G. & Lebofsky, M. 1985, ApJ, 288, 618
- Sandell (1994) Sandell, G. 1994, MNRAS, 271, 75
- Sandell et al. (1999) Sandell, G., Avery, L., Baas, F., et al. 1999, ApJ, 519, 236
- Sandford & Allamandola (1993) Sandford, S. & Allamandola, L. 1993, ApJ, 417, 815
- Stognienko et al. (1995) Stognienko, R., Henning, T., & Ossenkopf, V. 1995, A&A, 296, 797
- Tafalla et al. (2002) Tafalla, M., Myers, P., Caselli, P., Walmsley, C., & Comito, C. 2002, ApJ, 569, 815
- Visser et al. (2001) Visser, A., Richer, J., & Chandler, C. 2001, MNRAS, 323, 257
- Visser et al. (1998) Visser, A., Richer, J., Chandler, C., & Padman, R. 1998, MNRAS, 301, 585
- Ward-Thompson et al. (2002) Ward-Thompson, D., Andre, P., & Kirk, J. 2002, MNRAS, 329, 257
- Wilking et al. (1984) Wilking, B., Harvey, P., & Joy, M. 1984, AJ, 89, 496
- Zucconi et al. (2001) Zucconi, A., Walmsley, C., & Galli, D. 2001, A&A, 376, 650