Proper Motions in Compact Symmetric Objects
Abstract
We discuss recent measurements of proper motions of the hotspots of Compact Symmetric Objects. Source expansion has been detected in ten CSOs so far and all these objects are very young ( years). In a few sources ages have also been estimated from energy supply and spectral ageing arguments and these estimates are comparable. This argues that these sources are close to equipartition and that standard spectral ageing models apply. Proper motions studies are now constraining hotspot accelerations, side-to-side motions and differences in hotspot advance speeds between the two hotspots within sources. Although most CSOs are young sources their evolution is unclear. There is increasing evidence that in some objects the CSO structure represents a new phase of activity within a recurrent source.
1 Max Planck Institut für Radioastronomie, Postfach 2024, D-53010, Bonn, Germany
2 Onsala Space Observatory, Chalmers Technical University,
Onsala S-43992, Sweden
Keywords: Galaxies: active-compact-evolution
1 Introduction
The term “Compact Symmetric Objects” (CSOs) was first coined by Wilkinson et al (1994) to describe sub-kiloparsec scale sources having symmetric radio structure. Often these sources are doubles or triples (Conway et al 1992), where the central component is compact and is consistent with being the centre of activity (Taylor et al 1996). CSOs often have a radio spectrum which peaks around a few GHz and thus belong to the class of Gigahertz Peaked Spectrum (GPS) sources. However this is not universally the case, for instance the radio spectrum of the prototype CSO 2352+495 is quite flat (e.g. Readhead et al 1996 (RPX96)). This turns out to be due to the superposition of components which peak at different frequencies. GPS radio galaxies all seem to be CSOs with relatively simple structures, but more complex CSOs sometimes do not have a GPS spectrum. Most GPS quasars do not seem to have CSO structures and may be a separate class of object. The radio structures of the CSOs are similar to the large, kiloparsec and megaparsec sized, double-sided radio sources (dubbed ’classical doubles’) but are approximately 1000 times smaller.
The physical origin of Compact Symmetric Objects has been discussed for many years. While soon after the detection of the first examples it was suggested (Philips & Mutel 1982) that they are young radio sources which would evolve into large radio sources, alternative suggestions have also been proposed: CSOs could be ’frustrated’, ie. located in a dense environment that could inhibit the growth of the radio structure. CSOs could also be young radio sources, that will ’fizzle’ out and die young (Readhead et al 1994) or stages of intermittent radio activity (Reynolds & Begelman 1997).
2 Observations of Velocities in CSOs
CSOs usually contain compact and bright compact ‘hotspot’ components located at the extremities of the source consistent with them being the working surface of the jets as it propagates through the ISM. Using multi-epoch VLBI observations it is possible to measure or set limits on the rate of separation of their hotspots.
2.1 Observational Summary
The first upper limits on the rate of hotspot separation in CSOs (Tzioumis et al 1989) showed that their velocities were sub-relativistic and hence much smaller than the core-jet objects. Conway et al (1994) measured possible sub-relativistic motions in two CSOs but because these were based on only two epochs of data they were not claimed as definite detections. The first unambiguous detections of CSO expansion were reported in the CSOs 0710+439 (Owsianik & Conway 1998, OC98) and 0108+388 (Owsianik et al 1998, OCP98) based on multi-epoch VLBI observations over a decade or more. Since then, detections or upper limits on expansion have been determined for thirteen CSOs (Table 1). In the first two parts of Table 1 we show the detections and limits on the separation velocities of outer (hotspot) components. For some sources there are multiple speed estimates in the literature made at different frequencies over different time intervals, in this case the one quoted in Table 1 is the one with lowest error. The angular speed given is the rate at which outer hotspot components increase their separation, this is the relevant quantity for calculating sources ages. A few sources such as 1031+567 (Taylor et al 2000, TMP00) and 0108+388 (Owsianik et al, in prep) may also have significant side-to-side motions, so the total relative velocity between two hotspots quoted in some papers may be larger than those in Table 1. Amongst the detections the rate of expansion ranges between 0.1 and 0.4, the unweighted mean value being 0.19 (0.17 including the limits).
In several cases motions have been detected for components which are not at the edges of the source, these internal component velocities are listed in the third part of Table 1. In these cases we may be measuring outward velocities of jet components. These internal velocities, as expected for a jet component origin, are larger than for the hotspot components. In most cases these results are consistent with the jet components moving with Lorentz between 2-5, but at relatively large angles to the line of sight.
| Source | z | Sizea | Age(yrs) | Nr. of Epochs | Refb | |
| Detections | ||||||
| 0035+227c | 0.096 | 21.8 | 0.120.06 | 567 | 2 (1998-2001) | 1 |
| 0108+388 | 0.669 | 22.7 | 0.180.01 | 417 | 5 (1982-2000) | 2 |
| 0710+439 | 0.518 | 87.7 | 0.300.02 | 932 | 7 (1980-2000) | 3 |
| 1031+567c | 0.4597 | 109.0 | 0.190.07 | 1836 | 2 (1995-1999) | 4 |
| 1245+676 | 0.1071 | 9.6 | 0.160.01 | 190 | 5 (1989-2001) | 5 |
| OQ208 | 0.0766 | 7.0 | 0.100.03 | 224 | 6 (1993-2002) | 6 |
| 1843+356c | 0.763 | 22.6 | 0.400.04 | 180 | 2 (1993-1997) | 7 |
| 1943+546 | 0.263 | 107.1 | 0.260.04 | 1306 | 4 (1993-2000) | 1 |
| 2021+614 | 0.227 | 16.1 | 0.140.02 | 368 | 3 (1982-1998) | 8 |
| 2352+495 | 0.238 | 117.3 | 0.120.03 | 3003 | 6 (1983-2000) | 9 |
| Limits | ||||||
| 1718-649 | 0.0142 | 2.0 | 0.07 | 2+ | 12 | |
| 1934-638 | 0.183 | 83.2 | 0.05 | 3+ | 10 | |
| 1946+708 | 0.101 | 39.4 | 0.10 | 5 (1992-1996) | 11 | |
| Jet Components | ||||||
| Source | z | Sizea | IDe | Nr. of Epochs | Refb | |
| 0108+388 | 0.669 | 22.70 | 0.7 | C5 | 2 (1994-1997) | 4 |
| 1031+567 | 0.4597 | 109 | 0.6 | 2 (1995-1999) | 4 | |
| 1946+708 | 0.101 | 39.4 | 0.2 | S2, S5 | 5 (1992-1996) | 11 |
| 1946+708 | 0.5-0.9 | N2, N5 | 5 (1992-1996) | 11 | ||
| 2352+495 | 0.238 | 117.3 | 0.4 | B1a | 6 (1983-2000) | 9 |
| 2352+495 | 0.7 | B5 | 2 (1994-1999) | 4 | ||
| 2352+495 | 0.2 | C1 | 6 (1983-2000) | 9 | ||
a The Linear size and the hotspot separation velocities are reported in units of pc and c for H km s-1Mpc-1
b References: 1. this paper, 2. Owsianik et al (1998) and this paper, 3. Owsianik & Conway (1998) and this paper, 4. Taylor et al (2000), 5. Marecki et al, this proc., 6. Stanghellini et al (2000), 7. Polatidis et al (2001), 8. Tschager et al (2000), 9. Owsianik et al (2002), 10. Tzioumis et al (1989) and priv. com., 11. Taylor & Vermeulen (1997), 12. Tingay et al, these proceedings.
c Velocity measurement between 2 epochs only, hence provisional detection.
d Component velocity measured relative to the core, or the source centre of symmetry.
e ID: Component name as identified in the relevant publication.
The longest possible temporal coverage is obviously important in getting good speed estimates (Table 1 shows the number of epochs and the temporal coverage of the sources so far). In the sources 0710+439 (OC98), 0108+388 (OCP98) and 2352+495 (Polatidis et al 2002, POC02), the 6 cm VLBI observations cover by now almost 20 years and consist of 5–7 measurements (epochs) per source (see Figure 1a for CSO 0710+439). With such data it is possible to do meaningful regression analysis from which error bars on the velocity can be estimated robustly. In these cases all the ordinary least sqares methods (e.g. Isobe et al 1990) gave consistent values (withing the errors) for the rate of expansion. In contrast measurements based on only a couple of epochs require error bars based on a priori estimates of the accuracy to which component positions can be measured (usually taken as 1/10 of a beam or the beam size/signal-to-noise ratio). For long tracks, simple sources and high enough map signal-to-noise on each component (i.e. SNR) regression analysis for 0710+439 and 2352+495 shows that such a priori position error estimates are plausible. However a minimum of three epochs is probably required to feel fully confident of a real velocity detection.


2.2 Multiple Frequencies and Temporal Variations
Measurements of the hotspot separation velocities in Table 1 have been made at different frequencies; most often at 5 GHz (e.g. OC98, OCP98, POC02, Tschager et al 2000), at 8.4 GHz (e.g Polatidis et al 1999 and this paper) or 15 GHz (e.g. TMP00). Generally if a source has been monitored at more than one frequency the derived velocities are similar. For example, for 1943+546 we report an expansion velocity (Fig 1b), from three epoch (1993.1-2000.4) measurements at 8.4 GHz, of c which is within the errors with that independently derived using four epoch (1991.7-2000.4) 5GHz VLBI observations (c).
In the case of 2352+495, TMP00, based on two epoch 15GHz observations (1994.9-1999.5), reported a velocity more than twice as large as the 20 year average at 5GHz (see POC02). However restricting the analysis to the three 5GHz epochs (and additional two 8GHz epochs) which cover a similar time period as the two 15GHz epochs (1993.3-1997.7) a consistent high velocity is found. The higher velocity found over a short period may therefore be due to real temporal variations in the hotspot advance speeds.
2.3 Individual Hotspot Advance Speeds
In cases where there is a strong, unambiguously identified core we can attempt to measure the advance speed of each of the two hotspots separately. In some cases apparent differences are seen. For example in 1943+546 while the eastern (and more distant from the core) hotspot moves away from the core with =0.25c. the nearer western hotspot is apparently barely moving (with a projected velocity of 0.01c) away from the core. Different individual hotspot advance speeds are seen in a few other sources where the core is identified (e.g. 0710+439, OC98). These measurements are very difficult, especially at 5GHz where CSO core components are weak. We should remember that if weak jet components are emerging from the core its apparent position can vary, invalidating the separate core-hotspot velocities.
If different oppositely directed hotspot transverse velocities are really being observed in 1943+546 and 0710+439 and assuming simultaneous ejection from the core then it immediately implies that hotspot advance speeds vary with time during the lifetime of the source. If they were instead constant then the hotspot velocity ratio would equal the hotspot-core-hotspot arm length ratio which is not the case. For instance the two sigma lower limit on the hotspot velocity ratio in 1943+546 is 6.8 yet the arm length ratio is only 1.68. Additional evidence for hotspot advance speed variability may also be available from observations of 2352+495 (see Section 2.2). Temporal variations in hotspot advance speed could be produced by hydrodynamically introduced internal pressure changes or changes in external density. In hydrodynamic simulations through a smooth medium Norman (1996) found variations in hotspot pressures, causing variations in hotspot advance speed of about a factor of two. Such different hotspot advance speeds are consistent with differences in the hotspot pressures within CSOs of order 5 (e.g. RPX96,OC98). In both 0710+439 and 1943+546 it is the highest pressure hotspot which is moving fastest, as expected. However the magnitude of the difference in advance speed in 1943+546 seems too large to explain by pressure variations, in this case it is more likely due to variations in external density. Perhaps in 1943+546 the eastern hotspot is moving through an intercloud medium while the western hotspot is encountering a cloud.
2.4 Side-to-Side motions
An assumption that is often made in source evolution models is that the pressure of the hotspot is effectively distributed over a larger area than that of the hotspot itself (the so-called “dentist’s drill” model, Scheuer 1982). In this model the hotspot has larger side-to-side motions than its forward motion, and averaged over time the area over which thrust is distributed is therefore increased. Observations of CSOs seem to show that such side-to-side motions are in fact much smaller than forward motions.(e.g POC02, Polatidis et al in prep). The possible exceptions are 0108+388 (Owsianik et al in prep) and 1031+567 (TMP00). It is important in future when reporting velocities to distinguish between the velocity components along and perpendicular to the source axis. By detecting or setting limits on perpendicular velocities the impact of side-to-side motions on source evolution can be assessed.
2.5 Expansion in Recurrent Sources
In general, most CSOs have no large scale radio emission which might be a sign of recurrent activity. There are however a couple of sources in which weak extended emission has been detected, e.g. 0108+388 (e.g. Owsianik et al 1998), 1345+125 and OQ208 (Stanghellini et al 2002, these proceedings). In addition to these cases there also exist extreme examples of ‘double-double’ sources in which the central double has CSO-sized dimensions. For example the z=0.107 radio galaxy 1245+676 has a triple radio morphology (0.97 Mpc in extent, Lara et al 2001) and radio luminosity typical of an FR II galaxy except for the fact that the central component dominates the flux density (67% at 1.4 GHz) and hence the total radio spectrum, and is similar to the GPS sources. At parsec scale resolution, the core appears as a Compact Symmetric Object. Its 9.6 parsec structure is dominated by two mini-lobes containing hotspots; a slightly inverted spectrum, weak component, located close to the centre of the structure is tentatively identified with the core. VLBI observations at 5GHz (1989.7-2001.5) have shown that the hotspots move apart with a velocity of 0.163c (Marecki et al, these proceedings). This implies a kinematic age of 190 years for the core region. 1245+676 is by far the best example where the CSO appears to be the youngest phase of recurrent radio activity, hinting that at least some CSOs may be re-born radio sources.
3 Discussion
In the previous section we discussed the observations and specific sources. In this section we discuss more generally how the proper motions constrain the general properties of the CSO population.
3.1 Kinematic Ages of CSOs
The most direct result of the CSO expansion measurements are the low kinematic ages derived by dividing the projected source size by the measured projected separation velocities (see Table 1) which are all yrs. What is important here is not the exact number (which may be revised as new measurements are added) but rather the order of magnitude. This implies that CSOs are young objects. This constitutes so far the most direct way to estimate the age of an extragalactic radio source.
Before accepting these age estimates we should consider whether the measured source expansions (which represent the instantaneous hotspot separation rate) are truly representative of the mean growth rate of the sources. CSOs might conceivably expand in brief bursts when encountering a relatively low density medium, their advance being hindered by jet-cloud interactions during the rest of the time. If this were happening we would be measuring only the velocity of these brief expansion periods and hence severely underestimating their age. This is highly unlikely, given that we have measured expansion speeds in a very high fraction of the sources where we have good data (10 of 13 cases, Table 1). This implies that the instantaneously measured separation velocities are consistent with the mean hotspot separation speed and that the kinematically estimated ages are an accurate representation of the radio source lifetime.
3.2 Other Age Estimates and Equipartition
Age estimates for CSOs have also been made by indirect means. Readhead et al (1996) applied the classical ’waste energy basket’ argument to 2352+495 and derived an age of 3000 years, which is similar to the kinematical age of 3003 years (POC02). There have also been attempts to estimate the age of CSOs and the larger double sources (MSOs) via the detection of high frequency breaks in their spectra due to ageing of the electrons in the lobes. Minimum energy and equipartition conditions are also usually assumed. The estimated spectral ages (eg. RPX96, Murgia et al 1998) are 10 years, similar to the kinematic ages. In fact Murgia (these proceedings) derives a spectral age for 1943+546, very close to the kinematic age of 1297 years.
The close agreement of kinematic and other age estimates suggests that most CSOs are indeed young radio loud sources. The agreement also shows that particle and fields are probably close to equipartition in CSOs and that the standard model of radiative ageing is roughly correct. These are important results since it is very unclear whether equipartition and standard spectral ageing apply in classical double sources (see Blundell and Rawlings 2000, Rudnick 2002).
3.3 Velocity Correlations
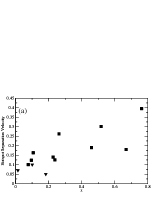
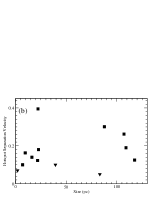
We have searched for possible correlations (Polatidis et al, in prep) between separation velocity and luminosity, redshift, source size and arm length ratio (see Sec 3.4). We find an apparent correlation with redshift (with a correlation coefficient =0.752) but no correlation with source size (see Fig 2) or luminosity. However this apparent correlation might be observationally biased. Slowly expanding sources will be hard to detect at larger z, so we would not expect the bottom right of the velocity-z graph to be filled.
3.4 Hotspot Advance Speeds and Source Orientations
Proper motion observations obviously give only the velocities projected on the sky plane. We would like to estimate the hotspot advance speeds through their surrounding medium which can in turn be used to constrain external densities via ram pressure arguments. The absence of superluminal motions and relativistic beaming together with the edge brightened source morphologies seems consistent with CSOs being isotropically orientated. In this case the projected hotpot advance speeds are on average half of their total speeds. Hence the mean advance speed of each hotspot through its external medium would equal the mean projected hotspot separation velocity or 0.19 (see Sect 2.1).
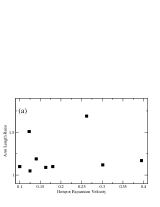
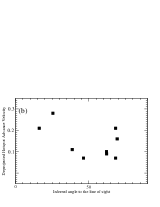
Assuming only light travel time effects, one could try to derive the deprojected hotspot advance velocity and the angle to the line of sight using both the arm-length ratio and the observed velocities. Fig 3a shows the measured arm-length rations and hotspot separation velocities for the nine sources with a detection in Table 1 for which the core has been identified (except for 1031+567). Figure 3b shows the deprojected hotspot advance velocities and the inferred angle to line of sight assuming all the asymmetry is due to light travel time effects. Of course it is likely that part of the arm-length asymmetry is intrinsic and not light travel time induced.
3.5 Evolution of CSOs
Measured CSOs expansions show that they are young sources, however the subsequent evolution of these sources is less clear. The simplest assumption is that CSOs evolve into classical double sources like Cygnus A. Alternatively CSOs could comprise a population of short lived sources which ’fizzle-out’ after a short lifetime. Answering the question of CSOs subsequent evolution requires studying the population densities of different sizes of source. However the CSO velocities also provide some constraint on models, because subsequent evolution cannot give significantly larger hotspot velocities or else relativistic effects would be seen. In addition the velocity measurements, assuming ram pressure confinement of the hotspots by the ISM, constrain the external densities at distances of a few to a few hundred parsecs from the centre of activity to be of order 1 cm-3 (e.g. RPX96, OC98, Conway 2002) which implies that the external density is not power law down to parsec scales but rather has a King profile with scale length of order 1kpc. Such a turnover may also explain the redshift distribution of GPS and larger sources (Snellen et al 1999).
O’Dea & Baum (1997) found that the relative number of MSOs and large scale sources were roughly consistent with an evolution model in which sources expand into a medium with decreasing density with radius and undergo the expected negative luminosity evolution. However in this model given the external density turnover at kpc one would expect there to be very much fewer sub 100pc sized sources than are observed. Such an excess may imply that CSOs belong mainly to a separate population of short lived sources, however it is possible that luminosity selection effects influence this result (viz Snellen et al 1999). An alternative explanation is that for some reason small CSOs are closer to equipartition (see Section 3.2) than larger sources, which is an additional effect increasing their efficiency of converting jet energy to radio luminosity, which then boosts their representation in flux limited samples (Conway 2002).
4 Conclusions
The combination of proper motion studies in CSOs with other lines of evidence strongly argues that most CSOs are young objects. One of the main questions posed at the last GPS conference therefore seems to be answered.
A fundamental consequence of such CSO youth, which is often overlooked, is that narrow jets and hotspots apparently exist only a few hundred years after the start of the radio-loud activity. This very short characteristic time must strongly constrain the scales and mechanisms by which jets are formed and accelerated. If the source activity started with a wide angle wind or slowly accelerating outflow we would not see the CSO morphologies that we observe. One can summarize this as ’Jet activity starts like an electric motor and not like a steam engine’ (R.Blandford, private communication).
Having established the basic fact that CSOs are young, proper motion studies still have a lot to contribute. For instance its not yet clear whether all CSOs are young or if some are frustrated. Continued monitoring of sources with upper limits is therefore important. Finding the distribution of CSO velocities and looking for correlations with other quantities is another important goal to constrain evolution models. Long term monitoring can also reveal or set limit on hotspot accelerations/decelerations, different hotspot advance speeds in the same source or hotspot side-to-side motions; all are useful to constrain the dynamics of how radio sources evolve.
The rate at which new CSO motions are reported in the literature is encouraging for answering the above questions. We should however remember to continue to be very careful in our measurements and our interpretations (and remain very patient!) since detecting these very small angular velocities remains technically challenging.
References
Blundell K.M., Rawlings, S., 2000, AJ, 119, 1111
Conway, J.E., et al 1992, ApJ, 396, 62.
Conway, J.E., et al, 1994, ApJ, 425, 568.
Conway, J.E., 2002, NewAR, 46, 2-7, 263
Isobe, T., et al, 1990, ApJ, 364, 104
Lara, L., et al, 2001, A&A, 370, 409
Marecki A., 2002, these proceedings
Murgia M., et al 1999, A&A, 345, 769.
Murgia M., 2002, these proceedings
Norman M., 1996, in ’Energy Transport in radio galaxies and Quasars’ PASP Conf Vol 100. p 405.
O’Dea C.P., 1998, PASP, 110, 493.
Owsianik, I., Conway, J, 1998, A&A, 337, 69 (OC98).
Owsianik, I., Conway, J., Polatidis, A., 1998, A&A, 336, L37. (OCP98)
Polatidis, A.G., Owsianik, I., Conway, J.E., 2002, A&A, sub. (POC02)
Phillips, R.B., Mutel, R.L., 1982, A&A, 106, 21
Polatidis, A.G., et al 1999, NewAR, 43/8-10, 657
Polatidis, A.G., 2001, in ”Similarities and Universalities of Relativistic Flows”, eds. M Georganopoulos et al., Logos Verlag, 96
Readhead A.C.S., et al 1994, in Proc.NRAO Workshop 23, 17
Readhead A.C.S., et al , 1996, ApJ, 460, 612. (RPX96)
Reynolds, C.S., Begelman M.C., 1997, ApJ, 487, L135.
Rudnick L., 2002, NewAR , 46, 2-7, 95.
Scheuer P., 1982, In Proc. IAU Symp 97, 163
Stanghellini C., Liu, X.,Dallacasa, D., Bondi, M., 2002a, NewAR, Vol 46, 287.
Stanghellini C., et al 2002b, these proceedings
Taylor, G.B., et al, 1996, ApJ, 463, 95
Taylor, G.B., Vermuelen, R.C., 1997, ApJ, 485, L9
Taylor, G.B., et al, 2000, ApJ, 541, 112 (TMP00)
Tschager, W. et al, 2000, A&A, 360, 887.
Tzioumis, A.K., et al, 1989, AJ, 98, 36
Wilkinson, P.N., Polatidis, A.G., et al 1994, ApJ, 432, L87.