Estimating Star Formation Rates from Infrared and Radio Luminosities: The Origin of the Radio–Infrared Correlation
Abstract
I have assembled a diverse sample of galaxies from the literature with far-ultraviolet (FUV), optical, infrared (IR) and radio luminosities to explore the calibration of radio-derived and IR-derived star formation (SF) rates, and the origin of the radio-IR correlation. By comparing the 8–1000µm IR, which samples dust-reprocessed starlight, with direct stellar FUV emission, I show that the IR traces most of the SF in luminous galaxies but traces only a small fraction of the SF in faint galaxies. If radio emission were a perfect SF rate indicator, this effect would cause easily detectable curvature in the radio-IR correlation. Yet, the radio-IR correlation is nearly linear. This implies that the radio flux from low-luminosity galaxies is substantially suppressed, compared to brighter galaxies. This is naturally interpreted in terms of a decreasing efficiency of non-thermal radio emission in faint galaxies. Thus, the linearity of the radio–IR correlation is a conspiracy: both indicators underestimate the SF rate at low luminosities. SF rate calibrations which take into account this effect are presented, along with estimates of the random and systematic error associated with their use.
1 Introduction
Because ultraviolet (UV) and optical star formation (SF) rate indicators are so sensitive to dust (see, e.g., Kennicutt, 1998; Adelberger & Steidel, 2000; Bell & Kennicutt, 2001; Goldader et al., 2002; Bell, 2002), there has been much recent interest in using infrared (IR) and radio luminosities in their stead (see, e.g., Blain et al., 1999; Flores et al., 1999; Haarsma et al., 2000; Hopkins et al., 2001; Mann et al., 2002). While IR emission is straightforward to understand in the optically-thick case for an intensely star-forming galaxy (Kennicutt, 1998), radio emission is a highly indirect indicator of SF rate, relying largely on the complex and poorly-understood physics of cosmic ray generation and confinement (see the excellent review by Condon, 1992). Indeed, the strongest argument for radio luminosity as a SF rate indicator has come from the astonishingly tight (a factor of two over 5 orders of magnitude in luminosity) and arguably linear radio-IR correlation (e.g., de Jong et al., 1985; Condon et al., 1991; Yun et al., 2001). This close link between the radio and IR luminosities of galaxies, even when normalized by galaxy mass (e.g., Fitt et al., 1988; Price & Duric, 1992), has often been used as a supporting argument for the efficacy and robustness of radio- and IR-derived SF rates. In this paper, I compare UV, H, IR and radio luminosities for a diverse sample of galaxies to demonstrate that neither the IR nor radio emissions linearly track SF rate. I argue that the tight, nearly linear radio-IR correlation is a conspiracy: both the IR and radio luminosities of dwarf galaxies significantly underestimate the SF rate. Finally, new SF rate calibrations which take into account this effect are presented.
1.1 The origin of IR and radio emission
The primary prerequisite for an effective SF rate indicator is that it reflects the mass of young stars in some well-defined way. However, in practice, no SF rate indicator directly reflects the mass of young stars. It is useful at this stage to develop an intuition for the physical origin, strengths and limitations of IR and radio emissions as SF rate indicators. For more in-depth discussion of these SF rate indicators, see Kennicutt (1998) and Condon (1992).
1.1.1 IR emission
In systems with ongoing SF, the light from both newly-formed and older stars can be absorbed by dust and reprocessed into the IR. There are thus two questions that should be addressed. i) What are the relative contributions of old and young stars to the IR luminosity? ii) How much light is reprocessed into the IR? Put differently, what is the optical depth of galaxies? Because of my focus on the young stellar populations, I will tend to focus on the optical depth of galaxies to light from young stars.
The relative balance of dust heating by young and old stars in star-forming galaxies is a matter of some debate. One observational indicator of this balance is the temperature of the dust. Young stars in H ii regions heat up dust to relatively high temperatures (with a low 100µm to 60µm ratio of ). Older stars in the field, and far-ultraviolet (FUV) light from field OB associations (which have dispersed their natal clouds and so are relatively unattenuated in the FUV), heat the dust to much lower temperatures (100/60 ; see, e.g., Lonsdale Persson & Helou, 1987; Buat & Xu, 1996; Walterbos & Greenawalt, 1996). This difference between H ii region and diffuse dust temperatures leads to a wide range in 100µm/60µm on galaxy-wide scales, from for quiescent early-type spiral galaxies through to for the most intensely star-forming galaxies. This suggests that earlier types are influenced more by old stellar populations than later types; this is also supported by an analysis of far-IR (FIR) and H data by Sauvage & Thuan (1992). For a ‘median’ spiral galaxy, the ‘cold’ dust IR luminosity fraction is between 50% and 70% (Lonsdale Persson & Helou, 1987; Bothun, Lonsdale & Rice, 1989). Despite this domination by cooler dust, more recently it has been argued that the young, FUV-bright stars provide the dominant contribution to the IR flux (70%; see, e.g., Buat & Xu, 1996; Popescu et al., 2000; Misiriotis et al., 2001). This is because FUV light is absorbed much more efficiently than optical light per unit dust mass. Thus, for a ‘median’ spiral galaxy, the IR luminosity comes from three components in roughly equal amounts: of the IR is from warm dust heated by FUV light from intense SF in H ii regions, another is cold dust heated by optical photons from the old and young stellar populations, and the last of the IR is from cold dust heated by FUV light from OB associations in the field (Buat & Xu, 1996). This interesting issue is discussed further in §4.
Given the apparent dominance of young stars in determining the IR flux, it is appropriate to address the opacity of dust to light from young stars. Observationally, there is a strong but scattered correlation between galaxy luminosity ( mass) and dust opacity to UV or H light (Wang & Heckman, 1996; Adelberger & Steidel, 2000; Bell & Kennicutt, 2001; Hopkins et al., 2001; Sullivan et al., 2001; Buat et al., 2002). Low-luminosity galaxies () tend to have substantially less dust absorption and reddening than high-luminosity galaxies (). Furthermore, these papers demonstrate that low-luminosity galaxies have IR/FUV, meaning that the IR emission of low-luminosity galaxies misses most of the SF. In contrast, many high-luminosity galaxies have IR/FUV, implying that the IR may be a relatively good SF rate indicator in this case (Wang & Heckman, 1996; Buat et al., 2002, §2.4). This will have clear implications for IR-derived SF rates, and correlations involving IR luminosities, such as the radio–IR correlation. This paper explores these implications in detail.
1.1.2 Radio emission
Radio continuum emission from star-forming galaxies has two components: thermal bremsstrahlung from ionized Hydrogen in H ii regions (see, e.g., Caplan & Deharveng, 1986), and non-thermal synchrotron emission from cosmic ray electrons spiraling in the magnetic field of the galaxy (see, e.g., Condon, 1992, for an excellent review). Thermal radio emission has a spectrum , whereas non-thermal emission has a much steeper radio spectrum , where (however, note that can vary, and even can vary with frequency; Condon, 1992). Because of this difference in spectral shape, the relative contributions of the two emissions vary with frequency. At lower frequencies GHz non-thermal radiation tends to dominate (at 1.4 GHz, the ‘standard model’ of star-forming galaxies attributes typically 90% of the radio continuum flux of luminous spiral galaxies to non-thermal emission; Condon, 1992). Based on the standard model, thermal emission may dominate at frequencies GHz (see also Price & Duric, 1992). In addition, the relative fractions of thermal and non-thermal emission may depend on galaxy mass. Dwarf galaxies seem to have a lower non-thermal to thermal emission ratio than normal spiral galaxies (Klein, Wielebinski & Thuan, 1984; Klein, 1991; Klein et al., 1991; Price & Duric, 1992), although estimating the balance of thermal and non-thermal radio emission is painfully difficult, and can be uncertain for even well-studied galaxies at a factor of five level (Condon, 1992). This difference between dwarf and larger galaxies is often interpreted as a higher efficiency of cosmic ray confinement in physically larger (or more massive) galaxies (e.g., Klein, Wielebinski & Thuan, 1984; Chi & Wolfendale, 1990; Price & Duric, 1992). For interesting discussions about the relative balance of non-thermal and thermal emission see Condon (1992) and Niklas et al. (1997).
1.2 The Radio–IR correlation
Given the complexity of the emission mechanisms of radio continuum and IR light, it seems to be a miracle that the two fluxes are tightly correlated, with a scatter of only a factor of two. Yet, when examined closely, the radio–IR correlation betrays the richness of the astrophysics which determine galaxies’ radio and IR luminosities.
The slope of the radio–IR correlation seems to depend on galaxy luminosity. Samples which are richer in relatively faint galaxies () tend to have steep radio–IR correlations in the sense that and (e.g., Cox et al., 1988; Price & Duric, 1992; Xu et al., 1994), whereas samples with a better representation of highly luminous galaxies () tend to have slopes close to unity (e.g., Condon et al., 1991; Yun et al., 2001). The differing behavior of galaxies as a function of luminosity is beautifully illustrated in Fig. 5 of Yun et al. (2001) and Figs. 1 and 2 of Condon et al. (1991). In addition, the slope depends on the radio frequency. At low radio frequencies GHz the slope tends to be steeper than unity, whereas for higher frequencies the slope approaches unity (wonderfully illustrated in Fig. 2 of Price & Duric, 1992).
Workers in this field have typically sought to explain the luminosity-dependent slope in terms of heating of dust by older stellar populations, or non-thermal/thermal radio effects. Fitt et al. (1988) and Devereux & Eales (1989) both subtracted off plausible contributions from old stellar populations (using either FIR color or total IR luminosity as the constraint), which they found ‘linearized’ the radio–IR correlation. Condon et al. (1991) compared IR/radio with optical /radio, finding that IR-overluminous galaxies were overluminous in optical -band (Å), which was interpreted as indicating contributions from old stellar populations. Xu et al. (1994) presented a model which described the non-unity slope and some of the scatter of the radio–IR correlation in terms of the contributions of old stellar populations. Similarly, a number of studies have investigated the rôle of non-thermal/thermal emission on the radio–IR correlation. Price & Duric (1992) and Niklas (1997) find that thermal radio continuum (which directly reflects the SF rate) correlated linearly with the IR luminosity; however, non-thermal emission had a steeper correlation with IR luminosity with . Taken together, the steepening of the radio–IR correlation at low IR luminosities, and with decreasing radio frequency, have been interpreted as reflecting increasingly large contributions from old stellar population heating of the IR towards low IR luminosities, and non-thermal radio emission which is non-linearly related to the SF rate.
1.3 The goal of this paper
In contrast with the commonly accepted picture, I argue that these interpretations of the radio–IR correlation are incomplete because they neglect the effect of dust opacity on the IR emission of star-forming galaxies (note that Lisenfeld et al., 1996, briefly discussed the role of dust opacity, but not in a luminosity-dependent sense). The argument can be (but has not been, as yet) pieced together from results in the literature. Empirically, high-luminosity galaxies are optically thick to FUV light, and so their IR emission reflects the SF rate reasonably well. In contrast, low-luminosity galaxies have low IR/FUV; therefore, their IR emission underestimates the SF rate substantially (Wang & Heckman, 1996). Yet the radio–IR correlation is more or less linear (e.g., Yun et al., 2001). Therefore, the radio emission must be suppressed for low-luminosity galaxies. This offers independent support to the argument that low-luminosity galaxies tend to have substantially suppressed non-thermal radio emission (e.g., Klein, Wielebinski & Thuan, 1984; Klein, 1991; Price & Duric, 1992). Thus, the radio–IR correlation is linear not because both emissions reflect SF rate perfectly, but because both radio and IR emissions underestimate the SF rates of low-luminosity galaxies in coincidentally quite similar ways.
In this paper, I assemble a sample of star-forming galaxies with FUV, IR and radio data to quantitatively explore this basic argument for the first time. The result that low-luminosity galaxies have IR and radio emissions that underestimate their SF rates is not new (e.g., Wang & Heckman, 1996; Klein, Wielebinski & Thuan, 1984; Dale et al., 2001). However, the assembly of an extensive star-forming galaxy sample with FUV, IR and radio data, the quantitative exploration of the consequences of this result on the radio–IR correlation, and the presentation of SF rate calibrations which take into account this effect, are new.
The plan of this paper is as follows. I first investigate, in detail, dust opacity indicators, and trends in dust opacity with galaxy luminosity, in §2. The galaxy sample is also introduced there. In §3, the radio–IR correlation is constructed, and the effect of dust opacity on the radio–IR correlation is estimated. In §4, the effect of optical light from old stellar populations is discussed. In §5, deviations from the expected trends in the radio–IR correlation are used to investigate the relationship between radio emission and SF rate. In §6, new IR and radio SF rate calibrations are presented and discussed. In §7, I summarize the conclusions of this study. In Appendix A, the FUV, optical, IR and radio data are discussed in more detail, and I present a table of galaxy photometry. In Appendix B, I present and discuss in detail a model for a luminosity-dependent FUV optical depth. Sections 2.1–2.3, §4, and the appendices are less central to my discussion of IR/radio SF rates, and may be skipped by casual readers. A distance scale compatible with km s-1 Mpc-1 is assumed, and unless stated otherwise, I correct FUV and optical data for galactic foreground extinction using Schlegel et al. (1998).
2 Understanding Dust Opacity in the Local Universe
In order to understand the implications of a correlation between dust opacity and luminosity, it is important to understand both the overall amount of opacity and the increase in the amount of opacity with luminosity in the wavelength regions that contribute the most to the heating of dust. Radiative transfer modeling coupled with observations (e.g., Buat & Xu, 1996; Gordon et al., 2000) suggest that the bulk of the energy that goes into heating the dust comes from non-ionizing FUV light, between 1216Å and 3000Å. Clearly, then, the vital question that must be addressed is that of the optical depth of dust to FUV light in a wide range of galactic environments.
2.1 Estimating the FUV optical depth of galaxies
There are three established methods for estimating the FUV attenuation111Attenuation differs from extinction in that attenuation describes the amount of light lost because of dust at a given wavelength in systems with complex star/dust geometries where many classic methods for determining extinction, such as color excesses, may not apply. in star-forming galaxies.
-
•
UV spectral slopes were found to correlate strongly with optical and FUV extinction, as estimated using a variety of observational techniques, for starburst galaxies (Calzetti et al., 1994, 1995; Meurer, Heckman, & Calzetti, 1999). Because of its observational efficiency, this method has been extensively utilized at high redshift (see, e.g., Adelberger & Steidel, 2000, and references therein). However, it has recently been shown that UV spectral slopes are poor attenuation indicators for other types of galaxy (Bell, 2002; Goldader et al., 2002). Thus, I will not use this indicator in this paper.
-
•
Total Hi and/or H2 column density has been used to estimate dust content, and therefore FUV extinction (e.g., Buat, Deharveng & Donas, 1989). However, a number of factors, such as metallicity (through the dust-to-gas ratio), dust/star geometry, or extinction curve will introduce considerable scatter into any correlation between gas density and extinction. This was confirmed by Buat (1992) and Xu et al. (1997). Thus, I will not use gas density-derived extinctions in this paper.
-
•
The TIR/FUV ratio, where TIR is the total 8–1000µm luminosity and FUV at Å (in this particular case) is, in principle, an excellent indicator of the amount of FUV extinction. This indicator of the direct vs. obscured light from young stars is a robust estimator of the FUV attenuation , and is relatively unaffected by changes in dust extinction curve, star/dust geometry and SF history (Gordon et al., 2000). The main limitations of this method are i) that the rôle of older stellar populations in heating the dust is neglected (although it can be accounted for by using a more realistic method to estimate , such as the flux-ratio method; Gordon et al., 2000), and ii) that some asymmetric star/dust geometries affect TIR/FUV (e.g., for a system with a dust torus, TIR/FUV would overestimate the FUV extinction and total SF rate if viewed pole-on, and would underestimate the total SF rate if viewed edge-on). Despite its limitations, I will use this method in this paper, not least because a greater understanding of the IR emission is one of the central goals of this work. This attenuation indicator has been used extensively before by, e.g., Buat (1992), Adelberger & Steidel (2000), Buat et al. (2002), and Bell (2002), and is directly related to the IR excess of Meurer, Heckman, & Calzetti (1999).
2.2 The Sample

Because of my focus on exploring the rôle of dust opacity and its effects on the radio–IR correlation, I have selected a sample of 249 galaxies that for the most part have both FUV and IR luminosities in the literature. The sample properties, a more in-depth discussion of the systematic and random errors, and a table of the relevant data is presented in Appendix A. Here, I briefly discuss only the most important points.
Normal, star-forming spiral and irregular galaxies were taken from Rifatto, Longo & Capaccioli (1995b, 100 galaxies), the Far Ultraviolet Space Telescope (FAUST; Deharveng et al., 1994, 75 galaxies) and the Ultraviolet Imaging Telescope (UIT; Bell & Kennicutt, 2001, 37 galaxies). FUV flux uncertainties from Rifatto, Longo & Capaccioli (1995b) may be as large as 0.19 dex (larger galaxies, with substantially larger uncertainties, were removed from this sample). Flux uncertainties for galaxies from Deharveng et al. (1994) and Bell & Kennicutt (2001) are lower, dex. Intensely star-forming galaxies have also been added to the sample. Starbursting galaxies (Calzetti et al., 1994, 1995, 22 galaxies) have FUV fluxes from the International Ultraviolet Explorer (IUE). To limit the effects of aperture bias, I use only the FUV data for the 14 starburst galaxies with optical diameters . Eight larger starbursts are included in this study, but are assumed to have no FUV data (i.e. only the optical, IR and radio data are used). The typical measurement accuracy of the FUV fluxes is 0.08 dex; clearly, the systematic aperture bias is more of a concern. Seven ultra-luminous infrared galaxies (ULIRGs) (Goldader et al., 2002) were added to the sample, with a typical FUV accuracy of 0.12 dex. Eight Blue Compact Dwarves (BCDs) have been added to the sample also to check for consistency with other galaxy types (Hopkins et al., 2002). FUV fluxes are quoted at wavelengths within 100Å of 1550Å: the error introduced by assuming that they are all at 1550Å is %. In the remainder of this paper, these 1550Å fluxes are denoted as ‘FUV’ fluxes or ‘1550Å’ fluxes. Note also that galaxies classified as Seyferts in the NASA/IPAC Extragalactic Database have been removed from the sample.
IR data at 12–100µm was taken from the Infrared Astronomical Satellite (IRAS) for 245 galaxies, and is accurate to better than 20% in both a random and systematic sense (Rice et al., 1988; Soifer et al., 1989; Moshir et al., 1990; Tuffs et al., 2002). Total IR 8–1000µm (TIR) and 42.5–122.5µm (FIR) fluxes were derived from the IRAS data, and are accurate to 30% (see the discussion in Appendix A). In this paper, I adopt the TIR 8–1000µm fluxes, in order to more accurately probe the true relationship between the amount of light reprocessed by dust into the IR with the radio emission (e.g., Dale et al., 2001, find a ‘normal’ FIR-to-radio ratio for the starbursting SBS 0335052 but a large TIR-to-radio ratio because of a large population of hot dust). The 42.5–122.5µm FIR fluxes are only used as a consistency check; all the results in this paper apply to both TIR and FIR fluxes, taking into account that FIR TIR (see Appendix A for more details).
Optical data were carefully taken from the literature, using the NASA/IPAC Extragalactic Database and NASA’s Astrophysics Data System. Optical data for 247 galaxies was taken from a variety of sources and is accurate to mag in most cases, and to mag in all cases. Radio data for 166 galaxies at 1.4 GHz were, for the most part, taken from the NRAO VLA Sky Survey (NVSS; Condon et al., 1998). NVSS data were taken for 159 galaxies from Condon et al. (2002), Hopkins et al. (2002), and Gavazzi & Boselli (1999a, b) in that order of preference. Additional data at frequencies between 1.4 and 1.5 GHz (translated to 1.4 GHz assuming a non-thermal spectrum) were taken from other sources for seven galaxies which were not in the above catalogs, but were important to have in the sample because of their properties (ULIRGs or interacting pairs), or because they had measured thermal radio fractions. The radio data were extensively and exhaustively cross-checked with many other radio catalogs, and were found to agree to within 20% in most cases. Galaxies with highly contentious radio fluxes (by more than a factor of three) were removed from the sample.
How does sample selection affect my results? Clearly, the sample is selected very inhomogeneously to have FUV, IR and (as much as possible) radio data. This makes the effects of sample selection difficult to assess. I would argue that the effects of sample selection are minimal in this paper, partially because of the inhomogeneously-selected sample. In particular, care was taken to include both normal and starbursting galaxies across a wide range in luminosities, limiting that particular source of bias. Furthermore, the trends (or lack thereof) explored in this paper are established over 4–5 orders of magnitude in galaxy luminosity, and are impressively quantitatively consistent with other datasets which were selected in totally independent ways (see, e.g., Wang & Heckman, 1996; Yun et al., 2001; Price & Duric, 1992). Taken together, this argues for a minimal rôle for selection effects in driving the results of this paper, although further work with independently-selected samples in the future (for example, from the Galaxy Evolution Explorer or Space Infrared Telescope Facility) will prove to be the ultimate test of selection effects and systematic error in this and other investigations of the radio–IR correlation.
2.3 Comparing TIR/FUV with H-derived extinctions

The crucial parameter of interest at this point is the opacity of dust to the FUV light of a given galaxy. Therefore, the vital question that must be addressed is to what level can IR/FUV be said to represent the true FUV opacity? This question is difficult to address directly; however, a number of papers have examined IR/FUV indirectly, in some detail. Meurer, Heckman, & Calzetti (1999) show that it correlates well with a number of other extinction indicators for starburst galaxies. Gordon et al. (2000) use radiative transfer models to show IR/FUV’s robustness at a theoretical level. Bell et al. (2002) shows that it correlates well with other extinction indicators for Large Magallanic Cloud H ii regions. Finally, Buat et al. (2002) show correlations between IR/FUV and Balmer-derived H attenuation, and show a relatively good correspondence between IRFUV SF rates and attenuation-corrected H-derived SF rates.
A galaxy’s true SF rate is impossible to measure without using detailed, complete stellar color-magnitude diagrams. Thus, I must approach this question using an indirect two-pronged approach (similar to that of Buat et al., 2002), where I inter-compare SF rate indicators. First, I compare H attenuation with TIR/FUV for galaxies with estimates of H attenuation as a sanity check. Then, I compare SF rates derived using extinction-corrected H against TIRFUV (essentially extinction-corrected FUV) to assess how well the SF rates match.
I derive H attenuations in two ways. i) The ratio of thermal radio to H light is a known constant, to first order, therefore deviations in that ratio give a robust constraint on the H attenuation. The thermal radio fraction is estimated by fitting the radio spectral energy distribution with contributions from thermal and non-thermal emission. However, the non-thermal emission dominates at most radio frequencies, making a robust and reliable determination of thermal radio flux highly challenging at this time (Condon, 1992). ii) The Balmer decrement (H/H) is again constant to first order in the absence of dust, and is easier to measure, but suffers from optical depth effects (see, e.g., Caplan & Deharveng, 1986; Bell & Kennicutt, 2001; Bell et al., 2002, for fuller discussions of these issues). Despite the substantial limitations of both techniques, I choose to compare the TIR and FUV with attenuations derived using both approaches because the goal is to assess the efficacy of TIR/FUV: corrupted H attenuation estimates will only make the TIR/FUV look worse.
I take Balmer decrements for 14 starburst galaxies with diameters from Calzetti et al. (1994), and supplemented these with Balmer decrement measurements for two of Goldader et al.’s ULIRGs (Wu et al., 1998). For normal galaxies, I use thermal radio-derived H extinctions, and some Balmer decrements which have been averaged over a number of H ii regions in each galaxy (taken from Bell & Kennicutt, 2001). Thermal radio fluxes were taken from Niklas et al. (1997) for 6 Rifatto et al. galaxies, and from Bell & Kennicutt (2001) for 12 UIT and two FAUST galaxies (most of their thermal radio fractions, were, in turn, from Niklas et al., 1997).
The results are shown in Fig. 1. Panel a) of Fig. 1 shows the comparison of H attenuation and TIR/FUV (this is similar to panel b) of Bell & Kennicutt’s (2001) Fig. 4, and Buat et al.’s (2002) Fig. 2). In common with those studies and Calzetti et al. (1994), I find that H attenuation and TIR/FUV are correlated with scatter, and that the H attenuation is of the FUV attenuation (though with much scatter). Note that the expectation from a dust foreground screen model is that H attenuation would be of the FUV attenuation. This discrepancy of a factor of two from the screen model is consistent with the interpretation of Calzetti et al. (1994), who postulate that nebular line emission is attenuated by roughly twice as much dust as the stellar continuum (see also Charlot & Fall, 2000).
Of course, it is not clear, a priori, what a correlation between H and FUV attenuations really tells us. One can easily imagine pathological dust geometries which will essentially decouple H and FUV attenuation. A complementary, and perhaps more stringent, test is to compare attenuation-corrected H-derived SF rates with SF rates determined from the combined TIRFUV emission (essentially the same as extinction correcting FUV with TIR/FUV). Statistically, these SF rates should be equal, even though the timescales of H and FUV emission differ by nearly an order of magnitude (5 Myr vs. 50 Myr). This comparison is conservative: although I know that the H extinction corrections are deficient in both random and systematic ways, I nevertheless attribute any mismatches to TIRFUV in an effort to constrain the accuracy of the TIRFUV methodology.
A comparison of TIRFUV SF rates and attenuation-corrected H-derived SF rates is shown in panel b) of Fig. 1. SF rates are estimated using the SF rate conversion factors given by Kennicutt (1998). Normal galaxies with thermal radio-derived H attenuations (circles) have statistically equal SF rates derived from the TIRFUV and H, with less than a factor of two scatter. Normal galaxies with Balmer-derived H attenuations (crosses) have statistically equal SF rates (TIRFUV vs. H) also, with a factor of 1.5 scatter. Starburst galaxies and ULIRGs (stars) have SF rates which are a factor of two higher in TIRFUV than in the Balmer attenuation-corrected H, with again less than a factor of two scatter. It is unclear, at this stage, why starbursting galaxies appear to have lower Balmer-corrected H-derived SF rates (compared to the TIRFUV case) than normal galaxies. This offset was also observed by Buat et al. (2002). This may be an aperture effect (FUV and extinction-corrected H are in the IUE aperture, whereas the TIR is total), although there is no trend in TIRFUV/H with galaxy size. Alternatively, it is possible that differences in star/dust geometry could cause an effect of this type (Buat et al., 2002), as there are strong suspicions that the star/dust geometries of the two galaxy types are different (Bell, 2002). It is also possible that integrated galaxy spectra (as used for starbursts and ULIRGs) systematically underestimate the true H attenuation because of radiative transfer effects and/or contamination from diffuse ionized gas. Without more Balmer decrement and thermal radio data for a reasonably-sized sample of starburst and normal galaxies it is impossible to unambiguously track down the origin of this factor-of-two discrepancy.
Either way, this comparison is extremely encouraging: assuming very conservatively that all of the scatter in TIRFUV vs. H SF rates is from the TIR and FUV (and not from the H extinction correction, intrinsic differences in FUV/H because of bursts of SF, mismatches in the FUV, IR and H SF rate calibrations, etc.), I find that TIR/FUV reflects the attenuation in the FUV to better than a factor of two in both a random and a systematic sense, and is perhaps much more accurate. 222Later on I examine the rôle of old stellar populations in heating the dust, correcting the TIR for a contribution from the optical band light from a galaxy. Including this effect in this analysis does not significantly affect the conclusions; TIR/FUV is still found to be a good attenuation indicator to much better than a factor of two in a systematic and random sense.
2.4 Trends in TIR/FUV
I have argued that TIR/FUV is the FUV attenuation indicator of choice on both modeling and observational bases. Now, following, e.g., Wang & Heckman (1996), Buat et al. (1999), and Adelberger & Steidel (2000) I proceed to explore TIR/FUV for my diverse sample of galaxies. I show the correlation between TIR/FUV and optical luminosity, and TIR/FUV and TIR luminosity, in panels a) and b) of Fig. 2. There is a scattered but strong correlation between the ratio of total TIR 8–1000µm to FUV (defined as at Å) and luminosity in either the optical band or in the IR.
The dotted lines encompass the majority of the points in panel a), and translate into panel b) using the least-squares regression of TIR on -band absolute magnitude: . The solid line shows a highly simplistic model which links -band luminosity and the optical depth of dust in the FUV. The main assumptions are that: i) the dust-to-gas ratio is proportional only to the metallicity, and ii) the dust optical depth is proportional to the dust per unit area, which therefore is proportional to the gas surface density. The dust optical depth increases with galaxy luminosity because of the typically higher gas densities and metallicities of more luminous galaxies. Curvature in the model behavior primarily comes from my somewhat crude derivation of the gas density–luminosity correlation (which is bootstrapped from the gas fraction–luminosity and stellar surface density–luminosity correlations). The model is discussed in more detail in Appendix B.
It is clear that TIR/FUV increases, on average, by over 1.5 orders of magnitude between low-luminosity galaxies at () and high-luminosity galaxies at (). These data are quantitatively consistent with (largely) independently-selected samples of galaxies (e.g., Wang & Heckman, 1996; Buat et al., 1999; Adelberger & Steidel, 2000). The main advantage of this sample is its size: it is slightly larger than the local samples of Wang & Heckman (1996), Buat et al. (1999), and Adelberger & Steidel (2000) combined. It is interesting to note that this increase in dust opacity is reasonably well-tracked, in the mean, by the simple model which was presented above. Furthermore, while TIR/FUV for most high-luminosity galaxies, for lower-luminosity galaxies TIR/FUV, meaning that many low-luminosity galaxies are optically thin in the FUV. Thus, the IR luminosity in low-luminosity galaxies will underestimate the SF rate substantially (remember that TIRFUV is not a bad proxy for SF rate; §2.3).
3 The Effects of Dust Opacity on the Radio–IR Correlation
Assuming that radio is a ‘perfect’ SF rate indicator (i.e. radio SF rate), the systematic depression of IR emission in low-luminosity galaxies should be easily visible in the radio–IR correlation, because of its tightness. In this section, I assess the effects of the optically-thin low-luminosity galaxies on the radio–IR correlation.
3.1 The Radio–IR correlation

The radio–IR correlation for all of the sample galaxies (plus BCDs from Hopkins et al., 2002, shown as open triangles, to check for consistency with other galaxy types) is shown in Fig. 3, where the TIR 8–1000µm extrapolated flux is being used. It is clear that the radio–IR correlation is both superbly tight (the scatter in the TIR/radio ratio is 0.26 dex, or less than a factor of two) and nearly linear. A forward fit, the ordinary least squares regression of TIR on radio, yields a slope of (this type of fit is suitable for, e.g., predicting the radio flux given the TIR flux). A bisector fit, the average of the forwards and backwards fits, yields a slope of (this type of fit is more suitable in cases where the intrinsic correlation is being sought, and measurement errors are dominated by intrinsic scatter; Isobe et al., 1990). These data are consistent with the much larger sample of 1809 galaxies studied by Yun et al. (2001): they recover a forward fit slope of and a scatter of 0.26 dex for a comparison of 60µm and 1.4 GHz fluxes. Furthermore, they find a tendency for low-luminosity galaxies to be somewhat underluminous in the radio, which I also recover (this is the main effect which drives the slightly steeper slope of the bisector fit).
A few points deserve mention at this stage. Firstly, there is a somewhat increased dispersion for very high luminosity galaxies. This is consistent with a number of other studies (e.g., Condon et al., 1991; Yun et al., 2001; Bressan et al., 2002) and is discussed later in §6.2. Secondly, I use TIR 8–1000µm extrapolated flux. In this respect, I differ from most other studies which plot either the 60µm luminosity (e.g., Yun et al., 2001), or the FIR 42.5–122.5µm luminosity (e.g., Cox et al., 1988; Condon et al., 1991; Xu et al., 1994). This difference in IR luminosity estimation technique does not change the slope or scatter of the radio–IR correlation significantly (the forward fit slope for the 60µm case is 1.010.04, 42.5–122.5µm case is 1.040.04, and the scatter is 0.25 dex in all cases).
3.2 Consequences of trends in IR/FUV with galaxy luminosity
A complementary way of examining the radio–IR correlation is by constructing the TIR/radio ratio . The quantity is defined as:
| (1) |
where is the 1.4 GHz radio flux (e.g., Condon et al., 1991). I define as the ratio of the total 8–1000µm IR luminosity to the radio power, as opposed to the 42.5–122.5µm FIR luminosity which is usually used in defining . The median value of is 2.640.02 for 162 galaxies with IR and radio data and no signs of AGN, and the scatter is 0.26 dex. For reference, the median value defined using the 42.5–122.5µm flux is 2.360.02, with a scatter of 0.26 dex, in excellent agreement with the mean of 2.340.01 and scatter of 0.26 dex of Yun et al. (2001).
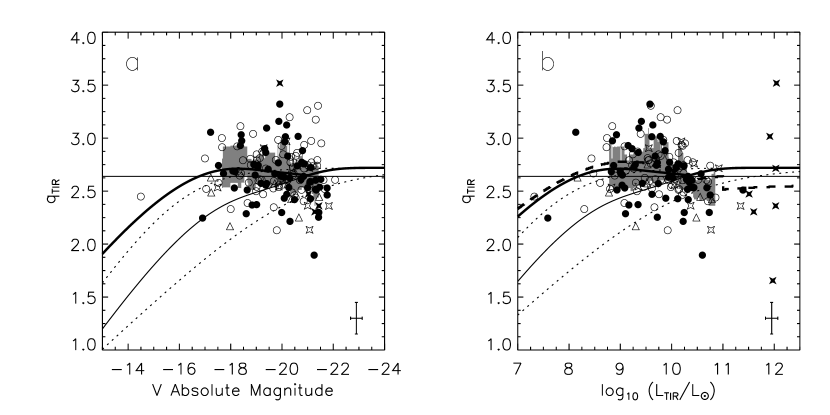
I show the trends in with galaxy luminosity in Fig. 4. Panel a) shows as a function of -band absolute magnitude, and panel b) shows against TIR luminosity. The shaded region shows the ‘running’ upper and lower quartiles of the data333For a given galaxy’s luminosity, the values of the 10 galaxies in the luminosity ranked list were extracted. The upper and lower quartile were calculated, and plotted as the shaded region.. There are only gentle trends, if any, in with galaxy luminosity, such that lower luminosity galaxies have somewhat higher values of (this is particularly visible in the –TIR luminosity relation). This slight tendency for lower-luminosity galaxies to have somewhat higher is what drives the slight non-linearity in the bisector fit of the radio–IR correlation, and was also seen by Yun et al. (2001) in their sample of 1809 galaxies.
This slight trend towards higher at lower luminosity, or lack of trend, is in stark contrast to the trends in which would be expected if radio were a perfect SF rate indicator. In Fig. 2, the dotted lines outlined the locus of the majority of the data points, and the solid line described the overall trend in TIR/FUV with galaxy luminosity reasonably well. The thin solid and dotted lines in Fig. 4 are the mapping of the trend in TIR/FUV with luminosity onto , assuming only that the radio SF rate (the details of the translation are discussed in Appendix B). If radio SF rate, then should decrease by at least 0.2 dex over the luminosity range over which there are decent statistics. This decrease is not seen: in fact, a slight increase in with decreasing luminosity is observed. Given i) the robustness of TIR/FUV as an attenuation indicator (§2.3) and ii) the strength of the trend in TIR/FUV (§2.4) and iii) the fact that this trend has been observed by many other workers (e.g., Wang & Heckman, 1996; Buat et al., 1999; Adelberger & Steidel, 2000), it is inescapable that must decrease with decreasing luminosity. The fact that it doesn’t is a clear argument that radio luminosity does not directly reflect SF rate.
4 The Contribution from Optical Light from Old Stars
There is an important source of uncertainty which has been neglected, however. While it is argued that the bulk of the light which is reprocessed into the IR comes from the FUV (Buat & Xu, 1996; Misiriotis et al., 2001), there is nonetheless the potential for a significant contribution from older stellar populations.
4.1 A simple model for IR emission
To decompose the IR emission of the sample galaxies into contributions from old and young stellar populations, I use a simple model to interpret the FUV, -band and IR data. In essence, the energy in the FUV, -band and IR is balanced (assuming a constant FUV to band dust opacity ratio) to estimate the fraction of FUV and band light reprocessed into the IR. Thus, this approach is conceptually similar to (but more simple than) the model explored by Buat & Xu (1996).
Simplistically, I assume that all of the light in the FUV comes from the young stellar population, and that all the light in the optical band comes from the older stellar population. I then link the optical depth in the band to the optical depth in the FUV; , where is a constant. For Milky-Way type dust and the Calzetti et al. (1994) attenuation curve the ratio between band optical depth and 1550Å optical depth is 0.4, and for Small Magellanic Cloud Bar-type dust the ratio is closer to 1/4. However, dust is preferentially clumped around younger stars (e.g., Calzetti et al., 1994; Zaritsky, 1999; Zaritsky et al., 2002), which would tend to decrease . Taken together, a value of is reasonable; I choose . Note that adopting a higher value of does not significantly affect any of my conclusions (the average contribution from -band light rises from 31% with a 16% scatter to 44% with a 18% scatter).
The observed luminosities are and , where is the observed monochromatic luminosity at a given wavelength. Given the above assumption that and denoting the FUV optical depth as for brevity, the intrinsic luminosities are related to the observed ones by and . Thus, the energy absorbed, and re-emitted into the IR is:
| (2) |
This equation was then solved using an IDL implementation of Brent’s method (Press et al., 1992, p. 352) to find the root of the equation, given the observed , and .
As examples, it is interesting to take S0–Sa galaxies and Scd–Sm galaxies from Popescu et al. (2002). Their S0–Sa template has a FUV::TIR ratio of 1:25:3 (roughly), corresponding to a fraction from band light of 86% (calculated by multiplying the luminosity by , and dividing by the sum of itself and the FUV flux; in this case ). In contrast, their Scd–Sm template has a FUV::TIR ratio of 1:2:1, corresponding to a fraction from band light of 33%. Notwithstanding the fact that not all band light is generated by old stellar populations, this simple analysis fits in well with what is known about the relative old stellar heating fraction as a function of galaxy type (e.g., Sauvage & Thuan, 1992).
4.2 Comparison with dust temperatures


It is instructive to compare the fraction of which is plausibly associated with old stellar populations (by comparison of the amount of optical, FUV and TIR light) with the dust temperatures (which are often used as indicators of the contribution of older stellar populations to the IR luminosity). In Fig. 5, it is clear that there is a scattered correlation between the fraction of the which is from optical light (which I associate then with old stellar populations) and the 100µm-to-60µm flux ratio (where both are expressed as flux per unit frequency). Galaxies with rather larger contributions from -band light tend to have somewhat larger 100/60 than galaxies with a small contribution from -band light.
It is interesting to estimate the fraction of IR light from old stellar populations which is implied by the 100/60 observations. Estimation of a total fraction of the 8-1000µm luminosity from old stars using the FIR color-based technique is challenging, because of the contributions from the mid-infrared and from wavelengths longer than : thus I show the contributions at 60µm (dotted line) and 100µm (solid line) from the old population as a rough guide. The cold population was assumed to have 100/60 of 10, and the warm dust a 100/60 of 1, following Fitt et al. (1988). Fig. 5 shows that there is good overall agreement between the expectations of the FUV/optical/TIR energy balance estimate of the contribution of old stellar populations, and the FIR color. Interestingly, this method independently gives further credence to FIR color-based analyses, at least at the factor-of-two level.
4.3 Correcting for the contribution of old stars as a function of luminosity
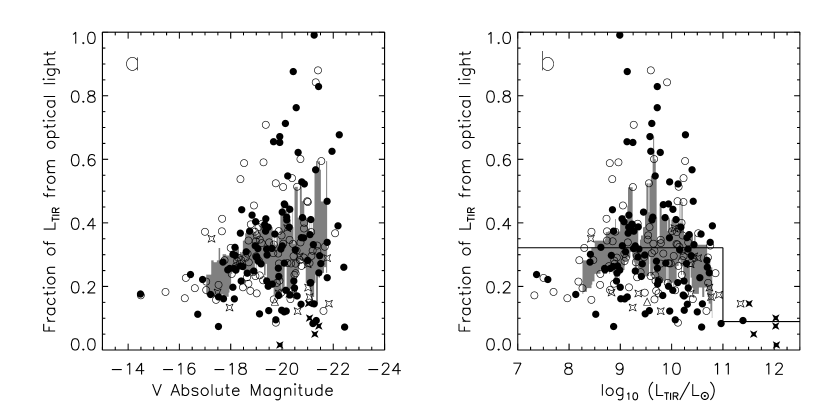
I show trends in the contribution to made by old stellar populations as a function of -band and TIR luminosity in panels a) and b) of Fig. 6 respectively. It is clear that the scatter in the contribution of old populations is large at most galaxy luminosities. However, in panel a) of Fig. 6 there is a clear general trend of increasing old stellar population contribution with increasing -band luminosity (albeit with large scatter). One could argue that this trend is a selection effect as galaxies with larger -band luminosity may have larger -band/FUV luminosity, and therefore have a larger old fraction. However, the correlation between old fraction and dust temperature (Fig. 5) argues against this interpretation, as the trend in old fraction would persist even if 60/100 were shown against -band luminosity (these are, of course, independent). Thus, this reflects the real and well-known observation that more optically-luminous galaxies tend to have rather older stellar populations, in the mean (e.g., Peletier & de Grijs, 1998; Bell & de Jong, 2000; Boissier et al., 2001; Kauffmann et al., 2003b).
Panel b) of Fig. 6 shows the fraction of from old stellar populations against TIR luminosity. At very low luminosities, the old fraction increases with increasing galaxy luminosity. However, at the old fraction decreases with increasing . This reflects the increasing fraction of dusty, intensely star-forming galaxies towards the highest . The scatter around this general behavior is large, however.
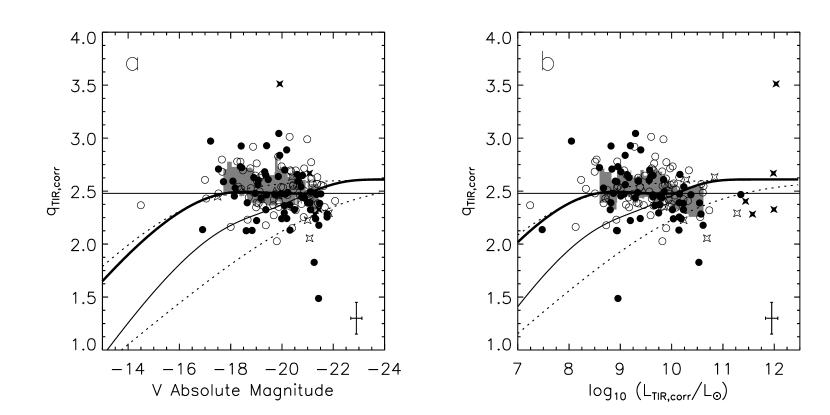
In Fig. 7 I show the effect that the old stellar population correction has on trends in TIR/FUV with galaxy luminosity. There are some modest changes: as expected, the trend in TIR/FUV with -band luminosity slightly flattens. However, on the whole, there is very little change in TIR/FUV with luminosity. This is, to a certain extent, for an obvious reason. A 30% change in TIR luminosity is not going to significantly affect a trend which sees a factor of increase in TIR/FUV with a factor of 1000 luminosity increase. In order to significantly affect this trend, the old fraction would have to increase from essentially 0 to % over the luminosity range of interest, with relatively little scatter. This kind of behavior is clearly ruled out by the observations. Thus, the conclusion that dust opacity should leave an easily observable signature in the radio–IR correlation remains unchanged.
I check this directly in Fig. 8. When corrected for the contribution of older stellar populations, decreases by a median amount of 0.16 dex while the scatter decreases slightly to 0.25 dex. The relative constancy of with luminosity persists (compare Figs. 4 and 8). Again, there is a slight hint of a slightly higher for lower-luminosity galaxies. Also, the ‘bump’ in at which was reasonably apparent in panel b) of Fig. 4 has been largely eliminated by the correction for the old stellar population. This ‘bump’ was from a larger old fraction in earlier-type galaxies with reasonably high -band luminosities but lower SF rates (see panel b) of Fig. 6). At lower luminosities, later-types dominate, and at higher IR luminosities, ULIRGs and star-bursting galaxies tend to dominate. Thus, the reasonably complete removal of this ‘bump’ feature can be taken as independent evidence that the correction for the effects of older stellar populations is doing its job reasonably well.
It is clear then that neither the TIR/FUV vs. luminosity correlation nor the vs. luminosity correlation are significantly affected by the contribution of old stellar populations. Furthermore, this conclusion does not depend on the technique used to estimate the contribution from the old stellar populations, as demonstrated by the correlation between 100/60 and the fraction of light from -band light.
5 Understanding the Radio Emission from Galaxies
In §§3 and 4, I demonstrated that, if radio emission SF rate, then the TIR-to-radio ratio should decrease by at least a factor of two when going from to galaxies, owing to the effects of dust optical depth. Furthermore, accounting for old stellar populations does not affect this result. One is therefore left in the situation where a factor-of-two offset has to be there, but it isn’t seen. This implies that the radio emission of low-luminosity galaxies is suppressed, by at least a factor of two.
Furthermore, it is the non-thermal radio emission which must be suppressed in low-luminosity galaxies. The radio emission from normal (non-active) galaxies comes from two sources. Thermal radio emission from ionized hydrogen directly tracks the SF rate (because the amount of ionized hydrogen reflects the ionizing luminosity of the very young stellar populations which are rich in massive stars). In contrast, it has been suggested for nearly 20 years that the non-thermal synchrotron emission of low-luminosity galaxies can be significantly suppressed (Klein, Wielebinski & Thuan, 1984; Klein, 1991; Klein et al., 1991; Price & Duric, 1992, although the thermal contribution can be very challenging to reliably estimate; Condon 1992). This can be explained in a number of ways, as the physics which links the SF rate with non-thermal emission is complex, and involves the cosmic ray production rate, galaxy magnetic field strength, and galaxy size to name just a few of the many variables (Chi & Wolfendale, 1990; Helou & Bicay, 1993; Lisenfeld et al., 1996). For example, Chi & Wolfendale (1990) discuss a model in which the non-thermal emission from low-luminosity galaxies is strongly suppressed, because most of the cosmic-ray electrons escape from the galaxy due to their small sizes (although the size of the effect that they predict is a factor of 3–5 in excess of the trend allowed by these observations).
Because of the complex and uncertain physics involved, I do not attempt to construct detailed theoretical model for the non-thermal radio emission. Rather, I use the data to guide me in constructing how non-thermal radio emission must track the SF rate (cf. Price & Duric, 1992). I parameterize the total radio emission as , where is the radio flux at 1.4 GHz, is the SF rate, is the constant of proportionality linking the SF rate and radio flux for galaxies, and is the relative amount of non-thermal emission. For a galaxy, 90% of the radio flux at 1.4 GHz is non-thermal (Condon, 1992), and 10% is thermal (which gives the value of 0.1). I allow to decrease as a function of galaxy luminosity:
| (3) |
where is taken to be . The resulting relationship between and luminosity is shown in Figs. 4 and 8 as thick solid lines: this variation in non-thermal radio emission accounts reasonably well for the lack of a trend in with luminosity.
Remarkably, given the uncertainties inherent to decomposing the contribution of thermal/non-thermal emission from radio spectra alone, the kind of suppression of non-thermal radio emission which is required to produce a luminosity-independent is consistent with an independent analysis by Price & Duric (1992). They used multi-frequency radio data to construct the radio–IR correlation at a number of frequencies. They found that the radio–IR correlation at high frequency (where thermal radio emission dominates) was nearly linear, and the radio–IR correlation at lower frequencies (where non-thermal emission dominates) was steeper. They suggested that thermal emission the SF rate , but suggested that non-thermal emission . Thus the non-thermal-to-SF rate ratio varied as . Thus, for a decrease in galaxy luminosity by a factor of 100, the non-thermal-to-SF rate ratio decreases by a factor of 2.5. Equation 3 predicts a factor of 3 decrease in the non-thermal-to-SF rate ratio for the same luminosity range. Thus, the conclusion that low-luminosity galaxies have lower non-thermal contributions has been established in two independent ways: through multi-frequency radio observations (e.g., Klein et al., 1991; Price & Duric, 1992, which, however, depend on uncertain radio spectral fitting) and through a lack of curvature in the radio–IR correlation (this work, which does not depend on the fitting of radio spectra in any way).

A prediction of this model is an overall correlation between galaxy luminosity and thermal radio fraction. Testing this prediction in detail is challenging because of observational difficulties. Typically, four or five radio fluxes at a range of frequencies are used to derive a non-thermal slope (which may, itself, vary with radio frequency; Condon, 1992) and thermal fraction, as well as the overall normalization (Condon, 1992; Niklas et al., 1997). These difficulties lead to a large uncertainty in the thermal fraction, which for the well-documented case of M82, leads to a factor of five discrepancy between different estimates of thermal fraction (Condon, 1992). Notwithstanding these difficulties, I plot my prediction for thermal radio fraction from Equation 3 against observed thermal radio fractions for my sample galaxies and a further dozen non-active galaxies from the Klein et al. (1991) and Niklas et al. (1997) in Fig. 9. Clearly, most of the thermal fraction determinations are for galaxies within 1 magnitude of , and are consistent with a value of 0.1 (as argued by Condon, 1992). There are only a few low-luminosity galaxies in this sample, and they have a large scatter between thermal fractions of 0.1 and 1. This huge scatter should not be over-interpreted, as there are hints that it is largely intrinsic. For example, Yun et al. (2001) show that the scatter at the low-luminosity end of the radio–IR correlation is larger than for galaxies, and it is not unreasonable to attribute some of that scatter to the radio (and therefore non-thermal) flux.444I do not see this effect in Figs. 3, 4 or 8, which is likely due to small number statistics. Given the modest sample size, the observational difficulty, and possibly substantial intrinsic scatter it is fair to say that my non-thermal radio calibration is not inconsistent with the thermal radio fraction data, and is strongly supported by the linearity of the radio–IR correlation and the frequency dependence in the radio–IR correlation as reported by Price & Duric (1992).
6 Discussion
6.1 Implications for Radio- and IR-derived SF rates
In this paper, I have brought together a diverse and wide range of literature data and interpretation into a coherent picture. On one hand, I examine the luminosity dependence in FUV (e.g., Wang & Heckman, 1996; Buat et al., 1999; Adelberger & Steidel, 2000; Buat et al., 2002) and H attenuation (e.g., Hopkins et al., 2001; Sullivan et al., 2001), showing that low luminosity galaxies with are optically-thin in the FUV, whereas galaxies are optically-thick in the FUV (this result is robust to the inclusion of the effects of old stellar populations). On the other hand, I show that the radio–IR correlation is nearly linear (e.g., Yun et al., 2001), and shows no sign of the expected depression of the TIR luminosity of the largely optically-thin dwarf galaxies. This means that the radio is also suppressed in dwarf galaxies (cf. Klein, 1991). Since the thermal radio emission SF rate, the non-thermal must depend non-linearly on SF rate: Price & Duric (1992) find that non-thermal radio emission , which is consistent with my data. Thus, the radio–IR correlation is linear not because both radio and IR emissions track SF rate, but rather because both radio and IR emissions fail to track SF rate in independent, but coincidentally quite similar, ways.
In this section, I use this increased understanding of the radio–IR correlation to derive TIR and radio SF rate calibrations which take into account the broad-brush suppression of TIR and radio emission from low-luminosity galaxies. Furthermore, because the scatter in TIR/FUV and are well-characterized, the scatter in these SF rate calibrations will be quantified. For the purposes of a simple-to-apply SF rate calibration, and given that the scatter in FUV opacity and at a given luminosity is considerable, it is sufficient to calibrate for first-order variations in opacity and non-thermal radio emissivity in a very simple fashion (not using, e.g., the model for dust opacity developed in Appendix B). Furthermore, I will present calibrations of the SF rates simply in terms of the TIR or radio luminosity. This allows workers to derive SF rates from one flux alone while still being able to account for the reduced efficiency of TIR and radio emission from low-luminosity galaxies. If more luminosities are available (e.g. TIR, radio, optical and FUV), then a fuller analysis of the data would clearly prove superior to these simple-minded calibrations.
6.1.1 Calibrating IR-derived SF rates
In §2.3, I showed that attenuation-corrected H-derived SF rates and TIRFUV SF rates were consistent to at least a factor of two, when the SF rate calibrations of Kennicutt (1998) were adopted. Thus, I adopt the ‘starburst’ calibration of IR luminosity presented by Kennicutt (1998) for luminous galaxies. A reasonably acceptable fit to panel b) of Figs. 2 and 7 is TIR/FUV. Thus, adopting a Salpeter IMF from 0.1 to 100 following Kennicutt (1998), the SF rate is:
| (4) |
where is in solar luminosities and is calculated between 8–1000µm (where I have adopted a solar luminosity of W). Note however that there is a dex scatter about this correlation, which will translate into % scatter in the SF rate calibration at , and a % scatter at .
This calibration does not account for contributions from old stellar populations. Fig. 6 demonstrates that a correction for old stellar populations will be statistical at best. However, it is possible to correct for the mean contribution from old stellar populations in a relatively robust manner. At TIR luminosities , the mean fraction and scatter are 32% 16%, and the mean fraction and scatter are 9% 5% at TIR luminosities (see the solid line in panel b) of Fig. 6). Thus, the final calibration, correcting for old stellar populations, is:
| (5) |
Expected scatter around this correlation is at least 50% at , and 25% at . There are data down to ; however, this calibration should be applied with extreme caution at such low luminosities because of the extrapolation involved. There may be as much as a factor of two uncertainty globally, although the overall calibration uncertainty is probably somewhat less (see §2.3). Obviously, there will be uncertainties because of IMF, etc. (see Kennicutt, 1998, for more discussion). It is important to realize that this calibration is certainly suspect on a galaxy-by-galaxy basis: indeed, Fig. 6 shows that there are galaxies with anywhere between 1% and 99% of their IR emission from old stellar populations.
It is interesting to note in passing that the above calibration is within a factor of two of a constant TIR conversion factor of for galaxies with luminosities in excess of . On one hand, the SF rate calibration is reduced by 10%–30% by the contribution of old stellar populations. However, on the other hand, the reduction in dust opacity with decreasing luminosity cancels out the effects of old stellar populations to first order until one reaches luminosities , where the opacity is so low that the heating of dust by old stars does not significantly help. This argument was essentially made by Inoue (2002) from a more model-based standpoint.
6.1.2 Calibrating Radio-derived SF rates
In order to calibrate the radio flux in terms of SF rates, it is necessary to i) estimate the zero point of the SF rate scale, and ii) estimate the effect of increased suppression of non-thermal radio emission for low-luminosity galaxies, making sure to re-cast the result in terms of radio flux.
Following the above, I make the assumption that galaxies lose no cosmic rays, and have non-thermal radio emission that directly tracks the SF rate. Thus, I choose to calibrate the radio SF rate to match the TIR SF rate for galaxies. The geometric mean radio power per solar luminosity of TIR for galaxies is W Hz-1 , corresponding to a of 2.52. Thus, in the limit of high SF rate, a radio flux at 1.4 GHz of W Hz-1 is predicted per . This is around a factor of two higher than the Milky Way-normalized radio SF rate calibration of Condon (1992) adapted to my adopted IMF (Haarsma et al., 2000), which is well within the factor-of-two uncertainties in the assumptions underpinning the two independent calibrations (Condon et al., 2002, also found this offset between TIR-normalized and Milky Way-normalized radio SF rate calibrations).
Adopting this zero point and the variation in non-thermal radio emission from Equation 3:
| (6) |
where W Hz-1 is the radio luminosity at 1.4 GHz of a galaxy (, or ). The scatter in of 0.26 dex implies a factor-of-two uncertainty in the application of this calibration on a galaxy-by-galaxy basis. The increased scatter for both very high and very low luminosity galaxies (Fig. 3 and Yun et al., 2001, respectively) implies somewhat larger uncertainties for very high and very luminosity galaxies, perhaps as large as a factor of 5, to be conservative. Furthermore, the data run out at luminosities below W Hz-1; this calibration should be used with extreme caution below this luminosity. An idea of the systematic calibration uncertainty is given by the factor of two offset between my and Condon’s overall zero point.
The expected radio–IR correlation, and expected trends in with IR luminosity as given by these TIR and radio calibrations are shown as the thick dashed lines in Figs. 3 and 4. It can be seen that the above calibrations produce a nearly linear radio–IR correlation, while fully taking into account the non-linear effects of dust opacity, old stellar populations and the non-linear dependence of non-thermal radio flux on SF rate, at least over the range over which I have data.
6.1.3 A Pinch of Salt
It is worth discussing briefly some of the limitations and caveats of the above SF rate calibrations (Equations 5 and 6).
-
•
AGN were explicitly excluded from this sample. Obviously, IR and radio luminosities will overestimate the SF rate if any calibration is blindly applied to samples of galaxies which contain AGN.
-
•
The scatter in the above calibrations is at the factor-of-two level in terms of both systematic and random errors. Furthermore, individual galaxies can deviate substantially from the mean behavior (e.g., galaxies with 99% of their IR reprocessed from the optical, or low-luminosity galaxies with thermal radio fractions which scatter considerably from the expected trend). Thus, these calibrations should not blindly be applied on an individual galaxy basis. A comprehensive multi-wavelength analysis is required to significantly constrain the SF rate of an individual galaxy.
- •
-
•
Blind application of these calibrations as a function of lookback time may be inappropriate. For example, it is uncertain how dust opacity, the contribution of old stellar populations to dust heating, or cosmic ray retention depend on redshift. In this context, comprehensive multi-wavelength SF rates from a variety of sources (such as the rest-frame FUV, optical emission lines, IR and radio) may help to reduce the unavoidable systematic uncertainties that plague these kinds of analyses.
6.2 Increased Scatter at Low and High IR Luminosities
I found that there was an increased scatter in the radio–IR correlation at high IR luminosities (Fig. 3, and Yun et al., 2001). In addition, low IR luminosity galaxies tend to scatter more around the radio–IR correlation (e.g., Condon et al., 1991; Yun et al., 2001), although this dataset does not show this effect, perhaps because of small number statistics. This increase in the scatter is intrinsic: the errors are smaller than the scatter of the data.
Bressan et al. (2002) recently discussed the increase of scatter for intensely star-forming, high IR luminosity galaxies. They presented a comprehensive model which includes stellar population synthesis, dust radiative transfer, and a simplified model of radio emission from cosmic rays generated by supernovae. They predict a strong evolution in IR-to-radio ratio with time after an intense burst of star formation: essentially, the timescale for IR emission is shorter than the timescale for radio emission, leading to variations with a total range of over yr timescales. This scatter matches well the observed scatter in ULIRGs.
An increased scatter at lower luminosities could partly be due to optical depth effects: low-luminosity galaxies are largely transparent in the FUV, meaning that changes in dust opacity translate directly into large changes in . However, a number of recent studies (e.g., Dohm-Palmer et al., 1998; Sullivan et al., 2000; Kauffmann et al., 2003a) have suggested significant variations in SF rate over yr timescales for at least some lower-luminosity galaxies. These variations would lead to scatter in , from mismatches between the IR and radio emission timescales (Bressan et al., 2002). Interestingly, these variations in SF rate would lead to significant variation in the thermal radio fraction (see Fig. 5 of Bressan et al., 2002), as the thermal radio emission tracks the SF rate over Myr timescales, whereas the non-thermal emission arguably tracks the SF rate over yr timescales. This could well explain much of the scatter seen by Yun et al. (2001) at low luminosities, and underlines the need for thermal radio fractions for a large sample of low-luminosity star-forming galaxies.
7 Conclusions
I have assembled a diverse sample of galaxies from the literature with FUV, optical, IR and radio luminosities to explore the calibration of radio- and IR-derived SF rates, and the origin of the radio–IR correlation. My main conclusions are as follows.
In order to establish the efficacy of IR/FUV as an extinction indicator, I compare H and 8–1000µm TIR/FUV properties of a subsample of my galaxies. I find that H and FUV attenuations loosely correlate with each other, with the H attenuation being roughly half of the FUV attenuation. A foreground screen model would predict an offset of a factor of a quarter. This lends support to the claim of Calzetti et al. (1994) that the nebular extinction is roughly twice that of the stellar population of the galaxy. Furthermore, when SF rates derived from TIRFUV and attenuation-corrected H are compared, I find that they agree to better than a factor of two (random and systematic). This strongly argues that TIR/FUV will give FUV attenuation estimates which are accurate to a factor of two, and probably much better.
Having established the efficacy of TIR/FUV as a FUV attenuation indicator, I explored trends in TIR/FUV with galaxy luminosity. This ratio increases on average by over a factor of 30 between low-luminosity galaxies () and high-luminosity galaxies (). Low-luminosity galaxies have TIR/FUV, meaning that they are optically thin in the FUV. Interestingly, the gross, overall trend in TIR/FUV is naturally interpreted in terms of increasing gas surface density and galaxy metallicity with increasing galaxy mass.
Like Yun et al. (2001), I find a nearly linear radio–IR correlation, with perhaps a slight tendency for faint galaxies to have a somewhat higher TIR-to-radio ratio than brighter galaxies. However, the strong and robust increase in TIR/FUV with luminosity would, if radio were a perfect SF rate indicator, produce a clear and easily measurable decrease in for fainter galaxies. The data show the opposite (or no) trend, clearly demonstrating that radio is not a perfect SF rate indicator. Accounting for the effects of older stellar populations using a simple FUV/optical/IR energy balance model (which is consistent with FIR color-based methods) does not change this key result.
In order to cancel out the trend in from optical depth effects, the non-thermal emission must be suppressed by about a factor of 2–3 in galaxies relative to galaxies. This result was also reached independently, using a totally different dataset and method, by Price & Duric (1992). Thus, the linearity of the radio–IR correlation is a conspiracy: both radio and IR underestimate the SF rate for low-luminosity galaxies.
I present SF rate calibrations which simultaneously reproduce the linearity of the radio–IR correlation, and take account of the reduced non-thermal and IR emission in lower-luminosity galaxies. However, there is considerable scatter in the SF rate calibrations, which can exceed a factor two at low galaxy luminosities. This highlights the possible influence of selection effects in interpreting the IR or radio emission from distant galaxies. Another challenge for those wishing to estimate the SF rates of distant galaxies is the non-trivial physics that links IR/radio and SF rate. For example, the evolution of dust opacity, the importance of old stellar populations, and the evolution of the efficiency of cosmic ray confinement are all essentially unconstrained as a function of lookback time. This adds considerable systematic uncertainty to our understanding of galactic SF rates in the distant Universe.
References
- Adelberger & Steidel (2000) Adelberger, K. L., & Steidel, C. C. 2000, ApJ, 544, 218
- Becker, White & Helfand (1995) Becker, R. H., White, R. L., Helfand, D. J. 1995, ApJ, 450, 559
- Bell (2002) Bell, E. F. 2002, ApJ, 577, 150
- Bell & de Jong (2000) Bell, E. F., de Jong, R. S. 2000, MNRAS, 312, 497
- Bell & Kennicutt (2001) Bell, E. F., & Kennicutt Jr., R. C. 2001, ApJ, 548, 681
- Bell et al. (2002) Bell, E. F., Gordon, K. D., Kennicutt Jr., R. C., Zaritsky, D. 2002, ApJ, 565, 994
- Blain et al. (1999) Blain, A. W., Smail, I., Ivison, R. J., & Kneib, J.-P. 1999, MNRAS, 302, 632
- Boissier et al. (2001) Boissier, S., Boselli, A., Prantzos, N., Gavazzi, G. 2001, MNRAS, 321, 733
- Bothun, Lonsdale & Rice (1989) Bothun, G. D., Lonsdale, C. J., Rice, W. 1989, ApJ, 341, 129
- Bottinelli et al. (1984) Bottinelli, L., Gougenheim, L., Paturel, G., de Vaucouleurs, G. 1984, A&AS, 56, 381
- Bottinelli et al. (1986) Bottinelli, L., Gougenheim, L., Paturel, G., Teerikorpi, P. 1986, A&A, 156, 157
- Bressan et al. (2002) Bressan, A., Silva, L., Granato, G. L. 2002, A&A, 392, 377
- Buat (1992) Buat, V. 1992, A&A, 264, 444
- Buat & Xu (1996) Buat, V., Xu, C., 1996, A&A, 306, 61
- Buat, Deharveng & Donas (1989) Buat, V., Deharveng, J. M., Donas, J. 1989, A&A, 223, 42
- Buat et al. (1999) Buat, V., Donas, J., Milliard, B., Xu, C. 1999, A&A, 352, 371
- Buat et al. (2002) Buat, V., Boselli, A., Gavazzi, G., Bonfanti, C. 2002, A&A, 383, 801
- Calzetti et al. (1994) Calzetti, D., Kinney, A. L., Storchi-Bergmann, T. 1994, ApJ, 429, 582
- Calzetti et al. (1995) Calzetti, D., Bohlin, R. C., Kinney, A. L., Storchi-Bergmann, T., Heckman, T. M. 1995, ApJ, 443, 136
- Caplan & Deharveng (1986) Caplan, J., Deharveng, L. 1986, A&A, 155, 297
- Charlot & Fall (2000) Charlot, S., Fall, S. M., 2000, ApJ, 539, 718
- Chi & Wolfendale (1990) Chi, X., Wolfendale, A. W. 1990, MNRAS, 245, 101
- Clemens, Alexander & Green (1999) Clemens, M. S., Alexander, P., Green, D. A. 1999, MNRAS, 307, 481
- Condon (1992) Condon, J. J., 1992, ARA&A, 30, 575
- Condon et al. (1991) Condon, J. J., Anderson, M. L., Helou, G. 1991, ApJ, 375, 95
- Condon et al. (1998) Condon, J. J., Cotton, W. D., Greisen, W., Yin, Q. F., Perley, R. A., Taylor, G. B., Broderick, J. J. 1998, AJ, 115, 1693
- Condon et al. (2002) Condon, J. J., Cotton, W. D., Broderick, J. J. 2002, AJ, 124, 675
- Cox et al. (1988) Cox, M. J., Eales, S. A., Alexander, P., Fitt, A. J. 1988, MNRAS, 235, 1227
- Dale et al. (2001) Dale, D. A., Helou, G., Neugebauer, G., Soifer, B. T., Frayer, D. T., & Condon, J. J. 2001, AJ, 122, 1736
- Deharveng et al. (1994) Deharveng, J. M., Sasseen, T. P., Buat, V., Bowyer, S., Lampton, M., Wu, X., 1994, A&A, 289, 715
- de Jong & Lacey (2000) de Jong, R. S., Lacey, C. 2000, ApJ, 545, 781
- de Jong et al. (1985) de Jong, T., Klein, U., Wielibinski, R., Wunderlich, E. 1985, A&A, 147, L6
- de Vaucouleurs & Longo (1988) de Vaucouleurs, A., Longo, G. 1988, Catalogue of visual and infrared photometry of galaxies from 0.5 micrometer to 10 micrometer (1961–1985) (Austin, University of Texas)
- de Vaucouleurs et al. (1991) de Vaucouleurs, G., de Vaucouleurs, A., Corwin Jr., H. G. Buta, R. J., Paturel, G., Fouque, P., 1991, Third Reference Catalogue of Bright Galaxies, version 3.9 (New York, Springer Verlag) (RC3)
- Devereux & Eales (1989) Devereux, N. A., Eales, S. A. 1989, ApJ, 340, 708
- Dohm-Palmer et al. (1998) Dohm-Palmer, R. C., et al. 1998, AJ, 116, 1227
- Doublier et al. (1997) Doublier, V., Comte, G., Petrosian, A., Surace, C., Turatto, M. 1997, A&AS, 124, 405
- Ekholm et al. (2000) Ekholm, T., Lanoix, P., Teerikorpi, P., Fouqué, P., Paturel, G. 2000, A&A, 355, 835
- Ferreras & Silk (2001) Ferreras, I., Silk, J. 2001, ApJ, 557, 165
- Fitt et al. (1988) Fitt, A. J., Alexander, P., Cox, M. J. 1988, MNRAS, 233, 907
- Flores et al. (1999) Flores, H., et al. 1999, ApJ, 517, 148
- Garcia-Barreto et al. (1995) Garcia-Baretto, J. A., Franco, J., Guichard, J., Carrillo, R. 1995, ApJ, 451, 156
- Gavazzi & Boselli (1996) Gavazzi, G., Boselli, A. 1996, ApL&C, 35, 1
- Gavazzi & Boselli (1999a) Gavazzi, G., Boselli, A. 1999a, A&A, 343, 86
- Gavazzi & Boselli (1999b) Gavazzi, G., Boselli, A. 1999b, A&A, 343, 93
- Gavazzi et al. (1999) Gavazzi, G., Boselli, A., Scodeggio, M., Pierini, D., Belsole, E. 1999, MNRAS, 304, 595
- Goldader et al. (2002) Goldader, J. D., Meurer, G., Heckman, T. M., Seibert, M., Sanders, D. B., Calzetti, D., Steidel, C. C. 2002, ApJ, 568, 651
- Gordon et al. (2000) Gordon, K. D., Clayton, G. C., Witt, A. N., Misselt, K. A. 2000, ApJ, 533, 236
- Haarsma et al. (2000) Haarsma, D. B., Partridge, R. B., Windhorst, R. A., Richards, E. A. 2000, ApJ, 544, 641
- Han (1992) Han, M. 1992, ApJS, 81, 35
- Helou & Bicay (1993) Helou, G., & Bicay, M. D. 1993, ApJ, 415, 93
- Helou et al. (1988) Helou, G., Khan, I. R., Malek, L., Boemher, L. 1988, ApJS, 68, 151
- Hopkins et al. (2001) Hopkins, A. M., Connolly, A. J., Haarsma, D. B, Cram, L. E. 2001, AJ, 122, 288
- Hopkins et al. (2002) Hopkins, A. M., Schulte-Ladbeck, R. E., Drozdovsky, I. O. 2002, AJ, 124, 862
- Inoue (2002) Inoue, A. K. 2002, ApJ, 570, 97L
- Isobe et al. (1990) Isobe, T., Feigelson, E. D., Akritas, M. G., Babu, G. J. 1990, ApJ, 364, 104
- Jansen et al. (2000) Jansen, R. A., Franx, M., Fabricant, D., Caldwell, N. 2000, ApJS, 126, 271
- Karachentsev (2002) Karachentsev, I. D., et al. 2002, A&A, 385, 21
- Karachentsev & Makarova (1996) Karachentsev, I. D., Makarova, D. A. 1996, AJ, 111, 794
- Kauffmann et al. (2003a) Kauffmann, G., et al. 2003a, MNRAS, submitted (astro-ph/0204055)
- Kauffmann et al. (2003b) Kauffmann, G., et al. 2003b, MNRAS, submitted (astro-ph/0204070)
- Kennicutt (1998) Kennicutt Jr., R. C. 1998, ARA&A, 36, 189
- Kennicutt & Kent (1983) Kennicutt Jr., R. C., Kent, S. M., 1983, AJ, 88, 1094
- Kennicutt et al. (1987) Kennicutt Jr., R. C., Keel, W. C., van der Hulst, J. M., Hummel, E., Roettiger, K. A., 1987, AJ, 93, 1011
- Kinney et al. (1993) Kinney, A. L., Bohlin, R. C., Calzetti, D., Panagia, N., Wyse, R. F. G. ApJS, 86, 5
- Klein (1991) Klein, U. 1991, PASAu, 9, 253
- Klein, Wielebinski & Thuan (1984) Klein, U., Wielebinski, R., Thuan, T. X. 1984, A&A, 141, 241
- Klein et al. (1991) Klein, U., Weiland, H., Brinks, E. 1991, A&A, 246, 323
- Lauberts & Valentijn (1989) Lauberts, A., Valentijn, E. A., 1989, The Surface Photometry Catalogue of the ESO-Uppsula Galaxies (Garching bei München, ESO)
- Lee et al. (2002) Lee, M. G., Kim, M., Sarajendini, A., Geisler, D., Gieren, W. 2002, ApJ, 565, 959
- Li & Draine (2001) Li, A., Draine, B. T. 2001, ApJ, 554, 778
- Lisenfeld et al. (1996) Lisenfeld, U., Völk, H. J., Xu, C. 1996, A&A, 314, 745
- Lonsdale Persson & Helou (1987) Lonsdale Persson, C. J., Helou, G. 1987, ApJ, 314, 513
- Macri et al. (1999) Macri, L. M., et al. 1999, ApJ, 521, 155
- Maddox et al. (1990) Maddox, S. J., Sutherland, W. J., Efstathiou, G., Loveday, J. 1990, MNRAS, 243, 692
- Makarova, Karachentsev & Georgiev (1997) Makarova, L. N., Karachentsev, I. D., Georgiev, Ts. B. 1997, AstL, 23, 378
- Mann et al. (2002) Mann, R. G., et al. 2002, MNRAS, 332, 549
- Mas-Hesse & Kunth (1999) Mas-Hesse, J. M., Dunth, D. 1999, A&A, 349, 765
- Mathewson & Ford (1996) Mathewson, D. S., Ford, V. L. 1996, ApJS, 107, 97
- Matthews & Wood (2001) Matthews, L. D., Wood, K. 2001, ApJ, 548, 150
- McGaugh & de Blok (1997) McGaugh, S. S., de Blok, W. J. G. 1997, ApJ, 481, 689
- Meurer, Heckman, & Calzetti (1999) Meurer, G. R., Heckman, T. M., & Calzetti, D. 1999, ApJ, 521, 64
- Misiriotis et al. (2001) Misiriotis, A., Popescu, C. C., Tuffs, R. J., Kylafis, N. D. 2001, A&A, 372, 775
- Moshir et al. (1990) Moshir, M., et al., 1990, IRAS Faint Source Catalogue, version 2.0 (Pasedena, IPAC)
- Niklas (1997) Niklas, S. 1997, A&A, 322, 29
- Niklas et al. (1997) Niklas, S., Klein, U., Wielebinski, R. 1997, A&A, 322, 19
- Pagel (1998) Pagel, B. E. J. 1998, “Nucleosynthesis and Chemical Evolution of Galaxies” (Cambridge University Press, Cambridge)
- Peletier & de Grijs (1998) Peletier, R. F., de Grijs, R. 1998, MNRAS, 300, 3L
- Popescu et al. (2000) Popescu, C. C., Misiriotis, A., Kylafis, N. D., Tuffs, R. J., Fischera, J. 2000, A&A, 362, 138
- Popescu et al. (2002) Popescu, C. C., Tuffs, R. J., Völk, H. J., Pierini, D., Madore, B. F. 2002, ApJ, 567, 221
- Press et al. (1992) Press W. H., Teukolsky S. A., Vetterling W. T.,Flannery B. P., 1992, “Numerical Recipes in Fortran 77: The Art of Scientific Computing” (Cambridge University Press, Cambridge).
- Price & Duric (1992) Price, R., Duric, N. 1992, ApJ, 401, 81
- Rice et al. (1988) Rice, W., Lonsdale, C. J., Soifer, B. T., Neugebauer, G., Kopan, E. L., Lloyd, L. A., de Jong, T., Habing, H. J. 1988, ApJS, 68, 91
- Rifatto, Longo & Capaccioli (1995a) Rifatto, A., Longo, G., Capaccioli, M. 1995a, A&AS, 109, 341
- Rifatto, Longo & Capaccioli (1995b) Rifatto, A., Longo, G., Capaccioli, M. 1995b, A&AS, 114, 527
- Romanishin (1990) Romanishin, W. 1990, AJ, 100, 373
- Sakai et al. (2000) Sakai, S., et al. 2000, ApJ, 529, 698
- Sanders & Mirabel (1996) Sanders, D. B., Mirabel, I. F. 1996, ARA&A, 34, 749
- Sauvage & Thuan (1992) Sauvage, M., Thuan T. X. 1992, ApJ, 396, 69L
- Schlegel et al. (1998) Schlegel, D. J., Finkbeiner, D. P., & Davis, M., 1998, ApJ, 500, 525
- Shanks (1997) Shanks, T., 1997, MNRAS, 290, 77L
- Sheth et al. (2000) Sheth, K., Regan, M. W., Vogel, S. N., Teuben, P. J. 2000, ApJ, 532, 221
- Skillman, Kennicutt & Hodge (1989) Skillman, E. D., Kennicutt Jr., R. C., Hodge, P. W. 1989, ApJ, 347, 875
- Sodroski et al. (1997) Sodroski, T. J., Odegard, N., Arendt, R. G., Dwek, E., Weiland, J. L., Hauser, M. G., Kelsall, T. 1997, ApJ, 480, 173
- Soifer et al. (1989) Soifer, B. T., Boehmer, L., Neugebauer, G., Sanders, D. B. 1989, AJ, 98, 766
- Spinoglio et al. (1995) Spinoglio, L., Malkan, M. A., Rush, B., Carrasco, L., Recillas-Cruz, E. 1995, ApJS, 453, 616
- Sullivan et al. (2000) Sullivan, M., Treyer, M. A., Ellis, R. S., Bridges, T. J., Milliard, B., Donas, J. 2000, MNRAS, 312, 442
- Sullivan et al. (2001) Sullivan, M., Mobasher, B., Chan, B., Cram, L., Ellis, R., Treyer, M., Hopkins, A. 2001, ApJ, 558, 72
- Takamiya, Kron & Kron (1995) Takamiya, M., Kron, R. G., Kron, G. E. 1995, AJ, 110, 1083
- Teerikorpi et al. (1992) Teerikorpi, P., Bottinelli, L., Gougenheim, L., Paturel, G. 1992, A&A, 260, 17
- Tikhonov & Karachentsev (1998) Tikhonov, N. A., Karachentsev, I. D. A&AS, 128, 325
- Tonry et al. (2001) Tonry, J. L., Dressler, A., Blakeslee, J. P., Ajham, E. A., Fletcher, A. B., Luppini, G. A., Metzger, M. R., Moore, C. B. 2001, ApJ, 546, 681
- Tuffs et al. (2002) Tuffs, R. J., et al. 2002, ApJS, 139, 37
- Tully & Shaya (1984) Tully, R. B., Shaya, E. J. 1984, ApJ, 281, 31
- van Zee et al. (1997) van Zee, L., Haynes, M. P., Salzer, J. J. 1997, AJ, 114, 2479
- Vila-Costas & Edmunds (1992) Vila-Costas, M. B., Edmunds, M. G. 1992, MNRAS, 259, 121
- Walterbos & Greenawalt (1996) Walterbos, R. A. M., Greenawalt, B. 1996, ApJ, 460, 696
- Wang & Heckman (1996) Wang, B., Heckman, T. M., 1996, ApJ, 457, 645
- White & Becker (1992) White, R. L., Becker, R. H. 1992, ApJS, 79, 331
- Whittet (1992) Whittet, D. C. B. 1992, Dust in the Galactic Environment (New York, IOP Publishing)
- Wright et al. (1994) Wright, A. E., Griffith, M. R., Burke, B. F., Ekers, R. D. 1994, ApJS, 91, 111
- Wu et al. (1998) Wu, H., Zou, Z. L., Xia, X. Y., Deng, Z. G. 1998, A&AS, 127, 521
- Xu et al. (1997) Xu, C., Buat, V., Boselli, A., Gavazzi, G. 1997, A&A, 324, 32
- Xu et al. (1994) Xu, C., Lisenfeld, U., Völk, H. J., Wunderlich, E. 1994, A&A, 282, 19
- Yasuda, Fukugita & Okamura (1997) Yasuda, N., Fukugita, M., Okamura, S. 1997, ApJS, 108, 417
- Young et al. (1996) Young, J. S., Allen, L., Kenney, J. D. P., Lesser, A., Rownd, B., 1996, AJ, 112, 1903
- Yun et al. (2001) Yun, M. S., Reddy, N. A., Condon, J. J. 2001, ApJ, 554, 803
- Zaritsky (1999) Zaritsky, D. 1999, AJ, 118, 2824
- Zaritsky, Kennicutt & Huchra (1994) Zaritsky, D., Kennicutt Jr., R. C., Huchra, J. P. 1994, ApJ, 420, 87
- Zaritsky et al. (2002) Zaritsky, D., Harris, J., Thompson, I. B., Grebel, E. K., Massey, P. 2002, AJ, 123, 855
- Zepf et al. (2000) Zepf, S., Lui, M. C., Marleau, F. R., Sackett, P. D., Graham, J. R. 2000, AJ, 119, 1701
Appendix A A. Multi-wavelength photometry
My galaxy sample was primarily selected to have published FUV photometry at Å. Here, I describe the sources of the FUV, optical, IR, radio, and other data, and the error estimates for each type of data. I also present my galaxy luminosities, as an aid to workers in the field, in Table B.
A.1 FUV Data

The FUV data at wavelengths Å were taken from a variety of sources: UIT fluxes at an average wavelength of 1567Å for normal spiral and dwarf galaxies from Bell & Kennicutt (2001), 1495Å IUE fluxes for UV-bright starbursts from Calzetti et al. (1994, 1995), 1650Å STIS data from the Hubble Space Telescope for a sample of ULIRGs from Goldader et al. (2002), 1650Å fluxes from normal galaxies from the FAUST experiment by Deharveng et al. (1994), and large-aperture 1650Å UV fluxes from a variety of UV experiments which were homogenized and extrapolated to total by Rifatto, Longo & Capaccioli (1995a, b).
Error estimates for the different sources of data are as follows.
-
•
UIT and FAUST were shown to be consistent to within 20% (0.08 dex) by Bell & Kennicutt (2001).
-
•
IUE fluxes for this sample are also accurate to dex (Kinney et al., 1993).
-
•
The STIS fluxes for the seven ULIRGs have a mean accuracy of dex (Goldader et al., 2002).
-
•
Fluxes from Rifatto, Longo & Capaccioli (1995b) were compiled from the literature, and so have variable quality. In Fig. 10, I show a comparison of FAUST and Rifatto, Longo & Capaccioli (1995b) fluxes (open circles), and UIT and Rifatto, Longo & Capaccioli (1995b) fluxes (filled circles) as a function of galaxy area. Rifatto, Longo & Capaccioli (1995b) sometimes substantially over-extrapolate the FUV fluxes of large galaxies: this conclusion was also reached by Bell & Kennicutt (2001) when they compared UIT and Rifatto, Longo & Capaccioli (1995b) fluxes with OAO, SCAP and FOCA data (their Fig. 1). Accordingly, all galaxies from Rifatto, Longo & Capaccioli (1995b) with are removed from the sample (29 galaxies). The remaining 21 galaxies from Rifatto, Longo & Capaccioli (1995b) with UIT or FAUST data and are consistent with a scatter of 0.19 dex. While substantial, this scatter is consistent with the combined error estimates, and is substantially smaller than the intrinsic scatter in, e.g., the TIR/FUV correlation with total TIR luminosity, or band absolute magnitude. In Fig. 10, there also appears to be a trend between the FAUST/UIT fluxes and Rifatto, Longo & Capaccioli (1995b) fluxes for . A correction of either the Rifatto, Longo & Capaccioli (1995b) data, or the FAUST/UIT data for this trend simply increases scatter in TIR/FUV at a given TIR or -band luminosity, and is therefore not applied.
The IUE spectroscopic aperture is in size. Accordingly, to minimize aperture effects I choose to use the FUV data for starburst galaxies with optical diameters only. Tests have shown that this diameter cutoff excludes all of the galaxies with truly obvious aperture effects (e.g., gross mismatches between FUV attenuations measured by TIR/FUV, which are susceptible to aperture mismatch, and UV-color based attenuations, which are impervious to aperture worries), while keeping a reasonable sample size. Larger starbursts are included in this study, but are assumed to have no FUV data (i.e. only the optical, IR and radio data are used).
The data come from wavelengths between 1450Å and 1650Å. I make the simplifying assumption that the fluxes are all measured at 1550Å. A typical star-forming galactic spectrum has at these wavelengths (Bell, 2002). Thus, the error introduced by this assumption is %.
As is obvious from the above discussion, there is some overlap between the different samples. I prefer FAUST/UIT FUV photometry above the Rifatto, Longo & Capaccioli (1995b) photometry in all cases. There were two galaxies which overlapped between the Rifatto, Longo & Capaccioli (1995b) sample and the starburst sample. While the Rifatto, Longo & Capaccioli (1995b) total FUV fluxes would probably be preferred (because of aperture effects in the IUE starburst data), I choose to use the IUE data for those two galaxies so that the HBalmer decrement data and FUV measurements have matched apertures. The measurements were consistent to within 0.3 dex at any rate, and adopting Rifatto, Longo & Capaccioli (1995b) fluxes for these two galaxies does not affect the results.
A.2 Optical Data
Optical data are principally taken from the Third Reference Catalogue of Bright Galaxies (RC3; de Vaucouleurs et al., 1991). Values of , the total band magnitude not corrected for extinction or inclination, were taken, when available. If necessary, -band apparent magnitudes were estimated from and -band data from the ESO-LV Catalogue (Lauberts & Valentijn, 1989) assuming that is the average of and magnitudes (assuming an error of 0.2 mag). As a last resort, band fluxes were estimated from RC3 values, assuming for normal galaxies (assuming an error of 0.5 mag). A more homogeneous and accurate optical magnitude would be ideal; however, magnitudes of this accuracy will be adequate for this study.
A.3 IR Data
The IR data were taken from (in order of preference) the catalog of IRAS observations of large optical galaxies (Rice et al., 1988), the IRAS Bright Galaxy Sample (Soifer et al., 1989), and the IRAS Faint Source Catalog (Moshir et al., 1990). Internal accuracy between the different catalogs is typically better than 10%, and the true uncertainties (including zero point and calibration uncertainties) are % (estimated by comparing ISO/IRAS cross-calibration; e.g., Tuffs et al., 2002).
The 12µm, 25µm, 60µm and 100µm fluxes are used to estimate total IR fluxes in two ways. The integrated 42.5–122.5µm emission is well-approximated (to a few percent) by the FIR estimator of Helou et al. (1988):
| (A1) |
where and are the 60µm and 100µm fluxes in Jy. However, this definition of the FIR flux omits contributions shortwards of 42.5µm and longwards of 122.5µm: both spectral regions contribute significantly to the total IR energy budget. Following Gordon et al. (2000), I estimate the total IR flux from 8µm to 1000µm by direct integration of the 12–100µm fluxes, and by extrapolating the flux longwards of 100µm using the 60µm and 100µm to define the temperature of a modified blackbody curve with a emissivity. If 12µm or 25µm do not exist for a galaxy (89 and 87 galaxies out of 245, respectively), they are estimated using or , which were derived from the rest of the sample and are good to 30%. The contribution to the total IR from the mid-IR component is %, and so the total uncertainty introduced by this approximation is not large, %. Total IR (TIR) fluxes defined in this way are typically a factor of two higher than the FIR estimator, with an obvious dependence on the 60µm to 100µm ratio. For reference, the TIR fluxes are 30% larger than the 8–1000µm estimator of Sanders & Mirabel (1996). I have used 150–205µm Infrared Space Observatory (ISO) measurements of 38 Virgo Cluster galaxies (Popescu et al., 2002) to check the extrapolation of the 12–100µm fluxes using the emissivity. I find that TIR estimates where the 12–170µm data are used are 10% larger than TIR estimates where the 12–100µm data are used, with a 10% scatter. Furthermore, this offset is independent of dust temperature between values of 0.1 to 0.8 (which covers most of my main sample galaxies). Because the offset is modest and because the systematic errors in IR calibration are the same size or larger (Tuffs et al., 2002), I have chosen to leave my TIR values uncorrected for this offset. Note that none of my conclusions are significantly affected by this 10% offset: the TIR calibrations remain unchanged because the calibration is, to first order, model-based and the radio calibration would increase by 10% (in the sense that per unit radio flux, the SF rate will be increased by 10%) because the same radio flux must reflect the 10% increase in SF rate implied by the larger TIR flux. In this paper, I explore mostly the ratio of TIR (8-1000µm, extrapolated) fluxes with radio; however the FIR to radio ratio is also briefly explored to check for consistency with the literature. Errors in FIR and TIR are somewhat larger than the individual flux errors, and are %.
A.4 Radio Data
Radio data for 166 galaxies at 1.4 GHz were, for the most part, taken from the NRAO VLA Sky Survey (NVSS; Condon et al., 1998). NVSS data were taken for 159 galaxies from Condon et al. (2002), Hopkins et al. (2002), and Gavazzi & Boselli (1999a, b) in that order of preference. Internally, the consistency between these studies of the NVSS was % for larger fluxes, and mJy for fainter sources. Comparison of the NVSS fluxes with literature galaxy fluxes from other, independent data was somewhat less clean: fluxes were repeatable to 20% or so, degrading considerably for fainter sources. Noting the superior uniformity and resolution of the NVSS, I adopt error estimates of 10% and 2 mJy, to be added in quadrature, for these 159 galaxies. I removed by hand a few galaxies which had highly discrepant (off by more than a factor of three) NVSS vs. literature fluxes, where it was unclear which radio flux was more accurate, in the interests of being as conservative as possible. Additional data at frequencies between 1.4 and 1.5 GHz (translated to 1.4 GHz assuming a non-thermal spectrum) were taken from other sources for seven galaxies which were not in the above catalogs, but were important to have in the sample because of their properties (ULIRGs or interacting pairs), or because they had measured thermal radio fractions. These radio data were extensively cross-checked with many other radio catalogs, and were found to agree to within 20% in most cases.
A.5 Other Data
Exquisite distances are not central to the purpose of this paper, as most of the diagnostics of the behavior of the radio–IR correlation are ratios of fluxes. Nevertheless, in order to construct and -band absolute magnitudes, distances are required to the sample galaxies. Distances were taken from a variety of sources, and were scaled roughly to reflect km s-1 Mpc-1 and a distance to the Virgo and Ursa Major Clusters of 20 Mpc (e.g., Shanks, 1997; Sakai et al., 2000). Typical distance uncertainties of 25% will produce absolute magnitude errors of 0.5 mag, dwarfing the -band apparent magnitude and TIR flux errors in most cases.
The galactic foreground extinction has been calculated using the models of Schlegel et al. (1998).
H fluxes and attenuation estimates were required in §2.3 in order to establish the efficacy of TIR/FUV as a FUV attenuation indicator. H fluxes for galaxies with H attenuation estimates in the literature were taken from a variety of sources. Inter-comparison of the fluxes indicates a 20% uncertainty. Thermal radio fractions were taken from Bell & Kennicutt (2001) for the UIT and FAUST galaxies (which in turn mostly come from Niklas et al., 1997), and from Niklas et al. (1997) directly for the Rifatto, Longo & Capaccioli (1995b) galaxies. Balmer decrements were taken from Calzetti et al. (1994) and Wu et al. (1998) for starburst galaxies and ULIRGs respectively. Average Balmer decrements for H ii regions in the UIT and FAUST galaxies are taken from Bell & Kennicutt (2001). Thermal radio fractions and Balmer decrements are difficult to do external comparisons on in detail, because of their rarity in the literature, but there are substantial error bars attached to each type of estimate because of the difficulty of disentangling the thermal and dominant non-thermal contributions to the radio flux (discussed extensively by e.g., Condon, 1992; Niklas et al., 1997) on one hand, and aperture mismatches and stellar absorption corrections, coupled with astrophysical uncertainties such as optical depth effects, on the other hand (Caplan & Deharveng, 1986).
Appendix B B. Linking galaxy luminosity with optical depth
Observed attenuation–luminosity correlations (e.g., Wang & Heckman, 1996; Buat et al., 1999; Hopkins et al., 2001) are relatively easy to understand, at least at a qualitative level, using some simple arguments. The basic argument is that the metals-to-dust ratio is constant. Then the optical depth depends only gas column density and gas metallicity . In turn, the gas column density varies as a function of galaxy luminosity (tending to be rather higher for more luminous galaxies), and the metallicity is higher for more luminous galaxies. Both effects tend to drive a higher dust opacity in more luminous galaxies.
The dust opacity at Å is given by where is the number of dust grains along the line of sight per unit cross section, and is the extinction cross section (Whittet, 1992). The dust absorption cross section (which I use instead of the extinction cross section because as much light will be scattered into the line of sight as out of it) at 1550Å is cm2 g-1 (Li & Draine, 2001). Using this, I obtain where is in M☉ pc-2. Assuming that the dust-to-metals ratio is constant (assuming solar metallicity and a gas/dust of 226; Sodroski et al., 1997), , where is the gas density in M☉ pc-2. However, trends in with luminosity are poorly studied. Therefore, I choose to approximate with the gas-to-stellar mass ratio multiplied by the stellar surface density . Then, , where is the gas fraction. This crude estimation of the gas densities from the gas fraction plus the stellar densities is clearly an over-simplification; however, it is clear that the general trend of increasing dust opacity with increasing luminosity is a robust one as both the typically increasing metallicity and gas density with galaxy luminosity (at least for star-forming galaxies) will cause the dust opacity to increase with luminosity. I now address each luminosity-dependent variable in turn.
The origin of the strong metallicity–luminosity correlation (e.g., Skillman, Kennicutt & Hodge, 1989; Vila-Costas & Edmunds, 1992; Zaritsky, Kennicutt & Huchra, 1994; van Zee et al., 1997; Bell & de Jong, 2000) is not fully understood, but it is argued that both the greater degree of astration in more luminous galaxies, and galaxy mass-dependent metal loss play a rôle (see, e.g., Pagel, 1998, for a thorough treatment of the issues). Following Fig. 16 of Bell & de Jong (2000), I adopt the following metallicity–luminosity correlation: , where = 0.02 is the solar metallicity, denotes -band absolute magnitude, and I assume .
There is a decreasing gas fraction with increasing galaxy luminosity (e.g., McGaugh & de Blok, 1997; Bell & de Jong, 2000), which is easily interpreted in terms of astration. More luminous galaxies tend to have formed stars with greater efficiency (arguably because of their typically higher gas surface densities although other mechanisms are plausible; see, e.g., Bell & de Jong, 2000; Ferreras & Silk, 2001) and have older stellar populations and lower gas fractions, albeit with a large scatter. I adopt a gas fraction–luminosity correlation: , where is the gas fraction. This is consistent with the correlation presented by Bell & de Jong (2000).
Lastly, the stellar surface density is known to vary smoothly with galaxy mass (de Jong & Lacey, 2000; Kauffmann et al., 2003b) roughly as , assuming that the stellar M/L in -band is roughly constant (which is wrong at only a factor of 3 level). Therefore, , where is a constant of order unity that is tuned to fit the observed trend in TIR/FUV with luminosity: this constant allows me to fit out any of the crude modeling assumptions and accounts for the effects of star/dust geometry on the opacity. Note that star/dust geometry effects will tend to drive below unity, as a star/dust mix attenuates light less per unit mass than the screen model that I have assumed. Given that the relationship between FUV attenuation and TIR/FUV is , it follows that . In order to match the data reasonably well (the solid curve in Fig. 2), I adopt .
In order to connect the TIR/radio ratio with TIR/FUV, I assume that SF rate TIRFUV, and that radio is a perfect SF rate indicator. Then, , where is the intrinsic TIR/radio ratio which is tuned to match the observed at .
In §4, I correct the data for the effects of old stellar populations. In this case, I set , and change the value of to match the observed (the average , once the TIR has been corrected for old stellar populations) at .
It is interesting to briefly note that the depends largely on gas column density, modulated mostly by metallicity. In the above model, the gas column density was derived in a very statistical fashion by adopting a stellar surface density–luminosity correlation (which has much intrinsic scatter), and a gas fraction–luminosity correlation (which also has a lot of intrinsic scatter). Thus, a very testable generic prediction of this type of model is that dust opacity should correlate well with a combination of gas column density and metallicity, with substantially less scatter than the correlation between opacity and galaxy luminosity. Testing this prediction in detail is far beyond the scope of this work, but it is interesting to note that low surface brightness galaxies, with a very low gas column density, tend to be relatively dust-free (e.g., Matthews & Wood, 2001), and ULIRGs, with very high gas column densities, tend to be very dusty. In addition, the good correlation between FUV extinction as measured by TIR/FUV with total gas density (Buat, 1992; Xu et al., 1997) is consistent this this scheme.
| Galaxy | FUV | TIR | FIRHelou | 100/60 | 1.4 GHz | H | Type | References | |||||
|---|---|---|---|---|---|---|---|---|---|---|---|---|---|
| Name | (Å) | () | () | (Hz) | (mag) | (mag) | (Mpc) | () | (mag) | ||||
| NGC 598 | 32.35 0.04 | 35.63 | 35.36 | 3.00 | 20.40 0.04 | 18.95 0.10 | 0.14 | 0.8 | Scd | 1a,2a,4a | |||
| NGC 628 | 33.00 0.04 | 36.55 | 36.26 | 3.15 | 21.34 0.04 | 20.84 0.10 | 0.23 | 10.0 | 34.17 | 0.84 | Sc | 1baaBell & Kennicutt (2001) presents all of the data except for the radio luminosity.,2a | |
| DDO 81 | 32.09 0.06 | 34.72 | 34.39 | 4.41 | 19.09 0.08 | 17.22 0.21 | 0.12 | 3.1 | 32.88 | Sm | 1baaBell & Kennicutt (2001) presents all of the data except for the radio luminosity.,2a | ||
| DDO 50 | 31.85 0.02 | 34.18 | 33.91 | 2.28 | 19.36 0.06 | 0.128 0.020 | 16.90 0.17 | 0.11 | 3.1 | 32.64 | 0.15 | Im | 1baaBell & Kennicutt (2001) presents all of the data except for the radio luminosity.,2a |
| NGC 5457 | 33.45 0.01 | 36.88 | 36.60 | 2.87 | 21.69 0.04 | 0.063 0.025 | 21.51 0.10 | 0.03 | 7.4 | 34.49 | 0.53 | Scd | 1baaBell & Kennicutt (2001) presents all of the data except for the radio luminosity.,2a |
| NGC 5055 | 32.54 0.04 | 36.72 | 36.36 | 3.94 | 21.39 0.04 | 0.119 0.040 | 20.87 0.10 | 0.06 | 7.6 | 33.95 | 1.22 | Sbc | 1baaBell & Kennicutt (2001) presents all of the data except for the radio luminosity.,2a |
| NGC 3034 | 31.36 0.15 | 37.16 | 36.88 | 1.06 | 21.93 0.04 | 0.107 0.036 | 19.72 0.09 | 0.54 | 3.3 | 34.12 | 2.82 | I | 1baaBell & Kennicutt (2001) presents all of the data except for the radio luminosity.,2a |
| NGC 3351 | 31.94 0.06 | 36.20 | 35.98 | 1.99 | 20.62 0.05 | 20.13 0.10 | 0.09 | 9.0 | 33.67 | 0.69 | Sb | 1baaBell & Kennicutt (2001) presents all of the data except for the radio luminosity.,2a | |
| NGC 2403 | 32.36 0.03 | 35.85 | 35.58 | 2.88 | 20.55 0.04 | 19.06 0.08 | 0.13 | 3.0 | 33.69 | 0.38 | Scd | 1baaBell & Kennicutt (2001) presents all of the data except for the radio luminosity.,2a | |
| NGC 5236 | 32.81 0.02 | 36.75 | 36.44 | 2.40 | 20.52 0.04 | 0.22 | 3.7 | 34.29 | 1.75 | Sc | 1baaBell & Kennicutt (2001) presents all of the data except for the radio luminosity. | ||
| DDO 75 | 31.02 0.04 | 32.91 | 32.63 | 2.63 | 14.48 0.11 | 0.15 | 1.4 | 32.09 | Im | 1baaBell & Kennicutt (2001) presents all of the data except for the radio luminosity. | |||
| NGC 4449 | 32.42 0.01 | 35.68 | 35.46 | 1.77 | 20.57 0.04 | 0.225 0.025 | 18.14 0.13 | 0.07 | 3.4 | 33.55 | 0.46 | Im | 1baaBell & Kennicutt (2001) presents all of the data except for the radio luminosity.,2a |
| NGC 4736 | 32.34 0.01 | 36.27 | 36.01 | 2.17 | 20.87 0.04 | 0.214 0.059 | 20.22 0.13 | 0.06 | 4.8 | 33.76 | 0.46 | Sab | 1baaBell & Kennicutt (2001) presents all of the data except for the radio luminosity.,2a |
| NGC 4038/9 | 33.27 0.01 | 37.32 | 37.09 | 1.69 | 22.45 0.04 | 0.178 0.025 | 21.44 0.20 | 0.15 | 19.8 | 34.80 | 0.53 | Pec | 1ba,da,dfootnotemark: |
| NGC 891 | 37.03 | 36.72 | 3.25 | 21.92 0.04 | 20.26 0.18 | 0.22 | 9.9 | 33.55 | Sb | 1baaBell & Kennicutt (2001) presents all of the data except for the radio luminosity.,2a | |||
| NGC 4156 | 32.90 0.09 | 21.98 0.09 | 21.70 0.05 | 0.09 | 90.0 | Sb | 1baaBell & Kennicutt (2001) presents all of the data except for the radio luminosity.,2a | ||||||
| NGC 5253 | 32.03 0.04 | 35.73 | 35.33 | 0.96 | 17.53 0.12 | 0.18 | 3.6 | 33.47 | 0.61 | Im | 1baaBell & Kennicutt (2001) presents all of the data except for the radio luminosity. | ||
| NGC 2903 | 32.29 0.03 | 36.53 | 36.23 | 2.81 | 21.33 0.04 | 0.195 0.052 | 20.09 0.10 | 0.10 | 6.3 | 33.87 | 0.91 | Sd | 1baaBell & Kennicutt (2001) presents all of the data except for the radio luminosity.,2a |
| NGC 6090 | 33.44 0.01 | 37.98 | 37.72 | 1.49 | 22.90 0.04 | 21.34 0.10 | 0.07 | 117.0 | 35.07 | Pec | 1baaBell & Kennicutt (2001) presents all of the data except for the radio luminosity.,2a | ||
| NGC 3310 | 33.16 0.01 | 36.84 | 36.60 | 1.40 | 21.97 0.04 | 0.047 0.035 | 19.99 0.10 | 0.07 | 13.9 | 34.48 | Sbc | 1baaBell & Kennicutt (2001) presents all of the data except for the radio luminosity.,2a | |
| NGC 4214 | 32.39 0.02 | 35.52 | 35.30 | 1.63 | 19.91 0.05 | 18.41 0.15 | 0.07 | 4.2 | 33.48 | 0.23 | Im | 1baaBell & Kennicutt (2001) presents all of the data except for the radio luminosity.,2a | |
| Mrk 66 | 33.29 0.03 | 36.66 | 36.40 | 1.48 | 19.76 0.10 | 0.04 | 87.0 | 34.09 | BCG | 1baaBell & Kennicutt (2001) presents all of the data except for the radio luminosity. | |||
| NGC 4631 | 33.09 0.03 | 36.91 | 36.66 | 2.52 | 21.92 0.04 | 0.037 0.025 | 20.49 0.16 | 0.06 | 8.4 | 34.26 | 0.84 | Sd | 1baaBell & Kennicutt (2001) presents all of the data except for the radio luminosity.,2a |
| IRAS 083396517 | 33.82 0.02 | 37.55 | 37.33 | 1.01 | 21.21 0.40 | 0.30 | 76.0 | 35.05 | Pec | 1baaBell & Kennicutt (2001) presents all of the data except for the radio luminosity. | |||
| NGC 925 | 32.96 0.08 | 36.00 | 35.75 | 3.49 | 20.27 0.06 | 0.597 0.031 | 19.88 0.12 | 0.25 | 8.9 | 33.87 | 0.76 | Sd | 1baaBell & Kennicutt (2001) presents all of the data except for the radio luminosity.,2a |
| NGC 1512 | 32.02 0.04 | 35.72 | 35.44 | 3.50 | 19.67 0.10 | 0.03 | 9.8 | Sab | 1baaBell & Kennicutt (2001) presents all of the data except for the radio luminosity. | ||||
| NGC 1291 | 30.99 0.11 | 35.58 | 35.22 | 5.76 | 21.25 0.04 | 0.04 | 8.6 | 32.66 | S0a | 1baaBell & Kennicutt (2001) presents all of the data except for the radio luminosity. | |||
| NGC 253 | 32.21 0.15 | 36.91 | 36.66 | 1.86 | 21.70 0.04 | 0.122 0.024 | 19.96 0.20 | 0.06 | 2.6 | 33.69 | Sc | 1ba,da,dfootnotemark: | |
| NGC 1313 | 32.64 0.04 | 35.85 | 35.63 | 2.56 | 19.61 0.20 | 0.37 | 3.9 | 33.68 | Sd | 1baaBell & Kennicutt (2001) presents all of the data except for the radio luminosity. | |||
| NGC 6946 | 36.90 | 36.61 | 2.52 | 21.81 0.04 | 0.077 0.013 | 21.31 0.11 | 1.15 | 6.2 | 34.42 | 0.69 | Scd | 1baaBell & Kennicutt (2001) presents all of the data except for the radio luminosity.,2a | |
| NGC 4321 | 33.06 0.11 | 37.01 | 36.72 | 2.68 | 21.91 0.04 | 21.76 0.08 | 0.09 | 16.0 | 34.33 | 0.38 | Sbc | 1baaBell & Kennicutt (2001) presents all of the data except for the radio luminosity.,2a | |
| UGC 6697 | 33.64 0.05 | 37.19 | 36.92 | 1.89 | 22.72 0.04 | 21.25 0.10 | 0.07 | 90.0 | 34.73 | Im | 1baaBell & Kennicutt (2001) presents all of the data except for the radio luminosity.,2a | ||
| NGC 3389 | 32.81 0.01 | 36.48 | 36.23 | 2.53 | 21.47 0.05 | 20.09 0.06 | 0.09 | 24.0 | 34.03 | Sc | 1baaBell & Kennicutt (2001) presents all of the data except for the radio luminosity.,2a | ||
| NGC 4647 | 32.41 0.04 | 36.62 | 36.26 | 2.99 | 21.42 0.04 | 20.30 0.08 | 0.09 | 20.0 | 33.87 | Sc | 1baaBell & Kennicutt (2001) presents all of the data except for the radio luminosity.,2a | ||
| NGC 1317 | 32.02 0.03 | 36.31 | 36.04 | 2.88 | 20.55 0.06 | 0.07 | 20.0 | 33.41 | S0a | 1baaBell & Kennicutt (2001) presents all of the data except for the radio luminosity. | |||
| NGC 2993 | 33.10 0.02 | 37.09 | 36.86 | 1.59 | 20.09 0.14 | 0.20 | 32.0 | 34.42 | Sa | 1baaBell & Kennicutt (2001) presents all of the data except for the radio luminosity. | |||
| NGC 2551 | 31.80 0.18 | 35.73 | 35.38 | 4.04 | 20.44 0.20 | 0.09 | 31.0 | S0a | 1baaBell & Kennicutt (2001) presents all of the data except for the radio luminosity. | ||||
| Haro 15 | 33.47 0.04 | 37.11 | 36.80 | 1.45 | 21.76 0.20 | 0.07 | 86.7 | 34.49 | Pec | 1c,3a,4b,5a | |||
| IC 1586 | 33.03 0.04 | 36.96 | 36.62 | 1.76 | 20.29 0.20 | 0.14 | 81.3 | 34.38 | 1.21 | H ii | 1c,3a,4b,5a | ||
| IC 214 | 33.50 0.04 | 37.94 | 37.72 | 1.57 | 23.00 0.04 | 21.83 0.20 | 0.14 | 125.3 | 34.60 | 1.11 | 1c,2a,3a,4b,5a | ||
| Mrk 499 | 33.17 0.04 | 37.33 | 36.94 | 2.18 | 21.02 0.20 | 0.05 | 98.6 | 34.25 | 0.94 | Im | 1c,3a,4b,5a | ||
| NGC 1510 | 31.62 0.04 | 35.02 | 34.80 | 1.27 | 17.25 0.20 | 0.03 | 11.1 | 32.68 | 0.17 | Pec | 1c,3a,4b,5a | ||
| NGC 1705 | 34.62 | 34.40 | 1.89 | 16.69 0.20 | 0.02 | 5.9 | 32.35 | Pec | 3a,4b,5abbThis galaxy has a major axis optical diameter ′, so its UV data is ignored to minimize aperture bias. | ||||
| NGC 1800 | 34.87 | 34.60 | 2.28 | 17.09 0.20 | 0.04 | 8.1 | 31.98 | Im | 3a,4b,5abbThis galaxy has a major axis optical diameter ′, so its UV data is ignored to minimize aperture bias. | ||||
| NGC 3049 | 36.15 | 35.88 | 1.56 | 20.67 0.09 | 19.29 0.20 | 0.12 | 20.6 | 33.47 | Sab | 2a,3a,4b,5abbThis galaxy has a major axis optical diameter ′, so its UV data is ignored to minimize aperture bias. | |||
| NGC 3125 | 32.41 0.04 | 35.83 | 35.61 | 1.02 | 17.96 0.20 | 0.24 | 12.1 | 33.53 | 0.27 | Sab | 1c,3a,4b,5a | ||
| NGC 3256 | 38.13 | 37.90 | 1.18 | 22.25 0.20 | 0.38 | 37.7 | 34.89 | Pec | 3a,4b,5abbThis galaxy has a major axis optical diameter ′, so its UV data is ignored to minimize aperture bias. | ||||
| NGC 4194 | 32.52 0.04 | 37.51 | 37.26 | 1.07 | 22.22 0.04 | 20.39 0.20 | 0.05 | 37.0 | 34.54 | 1.67 | Im | 1c,2a,3a,4b,5a | |
| NGC 4385 | 32.53 0.04 | 36.78 | 36.48 | 1.28 | 21.24 0.07 | 20.18 0.20 | 0.08 | 33.1 | 34.13 | S0 | 2a,3a,4b,5abbThis galaxy has a major axis optical diameter ′, so its UV data is ignored to minimize aperture bias. | ||
| UGC 9560 | 32.10 0.04 | 35.42 | 35.13 | 1.75 | 20.31 0.13 | 17.49 0.20 | 0.04 | 17.0 | 33.30 | 0.31 | Pec | 1c,2a,3a,4b,5a | |
| NGC 5860 | 32.80 0.04 | 37.03 | 36.77 | 1.84 | 21.70 0.11 | 20.69 0.20 | 0.06 | 73.5 | 34.39 | 1.44 | 1c,2a,3a,4b,5a | ||
| NGC 5996 | 32.50 0.04 | 36.65 | 36.40 | 1.85 | 21.51 0.05 | 20.21 0.20 | 0.11 | 30.2 | 33.82 | 0.98 | Sc | 1c,2a,3a,4b,5a | |
| NGC 6052 | 33.33 0.04 | 37.36 | 37.13 | 1.66 | 22.65 0.04 | 21.08 0.20 | 0.24 | 58.6 | 34.46 | 0.44 | 1c,2a,3a,4b,5a | ||
| Tololo 1924416 | 33.63 0.04 | 36.38 | 36.09 | 0.60 | 20.61 0.20 | 0.27 | 38.7 | 34.50 | 0.04 | Pec | 1c,3a,4b,5a | ||
| NGC 7250 | 33.15 0.04 | 35.94 | 35.75 | 1.34 | 20.82 0.06 | 19.87 0.20 | 0.47 | 16.6 | 33.52 | 0.19 | Sdm | 1c,2a,3a,4b,5a | |
| NGC 7552 | 37.69 | 37.45 | 1.42 | 21.32 0.20 | 0.04 | 24.9 | 34.25 | Sab | 3a,4b,5abbThis galaxy has a major axis optical diameter ′, so its UV data is ignored to minimize aperture bias. | ||||
| NGC 7673 | 33.15 0.04 | 36.96 | 36.78 | 1.40 | 22.03 0.05 | 21.00 0.20 | 0.13 | 45.1 | 34.28 | 0.88 | Pec | 1c,2a,3a,4b,5a | |
| NGC 7714 | 36.91 | 36.62 | 1.06 | 21.73 0.04 | 20.04 0.20 | 0.16 | 26.1 | 34.46 | Sab | 2a,3a,4b,5abbThis galaxy has a major axis optical diameter ′, so its UV data is ignored to minimize aperture bias. | |||
| NGC 7793 | 35.44 | 35.16 | 2.87 | 18.44 0.20 | 0.06 | 3.0 | 31.42 | Sab | 3a,4b,5abbThis galaxy has a major axis optical diameter ′, so its UV data is ignored to minimize aperture bias. | ||||
| VV 114 | 33.79 0.01 | 38.19 | 37.96 | 1.36 | 23.31 0.04 | 21.28 0.30 | 0.05 | 82.8 | ULIRG | 1d,2b,3b,4b | |||
| IRAS 085723915 | 32.96 0.10 | 38.63 | 38.35 | 0.66 | 22.54 0.15 | 19.92 0.50 | 0.09 | 243.0 | ULIRG | 1d,2c,3c,4b | |||
| IC 883 | 32.41 0.06 | 38.10 | 37.92 | 1.82 | 23.05 0.04 | 21.03 0.30 | 0.04 | 95.2 | 33.59 | 5.59 | ULIRG | 1d,2a,3d,4b,5b | |
| Mrk 273 | 32.75 0.05 | 38.62 | 38.47 | 1.01 | 23.68 0.04 | 21.44 0.30 | 0.03 | 157.0 | 34.40 | 3.09 | ULIRG | 1d,2a,3d,4b,5b | |
| IRAS 152503609 | 33.09 0.04 | 38.51 | 38.30 | 0.81 | 22.92 0.07 | 0.06 | 231.7 | ULIRG | 1d,2c,4b | ||||
| Arp 220 | 31.83 0.12 | 38.62 | 38.50 | 1.11 | 23.33 0.04 | 21.07 0.30 | 0.17 | 74.1 | 32.43 | ULIRG | 1d,2a,3d,4b,5b | ||
| IRAS 192547245 | 32.77 0.10 | 38.56 | 38.30 | 1.05 | 24.33 0.04 | 0.28 | 255.2 | ULIRG | 1d,2d,4b | ||||
| NGC 4592 | 31.87 0.08 | 35.44 | 35.15 | 2.36 | 19.89 0.12 | 18.43 0.30 | 0.07 | 9.8 | Sdm | 1e,2a,4d | |||
| PGC 043701 | 33.60 0.08 | 37.14 | 36.85 | 2.69 | 21.76 0.05 | 0.31 | 56.4 | Sb | 1e,3e,4e | ||||
| NGC 4930 | 33.05 0.08 | 36.18 | 35.80 | 5.13 | 21.95 0.30 | 0.36 | 34.5 | Sbc | 1e,4e | ||||
| NGC 4793 | 32.80 0.08 | 37.28 | 37.00 | 2.24 | 22.17 0.04 | 21.00 0.22 | 0.04 | 33.1 | Sc | 1e,2a,4e | |||
| IC 2050 | 34.59 0.08 | 37.18 | 36.88 | 2.95 | 22.44 0.30 | 0.05 | 164.9 | Sbc | 1e,4e | ||||
| NGC 1536 | 32.16 0.08 | 35.46 | 35.11 | 3.47 | 18.74 0.14 | 0.07 | 17.3 | Sc | 1e,4e | ||||
| IC 2073 | 33.03 0.08 | 36.42 | 36.17 | 2.10 | 19.87 0.15 | 0.03 | 53.0 | Scd | 1e,4e | ||||
| NGC 1602 | 32.15 0.08 | 35.58 | 35.31 | 2.45 | 18.20 0.16 | 0.03 | 17.0 | Im | 1e,4e | ||||
| NGC 5264 | 31.60 0.08 | 33.96 | 33.68 | 2.54 | 16.43 0.15 | 0.17 | 4.5 | Im | 1e,4f | ||||
| PGC 047958 | 33.05 0.08 | 36.61 | 36.32 | 2.90 | 20.15 0.20 | 0.17 | 60.9 | I | 1e,3f,4e | ||||
| IC 4275 | 33.35 0.08 | 36.55 | 36.28 | 2.36 | 20.17 0.20 | 0.19 | 57.5 | S | 1e,3f,4e | ||||
| IC 4248 | 33.02 0.08 | 36.83 | 36.59 | 1.93 | 20.46 0.20 | 0.21 | 55.1 | S | 1e,3f,4e | ||||
| NGC 3956 | 32.51 0.08 | 36.07 | 35.77 | 2.89 | 19.42 0.20 | 0.13 | 21.9 | Sc | 1e,3f,4e | ||||
| NGC 4027 | 32.74 0.08 | 36.89 | 36.63 | 2.21 | 20.76 0.04 | 0.14 | 22.3 | Sdm | 1e,4e | ||||
| NGC 6753 | 33.26 0.08 | 37.39 | 37.13 | 2.90 | 22.18 0.07 | 0.23 | 41.7 | Sb | 1e,4e | ||||
| IC 4845 | 32.94 0.08 | 36.86 | 36.50 | 3.79 | 22.23 0.14 | 0.19 | 52.7 | Sab | 1e,4e | ||||
| IC 4836 | 33.02 0.08 | 37.03 | 36.73 | 2.92 | 21.22 0.13 | 0.18 | 54.8 | Sc | 1e,4e | ||||
| IC 4819 | 32.29 0.08 | 35.45 | 35.14 | 3.31 | 18.47 0.20 | 0.20 | 24.5 | Sd | 1e,4e | ||||
| IC 4828 | 33.10 0.08 | 36.16 | 35.83 | 3.69 | 19.48 0.20 | 0.19 | 51.9 | S | 1e,4e | ||||
| PGC 062709 | 33.80 0.08 | 37.29 | 36.98 | 3.25 | 22.41 0.20 | 0.21 | 138.2 | Sbc | 1e,4e | ||||
| IC 4820 | 32.99 0.08 | 36.08 | 35.79 | 2.58 | 19.12 0.21 | 0.15 | 52.3 | Sd | 1e,4e | ||||
| PGC 039904 | 32.04 0.08 | 35.11 | 34.84 | 2.30 | 16.72 0.50 | 0.11 | 20.0 | BCD | 1e,4g | ||||
| NGC 4204 | 31.97 0.08 | 35.00 | 34.69 | 2.57 | 17.70 0.60 | 0.11 | 9.5 | Sdm | 1e,4h | ||||
| PGC 039194 | 33.28 0.08 | 36.83 | 36.44 | 2.82 | 21.52 0.18 | 20.59 0.15 | 0.09 | 83.1 | Sc | 1e,2a,3g,4e | |||
| NGC 4158 | 32.59 0.08 | 36.22 | 35.85 | 3.40 | 20.53 0.25 | 20.18 0.40 | 0.11 | 32.8 | Sb | 1e,2a,3h,4e | |||
| A 121116 | 33.44 0.08 | 36.71 | 36.47 | 1.70 | 21.71 0.16 | 21.11 0.50 | 0.12 | 95.0 | 1e,2a,4e | ||||
| PGC 038750 | 33.39 0.08 | 21.78 0.13 | 20.24 0.50 | 0.14 | 91.0 | E | 1e,2e,4e | ||||||
| NGC 4049 | 32.07 0.08 | 35.29 | 35.00 | 2.72 | 17.89 0.50 | 0.08 | 20.0 | I | 1e,4g | ||||
| NGC 4032 | 32.35 0.08 | 35.63 | 35.35 | 2.47 | 20.50 0.12 | 19.37 0.15 | 0.11 | 20.0 | Im | 1e,2a,4g | |||
| NGC 4455 | 32.09 0.08 | 35.01 | 34.69 | 3.32 | 18.09 0.50 | 0.07 | 11.6 | Sd | 1e,4i | ||||
| NGC 4635 | 32.42 0.08 | 35.75 | 35.44 | 3.25 | 19.47 0.20 | 0.09 | 26.0 | Sd | 1e,3i,4d | ||||
| NGC 4615 | 33.45 0.08 | 36.90 | 36.60 | 2.89 | 21.71 0.08 | 20.74 0.15 | 0.05 | 62.9 | Scd | 1e,2a,3g,4e | |||
| IC 3591 | 32.10 0.08 | 35.28 | 35.05 | 1.60 | 17.96 0.50 | 0.08 | 21.8 | Sm | 1e,4i | ||||
| NGC 4532 | 33.11 0.08 | 36.82 | 36.62 | 1.74 | 22.03 0.04 | 20.31 0.09 | 0.07 | 26.8 | Im | 1e,2a,4e | |||
| IC 3521 | 31.88 0.08 | 35.74 | 35.48 | 2.23 | 20.24 0.19 | 18.38 0.50 | 0.07 | 20.0 | Sm | 1e,2a,4g | |||
| IC 3414 | 32.05 0.08 | 35.21 | 34.90 | 3.17 | 18.17 0.50 | 0.06 | 20.0 | Sm | 1e,4g | ||||
| NGC 4423 | 32.06 0.08 | 35.42 | 35.15 | 2.33 | 20.16 0.22 | 18.17 0.50 | 0.07 | 20.0 | Sm | 1e,2a,4g | |||
| NGC 4430 | 32.32 0.08 | 35.94 | 35.62 | 3.60 | 20.50 0.12 | 19.37 0.50 | 0.06 | 20.0 | Sb | 1e,2a,4g | |||
| NGC 4470 | 32.48 0.08 | 36.02 | 35.74 | 2.45 | 20.87 0.07 | 19.18 0.50 | 0.08 | 20.0 | Sa | 1e,2a,4g | |||
| NGC 4376 | 32.22 0.08 | 35.54 | 35.28 | 2.20 | 18.38 0.50 | 0.08 | 20.0 | Im | 1e,4g | ||||
| IC 3322A | 32.23 0.08 | 36.29 | 35.97 | 3.16 | 20.98 0.07 | 19.07 0.50 | 0.08 | 25.0 | Im | 1e,2a,4d4i | |||
| IC 3268 | 32.26 0.08 | 35.59 | 35.32 | 2.40 | 20.33 0.17 | 18.09 0.50 | 0.08 | 20.0 | Sm | 1e,2a,4g | |||
| PGC 040993 | 32.41 0.08 | 35.53 | 35.26 | 2.18 | 20.44 0.20 | 18.64 0.50 | 0.07 | 26.0 | Sbc | 1e,2a,4i | |||
| NGC 4451 | 32.36 0.08 | 36.43 | 36.14 | 2.71 | 20.89 0.12 | 20.11 0.13 | 0.06 | 32.0 | Sbc | 1e,2a,4i | |||
| NGC 4276 | 32.52 0.08 | 36.04 | 35.72 | 3.45 | 20.01 0.50 | 0.09 | 34.9 | Sc | 1e,4e | ||||
| IC 3107 | 33.30 0.08 | 36.97 | 36.68 | 2.80 | 21.86 0.12 | 21.47 0.50 | 0.13 | 97.2 | Sbc | 1e,2a,4e | |||
| NGC 4383 | 32.62 0.08 | 36.53 | 36.32 | 1.51 | 21.25 0.05 | 19.46 0.10 | 0.08 | 20.0 | Sa | 1e,2a,4g | |||
| IC 0800 | 32.15 0.08 | 35.40 | 35.10 | 2.93 | 18.13 0.50 | 0.12 | 20.0 | Sc | 1e,4g | ||||
| NGC 4523 | 32.59 0.08 | 35.46 | 35.14 | 3.41 | 20.14 0.23 | 17.52 0.16 | 0.13 | 20.0 | Sm | 1e,2a,4g | |||
| NGC 4396 | 32.35 0.08 | 35.94 | 35.62 | 3.39 | 20.99 0.06 | 19.01 0.12 | 0.09 | 20.0 | Sd | 1e,2a,4g | |||
| IC 0797 | 32.18 0.08 | 35.69 | 35.40 | 2.93 | 20.83 0.07 | 18.61 0.50 | 0.10 | 20.0 | Sc | 1e,2f,4g | |||
| IC 3476 | 32.43 0.08 | 35.88 | 35.61 | 2.40 | 20.56 0.11 | 18.90 0.15 | 0.12 | 20.0 | Im | 1e,2a,4g | |||
| NGC 4670 | 32.20 0.08 | 35.60 | 35.38 | 1.70 | 20.36 0.07 | 17.72 0.15 | 0.05 | 11.8 | S0 | 1e,2a,4j | |||
| NGC 6744 | 32.80 0.08 | 36.32 | 35.96 | 3.86 | 19.62 0.20 | 0.14 | 6.5 | Sbc | 1e,3k,4k | ||||
| NGC 4152 | 32.64 0.08 | 36.33 | 36.07 | 2.12 | 21.19 0.05 | 19.40 0.11 | 0.11 | 20.0 | Sc | 1e,2a,4g | |||
| NGC 4651 | 32.54 0.08 | 36.55 | 36.27 | 2.71 | 21.21 0.05 | 20.77 0.09 | 0.09 | 20.0 | Sc | 1e,2a,4g | |||
| NGC 4689 | 32.35 0.08 | 36.37 | 36.03 | 4.31 | 20.78 0.08 | 20.63 0.09 | 0.07 | 20.0 | Sbc | 1e,2a,4g | |||
| NGC 4535 | 32.95 0.08 | 36.68 | 36.38 | 2.94 | 21.38 0.04 | 21.12 0.09 | 0.06 | 16.0 | Sc | 1e,2a,4l | |||
| NGC 4519 | 32.77 0.08 | 36.31 | 36.05 | 1.71 | 20.97 0.06 | 19.86 0.07 | 0.07 | 21.0 | Sd | 1e,2a,4d | |||
| NGC 4522 | 32.01 0.08 | 35.76 | 35.45 | 3.23 | 20.81 0.05 | 18.83 0.40 | 0.07 | 15.6 | Scd | 1e,2a,4d | |||
| NGC 4567/8 | 32.51 0.08 | 36.99 | 36.74 | 2.83 | 21.81 0.04 | 21.31 0.30 | 0.11 | 20.0 | Int | 1e,2f,4g | |||
| NGC 4416 | 32.84 0.08 | 36.46 | 36.13 | 2.90 | 21.01 0.15 | 20.80 0.40 | 0.08 | 42.0 | Scd | 1e,2a,4i | |||
| NGC 4411B | 32.79 0.08 | 35.88 | 35.52 | 4.45 | 20.01 0.11 | 0.10 | 28.0 | Scd | 1e,4i | ||||
| NGC 4424 | 31.90 0.08 | 36.17 | 35.94 | 1.79 | 20.27 0.18 | 19.91 0.09 | 0.07 | 20.0 | Sa | 1e,2a,4g | |||
| NGC 4380 | 32.09 0.08 | 35.84 | 35.46 | 4.95 | 19.91 0.10 | 0.08 | 20.0 | Sb | 1e,4g | ||||
| NGC 4438 | 32.30 0.08 | 36.31 | 36.10 | 2.75 | 21.48 0.04 | 21.43 0.07 | 0.09 | 20.0 | S0 | 1e,2a,4g | |||
| NGC 4413 | 32.37 0.08 | 35.85 | 35.55 | 3.07 | 19.36 0.16 | 0.10 | 20.0 | Sab | 1e,4g | ||||
| NGC 4351 | 32.16 0.08 | 35.66 | 35.37 | 2.85 | 18.97 0.15 | 0.10 | 20.0 | Sab | 1e,4g | ||||
| NGC 4299 | 32.56 0.08 | 20.92 0.06 | 19.13 0.13 | 0.11 | 20.0 | Sdm | 1e,2a,4g | ||||||
| NGC 4178 | 32.62 0.08 | 36.21 | 35.91 | 3.83 | 21.16 0.05 | 20.19 0.09 | 0.09 | 20.0 | Sdm | 1e,2a,4g | |||
| NGC 4498 | 32.49 0.08 | 35.95 | 35.64 | 3.25 | 20.28 0.18 | 19.40 0.40 | 0.10 | 20.0 | Sd | 1e,2a,4g | |||
| NGC 4595 | 32.32 0.08 | 35.82 | 35.50 | 3.09 | 20.35 0.16 | 19.33 0.40 | 0.12 | 20.0 | Sb | 1e,2a,4g | |||
| NGC 4654 | 32.91 0.08 | 36.93 | 36.65 | 2.67 | 21.77 0.04 | 0.210 0.062 | 21.09 0.10 | 0.08 | 20.0 | 34.15 | 0.61 | Scd | 1e,2a,4g,5c |
| NGC 4298 | 32.39 0.08 | 36.77 | 36.42 | 3.85 | 20.28 0.09 | 0.12 | 20.0 | Sc | 1e,4g | ||||
| NGC 4254 | 33.14 0.08 | 37.34 | 37.04 | 2.67 | 22.31 0.04 | 0.065 0.039 | 21.76 0.08 | 0.13 | 20.0 | 34.73 | 0.84 | Sc | 1e,2a,4g,5c5d |
| NGC 0450 | 36.12 | 35.88 | 2.05 | 20.80 0.08 | 18.97 0.30 | 0.13 | 21.3 | BCD | 2a,3l,4m | ||||
| NGC 1741 | 37.15 | 36.94 | 1.49 | 22.13 0.05 | 21.45 0.50 | 0.17 | 59.8 | BCD | 2g,4m | ||||
| NGC 2366 | 34.76 | 34.50 | 1.33 | 19.56 0.06 | 17.23 0.12 | 0.12 | 3.9 | BCD | 2a,4m | ||||
| MRK 0162 | 37.07 | 36.84 | 1.23 | 22.25 0.06 | 20.66 0.50 | 0.03 | 96.6 | BCD | 2g,4m | ||||
| UM 448 | 37.37 | 37.15 | 1.04 | 22.38 0.05 | 20.36 0.50 | 0.08 | 78.5 | BCD | 2a,4m | ||||
| UGC 06850 | 35.37 | 35.17 | 0.95 | 20.31 0.13 | 17.24 0.50 | 0.06 | 17.2 | BCD | 2a,4m | ||||
| NGC 4861 | 33.11 0.12 | 36.11 | 35.86 | 1.25 | 20.97 0.08 | 19.72 0.31 | 0.03 | 25.2 | BCD | 2a,4m | |||
| SBS 1533574 | 35.89 | 35.66 | 1.58 | 21.16 0.17 | 17.97 0.60 | 0.04 | 53.2 | BCD | 2g,3m,4m | ||||
| NGC 2146 | 32.32 0.11 | 37.45 | 37.22 | 1.41 | 22.43 0.04 | 0.148 0.040 | 20.53 0.13 | 0.31 | 14.5 | 34.05 | Sab | 1f,1bccBell & Kennicutt (2001) presents all of the data for this galaxy except for the UV flux and radio luminosity: the UV flux is taken from Rifatto, Longo & Capaccioli (1995b).,2a | |
| NGC 2595 | 33.41 0.07 | 36.74 | 36.43 | 3.29 | 21.65 0.08 | 21.67 0.14 | 0.13 | 57.7 | Sc | 1f,2a,4e | |||
| NGC 2976 | 31.55 0.12 | 35.32 | 35.05 | 2.72 | 19.83 0.04 | 17.67 0.13 | 0.23 | 3.3 | Sc | 1f,2a,4e | |||
| NGC 3027 | 32.53 0.12 | 35.47 | 35.20 | 3.02 | 19.10 0.16 | 0.11 | 14.1 | Sd | 1f,4e | ||||
| NGC 3077 | 31.64 0.08 | 35.43 | 35.20 | 1.83 | 19.75 0.05 | 18.38 0.13 | 0.22 | 4.0 | I | 1f,2a,4n | |||
| NGC 3206 | 32.35 0.12 | 35.44 | 35.17 | 2.30 | 18.98 0.50 | 0.05 | 15.4 | Scd | 1f,4e | ||||
| A 102954 | 32.38 0.12 | 36.29 | 36.03 | 1.14 | 20.91 0.06 | 18.77 0.50 | 0.04 | 20.2 | Im | 1f,2a,4o | |||
| NGC 3440 | 32.23 0.12 | 35.67 | 35.40 | 2.29 | 20.71 0.12 | 18.66 0.50 | 0.04 | 25.4 | Sb | 1f,2a,4e | |||
| NGC 3445 | 33.02 0.12 | 36.26 | 36.05 | 2.03 | 21.33 0.05 | 19.68 0.20 | 0.02 | 27.6 | Sm | 1f,2a,4e | |||
| NGC 3448 | 32.54 0.18 | 36.35 | 36.13 | 1.88 | 21.30 0.04 | 19.26 0.13 | 0.04 | 18.0 | I | 1f,2a,4e | |||
| NGC 3488 | 32.70 0.13 | 36.24 | 35.90 | 3.75 | 20.05 0.50 | 0.04 | 39.9 | Sc | 1f,4e | ||||
| NGC 3556 | 32.27 0.05 | 36.60 | 36.33 | 2.51 | 21.47 0.04 | 0.085 0.049 | 19.87 0.10 | 0.06 | 9.3 | 33.70 | Scd | 1f,2a,4e,5d | |
| NGC 3623 | 32.13 0.20 | 36.18 | 35.80 | 5.11 | 20.30 0.09 | 21.40 0.05 | 0.08 | 13.5 | Sa | 1f,2a,4p | |||
| NGC 3646 | 33.66 0.12 | 22.43 0.04 | 22.71 0.13 | 0.08 | 56.6 | Sbc | 1f,2a,4e | ||||||
| NGC 3726 | 33.05 0.12 | 36.69 | 36.36 | 3.40 | 21.14 0.05 | 0.085 0.049 | 21.14 0.09 | 0.05 | 20.0 | 34.24 | Sc | 1f,2a,4h,5e | |
| NGC 3782 | 32.05 0.12 | 35.20 | 34.90 | 2.85 | 20.05 0.09 | 17.53 0.50 | 0.06 | 9.9 | Scd | 1f,2a,4e | |||
| A 113746 | 32.01 0.12 | 34.79 | 34.51 | 2.50 | 17.76 0.50 | 0.09 | 11.3 | Sm | 1f,4e | ||||
| NGC 3811 | 32.83 0.12 | 36.73 | 36.48 | 2.30 | 21.44 0.07 | 20.86 0.40 | 0.06 | 41.4 | Scd | 1f,2a,4e | |||
| NGC 3877 | 32.33 0.12 | 36.73 | 36.41 | 3.00 | 21.29 0.05 | 20.59 0.10 | 0.08 | 20.0 | Sc | 1f,2a,4h | |||
| NGC 3888 | 32.75 0.06 | 36.82 | 36.56 | 2.52 | 21.58 0.05 | 20.45 0.15 | 0.04 | 32.1 | Sc | 1f,2a,4e | |||
| NGC 3893 | 33.14 0.12 | 36.96 | 36.68 | 2.61 | 21.83 0.04 | 21.07 0.50 | 0.07 | 20.0 | Sc | 1f,2a,4h | |||
| NGC 3906 | 32.26 0.12 | 35.52 | 35.22 | 3.01 | 18.59 0.50 | 0.08 | 20.0 | Sd | 1f,4h | ||||
| NGC 3913 | 32.26 0.12 | 35.49 | 35.20 | 2.90 | 18.95 0.11 | 0.04 | 20.0 | Sd | 1f,4h | ||||
| NGC 3928 | 32.07 0.06 | 36.13 | 35.87 | 1.81 | 20.77 0.08 | 19.02 0.13 | 0.06 | 20.0 | Sb | 1f,2a,4h | |||
| NGC 3938 | 33.18 0.12 | 36.80 | 36.49 | 2.99 | 21.49 0.04 | 21.19 0.10 | 0.07 | 20.0 | Sc | 1f,2a,4h | |||
| NGC 3949 | 32.99 0.12 | 36.79 | 36.53 | 2.33 | 21.75 0.04 | 20.49 0.15 | 0.07 | 20.0 | Sbc | 1f,2a,4h | |||
| NGC 3953 | 32.70 0.12 | 36.85 | 36.48 | 4.44 | 21.33 0.05 | 21.53 0.10 | 0.10 | 20.0 | Sbc | 1f,2a,4h | |||
| NGC 3972 | 32.22 0.12 | 35.93 | 35.58 | 3.61 | 20.48 0.12 | 19.23 0.16 | 0.05 | 20.0 | Sbc | 1f,2a,4h | |||
| NGC 3985 | 32.34 0.12 | 35.91 | 35.63 | 2.41 | 20.84 0.07 | 18.99 0.50 | 0.09 | 20.0 | Sm | 1f,2a,4h | |||
| A 115449 | 32.55 0.12 | 35.74 | 35.40 | 3.79 | 19.50 0.50 | 0.10 | 20.0 | Sd | 1f,4h | ||||
| NGC 4010 | 32.03 0.12 | 36.16 | 35.83 | 4.03 | 20.99 0.06 | 19.08 0.50 | 0.08 | 20.0 | Sd | 1f,2a,4h | |||
| A 115652 | 32.54 0.12 | 35.47 | 35.10 | 4.59 | 18.69 0.50 | 0.09 | 20.0 | Scd | 1f,4h | ||||
| NGC 4068 | 31.55 0.12 | 34.09 | 33.77 | 3.66 | 16.25 0.50 | 0.07 | 5.2 | Im | 1f,4q | ||||
| NGC 4189 | 33.24 0.12 | 36.90 | 36.61 | 2.93 | 21.53 0.06 | 21.38 0.08 | 0.11 | 40.0 | Scd | 1f,2a,4p | |||
| NGC 4190 | 30.96 0.12 | 33.92 | 33.60 | 3.30 | 18.89 0.14 | 14.50 0.31 | 0.10 | 3.5 | Im | 1f,2a,4r | |||
| IC 3061 | 32.93 0.12 | 36.28 | 35.95 | 3.61 | 19.90 0.09 | 0.12 | 47.0 | Sc | 1f,4p | ||||
| A 121236B | 31.86 0.12 | 34.77 | 34.55 | 1.54 | 17.05 0.50 | 0.05 | 12.6 | Sdm | 1f,4e | ||||
| NGC 4212 | 32.76 0.12 | 36.78 | 36.47 | 2.61 | 21.27 0.05 | 20.87 0.08 | 0.11 | 24.2 | Sc | 1f,2a,4p | |||
| NGC 4217 | 32.00 0.12 | 36.82 | 36.55 | 3.98 | 21.76 0.04 | 20.39 0.10 | 0.06 | 20.0 | Sb | 1f,2a,4h | |||
| NGC 4234 | 32.39 0.12 | 35.99 | 35.69 | 2.66 | 20.37 0.15 | 18.87 0.20 | 0.06 | 20.0 | Sm | 1f,2a,4h | |||
| NGC 4237 | 32.72 0.12 | 36.71 | 36.40 | 3.32 | 20.87 0.13 | 20.98 0.11 | 0.10 | 32.0 | Sbc | 1f,2a,4p | |||
| NGC 4274 | 32.12 0.12 | 36.50 | 36.23 | 3.05 | 20.75 0.09 | 21.32 0.13 | 0.07 | 21.4 | Sab | 1f,2a,4p | |||
| NGC 4275 | 32.55 0.12 | 36.34 | 36.03 | 2.32 | 20.92 0.11 | 19.01 0.50 | 0.07 | 30.8 | S | 1f,2a,4e | |||
| NGC 4273 | 33.15 0.12 | 37.30 | 37.03 | 2.00 | 22.14 0.04 | 21.11 0.09 | 0.06 | 38.2 | Sc | 1f,2a,4p | |||
| NGC 4303A | 32.19 0.12 | 35.20 | 34.95 | 1.89 | 18.04 0.09 | 0.08 | 15.5 | Scd | 1f,4d | ||||
| NGC 4314 | 32.44 0.21 | 35.84 | 35.63 | 1.88 | 20.41 0.07 | 20.05 0.15 | 0.08 | 12.8 | Sa | 1f,2a,4e | |||
| IC 3255 | 33.31 0.06 | 36.71 | 36.46 | 2.10 | 19.76 1.00 | 0.08 | 86.4 | Sbc | 1f,4e | ||||
| IC 3258 | 31.64 0.06 | 35.38 | 35.13 | 1.96 | 18.52 0.13 | 0.11 | 20.0 | Im | 1f,4h | ||||
| NGC 4369 | 32.19 0.12 | 36.12 | 35.89 | 1.96 | 20.74 0.05 | 19.13 0.13 | 0.08 | 13.9 | Sa | 1f,2a,4e | |||
| NGC 4390 | 32.03 0.06 | 35.64 | 35.36 | 2.52 | 18.91 0.50 | 0.10 | 20.0 | Sbc | 1f,4h | ||||
| NGC 4393 | 32.02 0.12 | 34.89 | 34.54 | 4.25 | 19.98 0.10 | 18.00 0.50 | 0.09 | 10.1 | Sd | 1f,2e,4s | |||
| NGC 4402 | 32.19 0.06 | 36.81 | 36.47 | 3.22 | 21.30 0.05 | 19.98 0.50 | 0.09 | 25.0 | Sb | 1f,2a,4p4d | |||
| NGC 4412 | 32.39 0.12 | 36.18 | 35.91 | 1.87 | 20.85 0.07 | 18.96 0.50 | 0.06 | 20.0 | Sb | 1f,2a,4h | |||
| NGC 4420 | 32.34 0.12 | 35.92 | 35.68 | 2.47 | 18.64 0.50 | 0.06 | 15.0 | Sbc | 1f,4t | ||||
| NGC 4457 | 31.65 0.12 | 35.85 | 35.61 | 1.97 | 20.56 0.05 | 19.37 0.16 | 0.07 | 11.0 | S0 | 1f,2a,4t | |||
| NGC 4480 | 32.76 0.12 | 36.38 | 36.06 | 3.48 | 20.61 0.23 | 20.30 0.11 | 0.08 | 34.0 | Sc | 1f,2a,4t | |||
| NGC 4490 | 32.80 0.06 | 36.51 | 36.31 | 1.80 | 21.81 0.04 | 0.049 0.025 | 19.80 0.06 | 0.07 | 8.0 | 34.28 | Sd | 1f,2h,4u,5f | |
| NGC 4525 | 31.98 0.06 | 35.55 | 35.17 | 5.28 | 19.28 0.50 | 0.07 | 20.0 | Scd | 1f,4h | ||||
| NGC 4568 | 32.87 0.06 | 37.34 | 37.05 | 2.79 | 22.03 0.04 | 21.37 0.09 | 0.11 | 26.0 | Sbc | 1f,2a,4p | |||
| NGC 4605 | 32.05 0.04 | 35.70 | 35.46 | 2.29 | 20.43 0.04 | 18.30 0.09 | 0.05 | 5.2 | Sc | 1f,2a,4v | |||
| NGC 4618 | 32.20 0.12 | 35.48 | 35.22 | 2.65 | 20.26 0.05 | 18.35 0.04 | 0.07 | 6.5 | Sm | 1f,2a,4d | |||
| NGC 4625 | 31.39 0.12 | 35.03 | 34.72 | 2.97 | 19.65 0.11 | 17.00 0.04 | 0.06 | 7.2 | Sm | 1f,2a,4d | |||
| NGC 4632 | 32.30 0.12 | 36.06 | 35.80 | 2.90 | 20.94 0.05 | 19.01 0.50 | 0.08 | 14.0 | Sc | 1f,2a,4d | |||
| NGC 4634 | 32.08 0.12 | 36.38 | 36.12 | 2.83 | 21.20 0.05 | 19.21 0.09 | 0.09 | 20.0 | Scd | 1f,2a,4h4i | |||
| NGC 4642 | 32.58 0.12 | 36.21 | 35.90 | 3.08 | 21.11 0.10 | 19.66 0.50 | 0.08 | 36.0 | Sbc | 1f,2a,4p | |||
| NGC 4653 | 33.01 0.12 | 36.26 | 35.94 | 3.44 | 20.57 0.09 | 0.08 | 35.0 | Scd | 1f,4e | ||||
| NGC 4666 | 32.61 0.12 | 37.30 | 37.04 | 2.22 | 22.32 0.04 | 20.85 0.10 | 0.08 | 20.0 | Sc | 1f,2a,4d | |||
| NGC 4688 | 32.23 0.12 | 35.33 | 35.07 | 2.13 | 18.69 0.50 | 0.10 | 13.1 | Scd | 1f,4e | ||||
| NGC 4691 | 32.74 0.12 | 36.91 | 36.63 | 1.50 | 20.72 0.13 | 0.09 | 22.0 | S0 | 1f,4w | ||||
| NGC 4701 | 33.19 0.12 | 36.66 | 36.39 | 2.35 | 21.44 0.06 | 20.44 0.10 | 0.10 | 35.0 | Scd | 1f,2a,4p | |||
| NGC 4713 | 32.41 0.12 | 35.76 | 35.55 | 2.39 | 20.39 0.06 | 18.48 0.11 | 0.09 | 10.5 | Sd | 1f,2a,4d | |||
| NGC 4747 | 32.07 0.12 | 35.67 | 35.40 | 2.47 | 20.18 0.11 | 18.25 0.13 | 0.03 | 13.0 | Scd | 1f,2a,4d | |||
| NGC 4765 | 31.79 0.12 | 35.39 | 35.14 | 1.94 | 20.30 0.06 | 17.05 0.10 | 0.13 | 9.7 | S0 | 1f,2a,4e | |||
| NGC 4779 | 32.92 0.12 | 36.55 | 36.28 | 2.12 | 21.15 0.10 | 20.36 0.50 | 0.07 | 37.7 | Sbc | 1f,2a,4e | |||
| NGC 4808 | 32.61 0.12 | 36.58 | 36.30 | 2.23 | 21.46 0.04 | 19.89 0.10 | 0.12 | 20.0 | Scd | 1f,2a,4h | |||
| NGC 4868 | 33.90 0.12 | 37.27 | 37.00 | 2.64 | 22.09 0.05 | 21.62 0.50 | 0.05 | 62.2 | Sab | 1f,2a,4e | |||
| NGC 4900 | 32.84 0.12 | 36.53 | 36.25 | 2.26 | 21.35 0.04 | 20.21 0.17 | 0.08 | 20.0 | Sc | 1f,2a,4j | |||
| NGC 4961 | 32.44 0.12 | 36.27 | 35.99 | 2.74 | 21.09 0.10 | 19.13 0.23 | 0.04 | 33.8 | Scd | 1f,2a,4e | |||
| A 130734 | 31.68 0.12 | 34.56 | 34.28 | 2.53 | 16.21 0.50 | 0.03 | 10.8 | Scd | 1f,4e | ||||
| NGC 5012 | 33.09 0.12 | 36.72 | 36.43 | 2.93 | 21.64 0.05 | 20.76 0.50 | 0.05 | 34.9 | Sc | 1f,2a,4e | |||
| NGC 5016 | 32.59 0.12 | 36.43 | 36.11 | 3.01 | 20.87 0.15 | 19.85 0.50 | 0.04 | 34.8 | Sc | 1f,2a,4e | |||
| A 131036 | 32.19 0.12 | 35.03 | 34.72 | 3.16 | 17.43 0.16 | 0.06 | 12.6 | Im | 1f,4e | ||||
| A 131235 | 31.71 0.12 | 34.85 | 34.61 | 1.73 | 16.60 0.31 | 0.05 | 11.5 | Im | 1f,4e | ||||
| NGC 5195 | 33.12 0.12 | 36.07 | 35.79 | 1.87 | 20.87 0.04 | 19.97 0.07 | 0.12 | 7.6 | S0 | 1f,2a,4x | |||
| NGC 5320 | 33.07 0.12 | 36.38 | 36.06 | 3.45 | 20.97 0.12 | 20.54 0.50 | 0.02 | 34.9 | Sc | 1f,2a,4e | |||
| NGC 5350 | 33.25 0.12 | 36.63 | 36.32 | 3.95 | 21.29 0.06 | 21.15 0.12 | 0.04 | 30.9 | Sb | 1f,2a,4e | |||
| NGC 5368 | 32.97 0.12 | 36.80 | 36.55 | 2.23 | 21.62 0.09 | 20.70 0.50 | 0.04 | 61.9 | Sab | 1f,2a,4e | |||
| NGC 5371 | 33.41 0.12 | 37.11 | 36.75 | 3.36 | 21.93 0.04 | 22.07 0.14 | 0.03 | 34.0 | Sbc | 1f,2a,4e | |||
| NGC 5383 | 32.67 0.09 | 36.82 | 36.55 | 2.52 | 21.50 0.05 | 0.151 0.101 | 21.01 0.04 | 0.02 | 30.0 | 34.68 | Sb | 1f,2a,4e,5g | |
| NGC 5474 | 32.27 0.05 | 35.06 | 34.76 | 3.61 | 19.82 0.08 | 18.41 0.16 | 0.03 | 6.8 | Scd | 1f,2a,4e | |||
| NGC 5477 | 31.31 0.12 | 34.29 | 34.05 | 1.76 | 15.46 0.15 | 0.04 | 7.7 | Sm | 1f,4v | ||||
| NGC 5486 | 32.18 0.12 | 35.37 | 35.10 | 2.29 | 18.20 0.50 | 0.06 | 18.5 | Sm | 1f,4e | ||||
| NGC 5806 | 32.15 0.12 | 36.15 | 35.87 | 2.93 | 20.78 0.07 | 19.76 0.22 | 0.17 | 18.1 | Sb | 1f,2a,4e | |||
| NGC 5874 | 32.50 0.12 | 36.25 | 35.91 | 3.95 | 20.72 0.17 | 0.07 | 41.7 | Sc | 1f,4e | ||||
| NGC 5879 | 32.02 0.12 | 35.82 | 35.54 | 3.04 | 20.50 0.06 | 18.78 0.10 | 0.04 | 11.6 | Sbc | 1f,2a,4y | |||
| NGC 5907 | 32.71 0.07 | 36.69 | 36.31 | 5.21 | 21.39 0.04 | 0.208 0.052 | 20.43 0.11 | 0.03 | 14.0 | 33.78 | Sc | 1f,2a,4z,5d | |
| NGC 6207 | 32.24 0.12 | 35.89 | 35.65 | 2.74 | 20.74 0.05 | 18.70 0.10 | 0.05 | 11.4 | Sc | 1f,2a,4y | |||
| NGC 6503 | 31.63 0.04 | 35.33 | 35.03 | 2.85 | 19.76 0.05 | 17.66 0.09 | 0.10 | 3.6 | Scd | 1f,2a,4y | |||
| NGC 7625 | 32.15 0.04 | 36.71 | 36.45 | 2.01 | 21.54 0.04 | 19.68 0.13 | 0.08 | 21.8 | Sa | 1f,2a,4e | |||
| NGC 7677 | 33.07 0.12 | 37.00 | 36.74 | 1.50 | 21.66 0.06 | 20.33 0.13 | 0.14 | 47.4 | Sbc | 1f,2a,4e |
References. — UV data: (1a) Bell (2002); (1b) Bell & Kennicutt (2001); (1c) Measured directly from the IUE spectra; (1d) Goldader et al. (2002); (1e) Deharveng et al. (1994); (1f) Rifatto, Longo & Capaccioli (1995b) — Radio data: (2a) Condon et al. (2002); (2b) Condon et al. (1998); (2c) Becker, White & Helfand (1995); (2d) Wright et al. (1994); (2e) Gavazzi & Boselli (1999b); (2f) Gavazzi & Boselli (1999a); (2g) Hopkins et al. (2002); (2h) White & Becker (1992) — Optical -band data: (3a) Calzetti et al. (1995) assuming ; (3b) Maddox et al. (1990) assuming ; (3c) Spinoglio et al. (1995) assuming (the average for the other ULIRGs); (3d) de Vaucouleurs et al. (1991) assuming ; (3e) Han (1992); (3f) Lauberts & Valentijn (1989), by averaging and ; (3g) Gavazzi & Boselli (1996); (3h) Gavazzi & Boselli (1996)de Vaucouleurs et al. (1991); (3i) de Vaucouleurs et al. (1991)Takamiya, Kron & Kron (1995); (3k) de Vaucouleurs & Longo (1988); (3l) Mathewson & Ford (1996) converted from -band; (3m) Doublier et al. (1997) — Distances: (4a) Lee et al. (2002); (4b) Calzetti et al. (1994); (4c) Goldader et al. (2002); (4d) Teerikorpi et al. (1992); (4e) Hubble flow, assuming kms-1 Mpc-1; (4f) Karachentsev (2002); (4g) Virgo Cluster and Ursa Major Cluster distances following Shanks (1997) and Sakai et al. (2000); (4h) Jansen et al. (2000); (4i) Yasuda, Fukugita & Okamura (1997); (4j) Tully & Shaya (1984); (4k) Bottinelli et al. (1984); (4l) Macri et al. (1999); (4m) Hopkins et al. (2002); (4n) Tonry et al. (2001); (4o) Mas-Hesse & Kunth (1999); (4p) Ekholm et al. (2000); (4q) Makarova, Karachentsev & Georgiev (1997); (4r) Tikhonov & Karachentsev (1998); (4s) From membership in the Coma i cloud at 10 Mpc; (4t) Gavazzi et al. (1999); (4u) Clemens, Alexander & Green (1999); (4v) Karachentsev & Makarova (1996); (4w) Garcia-Barreto et al. (1995); (4x) Bell & Kennicutt (2001); (4y) Bottinelli et al. (1986); (4z) Zepf et al. (2000) — H data: (5a) Calzetti et al. (1995); (5b) Wu et al. (1998); (5c) Kennicutt & Kent (1983); (5d) Young et al. (1996); (5e) Romanishin (1990); (5f) Kennicutt et al. (1987); (5g) Sheth et al. (2000)
Note. — The IR data are taken from (in order of preference) Rice et al. (1988), Soifer et al. (1989), and Moshir et al. (1990). The optical data are taken from the RC3 (de Vaucouleurs et al., 1991) or the ESO-LV catalog (Lauberts & Valentijn, 1989) unless otherwise stated. Thermal radio fractions are taken from (in order of preference) Bell & Kennicutt (2001) and Niklas et al. (1997). Note that Bell & Kennicutt (2001) obtains thermal fractions from a variety of sources, with the majority from Niklas et al. (1997). Balmer decrements are taken from Bell & Kennicutt (2001) for normal galaxies (and are averages of individual H ii region Balmer decrements) and from Calzetti et al. (1994) and Wu et al. (1998) for starbursting galaxies and ULIRGs respectively.