The redshift determination of GRB 990506 and GRB 000418 with the Echellete Spectrograph Imager on Keck
Abstract
Using the Echellete Spectrograph Imager (ESI) on the Keck II 10-m telescope we have measured the redshifts of the host galaxies of gamma-ray bursts GRB 990506 and GRB 000418, and , respectively. Thanks to the excellent spectral resolution of ESI () we resolved the [O II] 3727 doublet in both cases. The measured redshift of GRB 990506 is the highest known for a dark burst GRB, though entirely consistent with the notion that dark and non-dark bursts have a common progenitor origin. The relative strengths of the [O II], He I, [Ne III], and H emission lines suggest that the host of GRB 000418 is a starburst galaxy, rather than a LINER or Seyfert 2. Since the host of GRB 000418 has been detected at sub-millimeter wavelengths these spectroscopic observations suggest that the sub-millimeter emission is due to star-formation (as opposed to AGN) activity. The [O II]-derived unobscured star-formation rates are 13 and 55 yr-1 for the hosts of GRB 990506 and GRB 000418, respectively. In contrast, the star-formation rate of the host of GRB 000418 derived from sub-millimeter observations is twenty times larger.
received 19 November 2002; accepted 4 December 2002
1 Introduction
The determination of redshifts continue to play a crucial rôle in the understanding of the physics of GRBs. Without redshifts, we are unable to translate observed fluences and angular burst-host offsets into physically meaningful quantities. That redshift is an integral part of the physical modeling of the afterglow is best demonstrated by the immense difficulty in modeling the afterglow of GRB 980329 (Yost et al., 2002), a GRB that enjoys an abundance of pan-chromatic afterglow observations but unfortunately lacked a measurement of redshift.
Emission spectra of GRB hosts themselves are valuable given the potential use of GRBs to infer the star-formation history of the Universe. Since -rays penetrate dust, a GRB-defined sample does not suffer from the well known biases of optical/UV samples. In addition, the high-accuracy astrometric localizations afforded by radio observations (with, e.g., the Very Large Array; VLA) and/or X-ray (Chandra) offer significant observational advantages over a sub-millimeter-defined sample. Indeed, one great hope for the utility of GRBs is in revealing the star-formation history at extremely high redshifts (e.g., Bromm & Loeb, 2002) since the brilliance of the prompt emission allows these events to be seen to redshifts well beyond 10 (Lamb & Reichart, 2000).
GRB 990506, is a canonical “dark burst,”111GRB 970828 is another such dark burst, with a similar detection history as GRB 990506 (Djorgovski et al., 2001a): later optical observations showed that the radio-localized host of GRB 970828 was a dusty galaxy at . with a radio-detected afterglow with no optical transient emission (Taylor et al., 2000). Since no transient optical emission was detected from the afterglow, an optical absorption-line redshift of GRB 990506 was impossible to obtain. Taylor et al. (2000) discovered an apparent two-galaxy system in optical data from Keck consistent with the radio transient position. Subsequent imaging from the Hubble Space Telescope (HST) revealed the putative two-galaxy system to be morphologically distinct (Holland et al., 2000). Bloom et al. (2002) later refined the radioHST astrometry to show that the radio afterglow position is only consistent with the southwest component; this component is identified as the host of GRB 990506. However, given the poor astrometric tie between the radio and the optical positions, as noted by Bloom et al., the GRB 990506–galaxy association is one of the more tenuous identifications of a host galaxy.
GRB 000418 is famous for two reasons. First, it is still one of the best cases for collimated ejecta of a GRB explosion (Berger et al., 2001). More important, the host galaxy has been detected in the radio (using the Very Large Array, VLA) and the sub-millimeter bands (using the Sub-millimeter Common User Bolometer Array, SCUBA, on the James Clerk Maxwell Telescope); see Berger et al. (2002). If the sub-mm emission arises from reprocessing of stellar UV light by dust (as opposed to arising from AGN activity) then the inferred star-formation rate is very high. If so, this galaxy can potentially provide information about the nature of these ultra-luminous galaxies and their contribution to the global star formation rate.
Here we present the spectroscopic observations of the hosts of GRB 000418 and GRB 990506. The discussion of GRB 000418 here expands our preliminary announcement of the redshift of the host (Bloom et al., 2000b). In §2 we describe the observations and reductions that led to the redshift determinations (presented in §§3–4). In §5 we discuss some of the implications of the redshift detections in the context of GRB host galaxies.
2 Observations and Reductions
The observations of both GRB host galaxies were obtained in the echellete mode of the Echellete Spectrograph Imager (ESI; Sheinis et al., 2002) on the Keck II 10-m telescope atop Mauna Kea, Hawaii. The detector is a pixel Lincoln Labs CCD with low readnoise (r.m.s. 2.6 electron) and small dark current (2.1 electron pixel-1 hr-1). The wavelength coverage is complete from Å to 1 m spanning 10 echellete orders (orders 15 through 6, increasing with wavelength). The (inverse) dispersion is nearly constant at 11.5 km s-1 pixel-1. For all of our observations we used the 1.0 arcsec 20.0 arcsec slit.
The putative host galaxies were identified as the galaxies nearest the astrometric position of the GRB afterglows. Bloom et al. (2002) estimated the chance that the afterglows were unrelated to the presumed host at (GRB 990506) and (GRB 000418). The brightness of these galaxies are mag (GRB 000418; Bloom et al., 2000a) and mag (GRB 990506; Taylor et al., 2000). Both the galaxies are compact (half-light radius 0.2 arcsec) as measured by HST/STIS observations (Metzger et al., 2000; Holland et al., 2000; Bloom et al., 2002). A summary of the observations of both GRB hosts is presented in Table 1. For both sources, we centered the slit on a bright nearby star and then offset the telescope to the host galaxy by a distance derived from our ground-based astrometric solution of the field. Exposures of the listed spectrophotometric standard stars from Oke (1990) were obtained immediately following the last GRB host exposure. All science and calibration data were taken near the parallactic angle.
The data were reduced and calibrated using the standard spectral reduction packages in IRAF222IRAF is distributed by the National Optical Astronomy Observatories, which are operated by the Association of Universities for Research in Astronomy, Inc., under cooperative agreement with the National Science Foundation., primarily the packages CCDRED, NOAO/ONEDSPEC and ECHELLE. For completeness we outline the steps taken. The data were first debiased using the overscan region of the CCD and then bad pixels were replaced using FIXPIX. A flat field was constructed from five domeflats taken at the beginning of the night and applied to the science data. Cosmic-rays were identified by finding statistically significant high-valued pixels in the ratio of each science image with the median of the science images. The cosmic ray pixels were then replaced using FIXPIX. Using IDENTIFY, REIDENTIFY, and FITCOORDS we characterized the curvature of the 10 echellete orders using a trace of a bright star which we stepped along the slit with a constant two arcsecond offset. A plate scale in the spatial direction for each echellete order was also obtained using these spectra. Rectification (setting the dispersion and spatial axes to be orthogonal) of the science image was performed using the task TRANSFORM with flux conservation.
In each image, the 10 orders were then cut into individual longslit 2-d spectra. The background sky was removed from each spectra using BACKGROUND. Since a feature near 8600 Å was readily identifiable (see below) in order seven (8006 Å 9377 Å) of each exposure of GRB 990506 we coadded the background subtracted spectra in order seven using IMCOMBINE by determining the offset in pixels along the spatial direction of this feature from exposure to exposure. Spectrograms in the other orders were combined by scaling the offsets determined in order seven using the empirically-determined spatial scales in each order. Similarly, for GRB 000418, we determined offsets using the emission feature at 7900 Å.
The continuum of the host of GRB 990506 is not detected in the blue (orders 15 to 9 corresponding to 3756 Å 7297 Å) and marginally detected in the three remaining red orders. Wavelength calibration was performed in the red orders using the night sky lines only. The density of these lines in the red is sufficiently high that arc line spectra were not required for wavelength calibration. In the seventh echellete order, a good wavelength solution was obtained with a seven order Legendre polynomial which resulted in an r.m.s. uncertainty of 0.16 Å. The small air-to-vacuum and heliocentric corrections were made using DISPTRANS, RVCORRECT, and DOPCOR. The flux calibration using the standard star observations were performed using STANDARD, SENSFUNC, and CALIBRATE.
We produced a final co-added flux calibrated spectrum of the host of GRB 000418 using the five 1200-s exposures (Table 1) and following the reduction procedure as described above for GRB 990506. We dereddened the 000418 host spectrum using the extinction measure of = 0.3296 from Schlegel et al. (1998). Unlike the case for GRB 990506, since the night was not photometric, a zero-point adjustment was made using the calibrated and extinction corrected Gunn i magnitude (i = 23.38 0.10 mag) from Berger et al. (2001) at the time of the spectroscopic observations. Using the zeropoint from Fukugita et al. (1995), the continuum flux at the effective wavelength of the Gunn i (for a spectrum with ) should have been Å) Jy whereas the measured value is 1.10 Jy. We thus scaled the spectrum by a factor of 1.93 and estimate a zeropoint error of 30%.
3 The Redshift of GRB 990506
We visually identified an apparent doublet emission feature near 8600 Å in order seven of each 900s spectrum. The spatial location of this feature was used to coadd the dithered spectra as described above. Unfortunately this apparent doublet is separated by a sky line (O-H 8597.4 Å). However, given that the sky line and the fringing at this wavelength are both relatively weak, we are confident that the sky subtraction did not significantly alter the morphology of the feature; that is, we believe the feature is indeed a doublet (such as [O II]) and not a single broad emission line (such as Lyman ). In fact the sky line only overlaps the redward wing of the bluer emission line; the shape and flux in the red emission line is largely unaffected by the sky line. A portion of the 2-dimensional spectrogram of the host of GRB 990506 is displayed in Figure 1. The [O II] emission doublet is clearly visible as is the faint continuum.
Using the -minimization deblending algorithm in IRAF/SPLOT we preliminarily fit two Gaussian profiles plus a continuum to the emission features in surrounding region allowing all the parameters to be fit independently. The central wavelengths of the two emission lines was found to be = 8596.80 Å and = 8603.25 Å. If we associate these lines with [O II] 3727.092, 3729.875 then the implied redshift is = 1.30657 and = 1.30658. That these two redshifts agree, greatly strengthens the association of these lines with [O II] emission.
Given the interpretation of the emission features as due to [O II], we refine the redshift determination by fixing the relative separation of the two features to be the ratio of the [O II] doublet in vacuo. Since the blueward line was closer in wavelength to the sky line we also fix the Gaussian FWHM of the blueward feature to be that of the redward feature (3.9 pixels). The emission redshift of the host of GRB 990506 so determined is . This includes the statistical uncertainty in the wavelength solution and the wavelength centering of the doublet.
A confirmation of the redshift using other emission lines proves difficult as most of the other strong nebular line emission features associated with star formation (H6563, H4861, [O III] 4363, 4959, 5007) are redshifted outside the ESI bandpass. However, the detection of the galaxy in the R-band (Taylor et al., 2000) implies that the feature could certainly not be Lyman 1216.
Assuming a flat CDM cosmology (e.g., de Bernardis et al., 2000) with km s-1 Mpc-1, , and the luminosity distance to the galaxy is cm and 1 arcsec is 9.03 kpc (physical) in projection.
4 The Redshift of GRB 000418
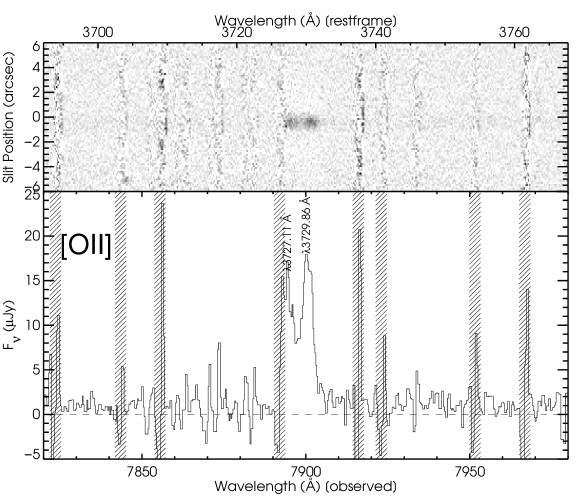
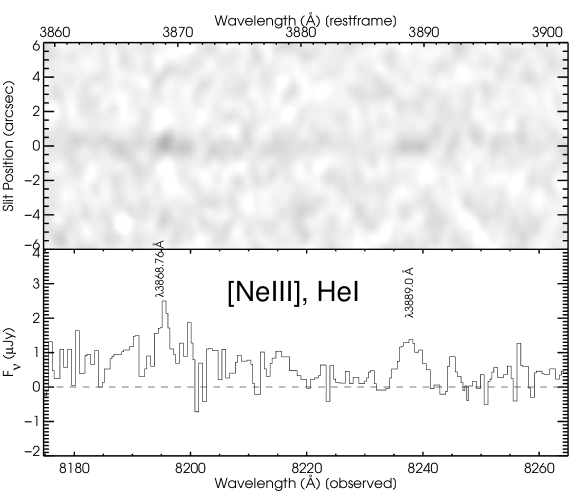
We detect a strong doublet at Å and identify this doublet with the [O II] doublet due to emission from the underlying host galaxy at redshift . A subsequent search for associated star-formation emission lines reveals the presence of three faint lines (He I, [Ne III], H ) in the spectrum which corroborate the redshift. The detection of H is marginal relative to the other detections. The identifications of the lines are listed in Table 2. The spectrum in the vicinity of [O II] and He I & Ne III are shown in Figure 2. Unlike in the spectrum of GRB 990506, the [O II] doublet is not particularly affected/overshadowed by a neighboring sky line, although the proximity of a faint sky line just blueward of the 3727.11 Å line adds to the uncertainty in the measured equivalent width (EW) and luminosity.
The luminosity weighted redshift using the [O II], He I and [Ne III] lines is . Using the cosmology assumed above, the luminosity distance to the galaxy is cm and 1 arcsec is 8.83 kpc (physical) in projection.
5 The Nature of the hosts galaxies
5.1 The Host Galaxy of GRB 990506
We estimate the unobscured star formation in the host by measuring the flux of the [O II] line. First, we assess the accuracy of our flux calibration. At 8600 Å we find that the flux of the continuum is 0.57 Jy with a red continuum, the slope of which is difficult to fit over a large wavelength range. Taking the continuum spectral index to be , with , the flux at the central wavelength of the filter is Å) Jy. Using the zeropoint from Fukugita et al. (1995), the corresponding R-band spectroscopic magnitude is mag. This spectrophotometric flux estimate agrees reasonably well with the photometric measurement of mag from Taylor et al. (2000). From the difference ( 0.1 mag) we estimate a conservative systematic uncertainty of our flux calibration at 20%.
Using the line-deblending method described above we found the observed flux in the emission doublet to be erg s-1 cm-2 and erg s-1 cm-2. According to the dust maps of Schlegel et al. (1998), the Galactic extinction in the direction of GRB 990506 is = 0.0686 mag. Assuming the extinction curve of Cardelli et al. (1989) the dereddened flux at 8600 Å is 10.7% higher than observed. The total dereddened flux in the [O II] line is thus, erg s-1 cm-2.
The total luminosity in the [O II] line is erg s-1. We have no a priori determination of the intrinsic extinction due to dust external to the Galaxy so this luminosity should be considered a lower limit. The implied unobscured star formation rate in the GRB host galaxy is, using the relation from Kennicutt (1992), 12.6 yr-1. This estimate is uncertain by 10% (statistical) and 20% (systematic).
In the restframe, the total equivalent width is EW Å. No comparison sample of field galaxy [O II] EW measures at comparable redshifts has yet been published, but it is clear that the EW is not especially higher than an extrapolation from the low-redshift sample of Hogg et al. (1998) [Aside from the redshift differences, we caution against the use of the Hogg sample as a representative sample for comparison to GRB hosts; galaxies in that sample were selected on the basis of optical magnitudes and, given the trend of decreasing EW with increasing apparent galaxy brightness, systematically selects against galaxies of high EW.] Nevertheless, to this end, the star formation rate per unit mass does not appear to be particularly high for star forming galaxies at comparable redshifts.
The observed EW in the two [O II] lines are EW Å and EW Å. The ratio of the lines EW3729/EW. This is consistent with the ratio expected (1.5) in the limit of low density in the host galaxy HII regions (Osterbrock, 1974). Note that the formal error on this ratio, found assuming the statistical errors quoted above on both lines, is likely an overestimate of the true uncertainty since the uncertainty in the continuum level—which is essentially the same for both lines—dominates the statistical error.
5.2 The Host Galaxy of GRB 000418
The fluxes and equivalent widths of the observed lines are given in Table 2 and were found using the same deblending method as above. None of the lines appear to be extended beyond the instrumental resolution; that is, all of the lines are narrow. The total (dereddend) flux in the [O II] line is erg s-1 cm-2 corresponding to a luminosity in the [O II] line of erg s-1. The implied unobscured star formation rate in the GRB host galaxy is, using the relation from Kennicutt (1992), 55 yr-1. This estimate is uncertain by 10% (statistical) and 30% (systematic).
The total observed equivalent width of the [O II] line is EWobs = 111 6 Å corresponding to a restframe EWrest = 52.4 2.8 Å. This does appear to be higher than an extrapolation of the Hogg sample and is suggestive of high star formation per unit mass. The ratio of the [Ne III] to [O II] flux is of interest both as a starburst/AGN discriminator (e.g., Rola et al., 1997) and because several other GRB hosts appear to have a large ratio, indicating very hot HII regions (e.g., Bloom et al., 2001). The observed ratio, , is lower than that inferred from GRB 970228 and rules out a Seyfert 2 origin of emission (following Fig. 4 of Rola et al., 1997). With the lines observed, we cannot directly address whether the galaxy is a LINER (both H and [O III] are redshifted outside the range of observability with ESI). However, assuming Case B recombination and little intrinsic extinction, the implied flux is erg s-1 cm-2. The implied flux ratios of [O II]/H and [Ne III]/H, then, place this source comfortably near starburst galaxies and sufficiently away from the locus of known LINERs (Fig. 3a of Rola et al., 1997). We thereby identify the host of GRB 000418 as a starburst galaxy.
The radio and sub-mm detections of the host galaxy of GRB 000418 also indicate a high star formation rate. We estimated the star formation rate using the formulation of Yun & Carilli (2002). As detailed in Berger et al. (2002), the flux density at 350 GHz, mJy, implies M⊙ yr-1, while the flux density at 8.46 GHz, Jy, implies M⊙ yr-1. For the radio-to-SFR conversion we assume (Fomalont et al., 2002). The discrepancy between the two SFR estimates is expected since in both cases there is a uncertainty in the flux density. Thus, the SFR implied from the long-wavelength observations is in the range M⊙ yr-1.
Clearly, this SFR estimate is about a factor of higher than the estimate from the [O II] emission. This is not surprising given that the [O II] luminosity is a measure of the unobscured SFR, and correction factors of for high redshift galaxies are not uncommon (Adelberger & Steidel, 2000). Interestingly, there was little to no host galaxy extinction inferred in the GRB afterglow itself (Berger et al., 2001).
6 Discussion and conclusion
Traditionally, low-resolution spectroscopy () has been used to determine emission-line redshifts of GRB hosts. Indeed, on the night previous to the [O II] detection of the host of GRB 990506 in echellete mode, a one hour low-resolution long-slit prism spectrum was obtained and no lines were detected. This non-detection motivated our subsequent use of the spectrograph in echellete (medium resolution) mode.
Medium- to high-resolution spectrometers have already been used for the detection of absorption-line redshifts of GRBs (Castro et al., 2000a, b; Mirabal et al., 2002; Savaglio et al., 2002), but the redshifts of the hosts of GRB 000418 and GRB 990506 are the first emission-line redshifts found with a medium-resolution () echellete spectrograph.
This point is worth highlighting from an observational perspective. Given that the throughput of ESI in echellete mode () is approximately 40% smaller than that of the prism long-slit (“high-throughput”) mode (cf. Sheinis et al., 2002), it is not immediately obvious why echellete spectroscopy would be able to detect the redshift of GRB 990506 whereas long-slit spectroscopy failed to detected the line. While both observing modes provide similar wavelength coverage and slit widths, however, the prism long-slit mode results in a lower dispersion with increasing wavelengths (from 1 Å/pixel at 4000 Å to 10 Å/pixel at 10,000 Å). This effect causes the numerous sky emission lines to overlap to the extent that, beyond about 6000 Å, almost all pixels are dominated by dispersed sky emission lines. In the echellete-mode, the sky lines are always resolved except for the largest slit widths. Even if sky subtraction were perfect, the noise from the high sky background levels in low-resolution mode more than mitigates, in terms of signal–to–noise, against the gain in throughput.
Is it clear from previous studies that GRB hosts contain moderate levels of unobscured star formation, resulting in strong Balmer line, [O II] and Ly emission-lines (see Djorgovski et al., 2001b, for review). Most GRBs, however, appear to occur at redshifts near unity and so H and Ly lines are outside the range of detectability for optical CCDs. At such redshifts, [O II], typically the third most luminous star-formation line, resides at () in the observer’s frame; however, this is the onset of the wavelength regime where the number of prominent sky lines becomes numerous and densely packed. As a faint, typically narrow line (observed FWHM Å), the [O II] line can be easily outshone from a nearby night sky line when the dispersion is low. This was clearly the case in GRB 990506 (Figure 1).
Medium-resolution spectroscopy also affords a better insight into the nature of any emission line detections. Specifically, the ambiguity of single line redshifts (see Stern et al., 2000) is essentially removed since the resolution of ESI is large enough to resolve the [O II] doublet (restframe separation of 2.75 Å) for redshifts greater than .
From the optical lines, we have shown that the unobscured star-formation rates in the hosts of GRB 990506 and GRB 000418 are and M⊙ yr-1, respectively. This may be contrasted with M⊙ yr-1 from sub-mm and radio observations of GRB 000418. Such a discrepancy has been observed in many high- galaxies and it is probably due to dust obscuration. Such a trend, for GRB galaxies, has been previously noted by comparing infrared photometry with spectroscopic star-formation indicators (Chary et al., 2002). More importantly, however, spectroscopy of GRB 000418 has allowed us to determine the redshift to a sub-mm galaxy. This is a significant result since there are only a handful of such galaxies with a measured redshift (e.g., Ledlow et al., 2002). This hints at the unique potential of GRB-selected galaxies in uncovering the redshift distribution of the population of sub-mm galaxies.
Since GRB 990506 is one of only a handful of well-studied dark bursts (also, GRB 000210, Piro et al. 2002 and GRB 970828, Djorgovski et al. 2001a) the measurement of a redshift near the median of other long-duration bursts may suggest a common progenitor population. This emerging trend, of similar redshift distributions, will almost certainly be testable with the advent of systematic absorption redshift determinations for Swift bursts.
References
- Adelberger & Steidel (2000) Adelberger, K. L. and Steidel, C. C. 2000, ApJ, 544, 218
- Berger et al. (2002) Berger, E., Cowie, L. L., Kulkarni, S. R., Frail, D. A., Aussel, H., and Barger, A. J. 2002, submitted to ApJ
- Berger et al. (2001) Berger, E. et al. 2001, ApJ, 556, 556
- Bloom et al. (2001) Bloom, J. S., Djorgovski, S. G., and Kulkarni, S. R. 2001, ApJ, 554, 678
- Bloom et al. (2002) Bloom, J. S., Kulkarni, S. R., and Djorgovski, S. G. 2002, AJ, 123, 1111
- Bloom et al. (2000a) Bloom, J. S. et al. 2000a, GCN notice 689
- Bloom et al. (2000b) —. 2000b, GCN notice 661
- Bromm & Loeb (2002) Bromm, V. and Loeb, A. 2002, ApJ, 575, 111
- Cardelli et al. (1989) Cardelli, J. A., Clayton, G. C., and Mathis, J. S. 1989, ApJ, 345, 245
- Castro et al. (2000a) Castro, S. M., Diercks, A., Djorgovski, S. G., Kulkarni, S. R., Galama, T. J., Bloom, J. S., Harrison, F. A., and Frail, D. A. 2000a, GCN notice 605
- Castro et al. (2000b) Castro, S. M. et al. 2000b, GCN notice 851
- Chary et al. (2002) Chary, R., Becklin, E. E., and Armus, L. 2002, ApJ, 566, 229
- de Bernardis et al. (2000) de Bernardis, P. et al. 2000, Nature, 404, 955
- Djorgovski et al. (2001a) Djorgovski, S. G., Frail, D. A., Kulkarni, S. R., Bloom, J. S., Odewahn, S. C., and Diercks, A. 2001a, ApJ, 562, 654
- Djorgovski et al. (2001b) Djorgovski, S. G. et al. 2001b, in Gamma-Ray Bursts in the Afterglow Era, Proceedings of the International workshop held in Rome, CNR headquarters, 17–20 October, 2000, ed. E. Costa, F. Frontera, & J. Hjorth (Berlin Heidelberg: Springer), 218
- Fomalont et al. (2002) Fomalont, E. B., Kellermann, K. I., Partridge, R. B., Windhorst, R. A., and Richards, E. A. 2002, AJ, 123, 2402
- Fukugita et al. (1995) Fukugita, M., Shimasaku, K., and Ichikawa, T. 1995, PASP, 107, 945
- Hogg et al. (1998) Hogg, D. W., Cohen, J. G., Blandford, R., and Pahre, M. A. 1998, ApJ, 504, 622
- Holland et al. (2000) Holland, S., Thomsen, B., Bjornsson, G., et al. 2000, GCN notice 731
- Kennicutt (1992) Kennicutt, Robert C., J. 1992, ApJ, 382, 310
- Lamb & Reichart (2000) Lamb, D. Q. and Reichart, D. E. 2000, ApJ, 536, 1
- Ledlow et al. (2002) Ledlow, M. J., Smail, I., Owen, F. N., Keel, W. C., Ivison, R. J., and Morrison, G. E. 2002, ApJ (Letters), 577, L79
- Metzger et al. (2000) Metzger, M., Fruchter, A., Masetti, N., et al. 2000, GCN notice 733
- Mirabal et al. (2002) Mirabal, N. et al. 2002, ApJ, 578, 818
- Oke (1990) Oke, J. B. 1990, AJ, 99, 1621
- Osterbrock (1974) Osterbrock, D. E. 1974, Astrophysics of gaseous nebulae (San Francisco: W. H. Freeman and Co.)
- Piro et al. (2002) Piro, L. et al. 2002, ApJ, 577, 680
- Rola et al. (1997) Rola, C. S., Terlevich, E., and Terlevich, R. J. 1997, MNRAS, 289, 419
- Savaglio et al. (2002) Savaglio, S. et al. 2002, GCN notice 1633
- Schlegel et al. (1998) Schlegel, D. J., Finkbeiner, D. P., and Davis, M. 1998, ApJ, 500, 525
- Sheinis et al. (2002) Sheinis, A. I., Bolte, M., Epps, H. W., Kibrick, R. I., Miller, J. S., Radovan, M. V., Bigelow, B. C., and Sutin, B. M. 2002, PASP, 114, 851
- Stern et al. (2000) Stern, D., Bunker, A., Spinrad, H., and Dey, A. 2000, ApJ, 537, 73
- Taylor et al. (2000) Taylor, G. B., Bloom, J. S., Frail, D. A., Kulkarni, S. R., Djorgovski, S. G., and Jacoby, B. A. 2000, ApJ (Letters), 537, L17
- Yost et al. (2002) Yost, S. A. et al. 2002, ApJ, 577, 155
- Yun & Carilli (2002) Yun, M. S. and Carilli, C. L. 2002, ApJ, 568, 88

| Name | Date | Int. Time | Airmass | Standard | Photometric? |
|---|---|---|---|---|---|
| (UT) | (sec) | (effective) | Star | ||
| GRB 990506 | 4.395 Apr 2000 | 7900 | 1.52 | Feige 67 | Yes |
| GRB 000418 | 1.319 May 2000 | 11200 | 1.01 | Feige 34 | No |
| 2.403 May 2000 | 51200 | 1.2 | Feige 66 | No |
| Line ID | Wavelengtha | EWb | |||
|---|---|---|---|---|---|
| Restframe | Observed | [erg cm2 s-1] | Å | ||
| [O II] | 3727.11 Å | 7894.42 Å | 2.8 | 1.11811 | |
| 3729.86 Å | 7900.23 Å | 3.8 | 1.11810 | ||
| [Ne III] | 3869.85 Å | 8196.96 Å | 2 | 1.11816 | |
| HeI | 3888.65 Å | 8239.6 Å | 2 | 1.1189 | |
| H | 4341.69 Å | 9202.8 Å | 4 | 1.1196 | |
a Both restframe and observed emission line wavelength are given in vacuum. The r.m.s. statistical uncertainty in the line centroiding is typically 0.3 Å and the overall wavelength calibration has an error of 0.1 Å (1 ). Statistical errors on the redshift derived from an individual line is typically .
b Observed equivalent width, uncorrected for the continuum contribution from the optical transient at the time of observation.