XMM-Newton detection of warm/hot intergalactic medium at
Abstract
We report a detection of a 21.82 Å absorption feature in the direction of the BL Lac MRK 421 which is interpreted as O vii K at . This corresponds to the redshift of a H absorber in a cosmic void detected by HST along the line of sight of the same object. The 21.82 Å line proves the existence of warm/hot intergalactic medium (WHIM) outside the Local Group, in agreement with current models of structure formation in the Universe. The WHIM at has temperature of K for gas densities in the range atom cm-3. We also detect O vii, O viii and Ne ix absorption lines with zero velocity, possibly connected with WHIM in the Local Group.
1 Introduction
In the local Universe % of the baryons visible at and
predicted by the Standard Big-Bang nucleosynthesis are undetected (e.g. Fukugita, Hogan, & Peebles, 1998).
Numerical simulations predict that such baryons, in the form of Ly
clouds (i.e. gas at K) and visible in the UV spectra of bright AGNs,
have been shock-heated during the formation of the structures in the Universe to
temperatures of K (i.e. the warm hot intergalactic medium, WHIM).
The most efficient way to detect such gas is through resonant absorption
lines from highly ionized metals (e.g. Ovi,Ovii,Oviii,Neix)
in the far UV and soft X-ray spectra of background sources (e.g. Hellsten, Gnedin, & Miralda-Escudé, 1998; Fang & Canizares, 2000).
Current far UV observations proved the existence of the low temperature tail
( K) of the WHIM through the detection of Ovi
up to (e.g. Sembach et al., 2000; Tripp et al., 2001).
However the bulk of the WHIM baryons (%, e.g. Fukugita, Hogan, & Peebles, 1998)
are expected to lie at higher temperatures ( K)
and their features should be detectable in the soft X-ray regime.
Chandra and XMM-Newton high resolution spectroscopy ()
brought to the detection of
a “zero redshift” Ovii absorption feature at 21.6 Å
in the spectra of four bright AGNs (PKS 2155-304, Nicastro et al. 2002; Fang et al. 2002;
Cagnoni et al. 2003; 3C 273, Fang, Sembach & Canizares 2003;
H1821643, Mathur, Weimberg & Chen 2002 and MRK 421, Nicastro et al. 2001),
interpreted as the signature of WHIM present within the Local Group.
The only published evidence of WHIM outside the Local Group is at (Fang et al., 2002),
however this feature is not confirmed in other Chandra and XMM-Newton
observations (e.g. Nicastro et al., 2002; Cagnoni et al., 2003).
In this paper I present strong evidence for an Ovii K absorption line
at in the spectrum of the BL Lac object MRK 421.
The paper is organized as follows:
§ 2 reports the XMM-Newton observations of MRK 421 and describes the data reduction;
§ 3 contains the spectral fits and the discussion on the observed WHIM absorption features.
§ 4 is a conclusive section containing a summary of the results.
2 Observations and data reduction
MRK 421 is a calibration target for XMM-Newton and has been observed several times from the launch (Dec. 10, 1999) up to the time of writing. Table 1 summarizes all the public observations as of December 3, 2002. MRK 421 X-ray spectrum is thought to be relativistically beamed synchrotron emission from energetic electrons and its intrinsic lack of features is the ideal laboratory to search for faint WHIM absorption lines. In this paper I will concentrate on the high resolution ( from 100 to 500, FWHM, or 100 to 800, HEW, in the energy range 0.33–2.5 keV - 5–38 Å) Reflection Grating Spectrometers (RGS1 and RGS2) data collected by the two XMM-Newton X-ray telescopes111I refer the reader to Sembay et al. (2002) for a detailed description of the observations and for and accurate spectral and timing analysis of EPIC data collected in 2000 and 2001.. XMM-Newton RGS effective areas are complex in shape, and contain tens of narrow dips due to bad or hot columns or pixels in the CCD detectors, which require extremely accurate calibration measurements for a proper modeling (e.g. Cagnoni et al., 2003). Current RGS calibration uncertainties are as accurate as % between 7 and 36 Å and, as a consequence, false absorption/emission features with such relative intensities, are expected in the RGS spectra in physical units, in proximity of the known instrumental features. The strongest resonant absorption lines from neutral and/or highly ionized O and Ne, fall in wavelength ranges (i.e. 13-14 Å, 18-20 Å, 20-24 Å) in which RGS-2 spectra either do not exist (20-24 Å, due to the failure of a CCD chip) or contain strong line-like shaped instrumental features (see Cagnoni et al., 2003). Therefore I rely on RGS-1 spectra, which, instead are relatively instrumental-feature-free in these wavelength ranges, and use RGS-2 to double check the reality of a line, when possible, and to cover the 10.5-14.2 Å region, where RGS-1 has a failed CCD chip. I also restrict our analysis to the first order spectra only.
I reprocessed the data using XMM-Newton Science Analysis System (SAS) version 5.3.0 and the latest calibration files as of December 3, 2002. Since the wavelength calibration of XMM grating spectra strongly depends on the position of the 0th order, I used the VLBI position as centroid of the 0th order source (Ma et al., 1998). Extraction regions, for source and background, were chosen to be, respectively, within the 95% and outside the 98% of the PSF. To exclude high particle background periods caused by solar activity, I extracted the background lightcurves from CCD-9 and excluded all the time intervals for which the background count rate was higher than count s-1. The net exposures for each observation are reported in Table 1.
In order to improve the signal to noise ratio (SNR) I combined all the RGS-1 order 1 spectra obtained with a pointing offset 222The inclusion of the off-axis data in the combined spectrum increases the number of photons at 20 Å from to per 0.06 Å resolution element, but degrades the quality of the spectrum. May 2002 observations, for example, are highly affected by hot columns and pixels which result in spurious features in and around the expected WHIM lines. To reduce the impact of hot columns and pixels, the RGS units have recently been cooled (November 2002). (see Table 1) and computed the combined RGS-1 response matrixes (a convolution of the detector response matrix and effective area, Fig. 1) using the PINTofALE interactive data language software suite (Kashyap & Drake, 2000). I did the same for RGS-2. The total net exposures are 125 ks and 122 ks for RGS-1 and RGS-2 respectively.
3 The WHIM detection
I fit the combined fluxed RGS-1 spectrum
in the wavelength range 14.2–38.1 Å
using version 2.2 of
SHERPA (Siemiginowska et al., in prep.) modeling and fitting tool
from the CXC analysis package CIAO 2.2 (Elvis et al., in prep.).
I used an absorbed power law model with
absorption characterized by a column density N(X) and an
absorption cross section for each element.
I included in the model H, He i and He ii (Rumph, Bowyer, & Vennes, 1994)
and heavier elements (Morrison & McCammon, 1983).
I fixed the Galactic hydrogen column density at cm-2 (Lockman & Savage, 1995) and the ratios
/=0.1 and /=0.01.
The best fit RGS-1 photon slope is
(corresponding to an energy photon slope of ) and the
normalization is 0.0136 photons cm-2 s-1 Å-1 at 20.5 Å.
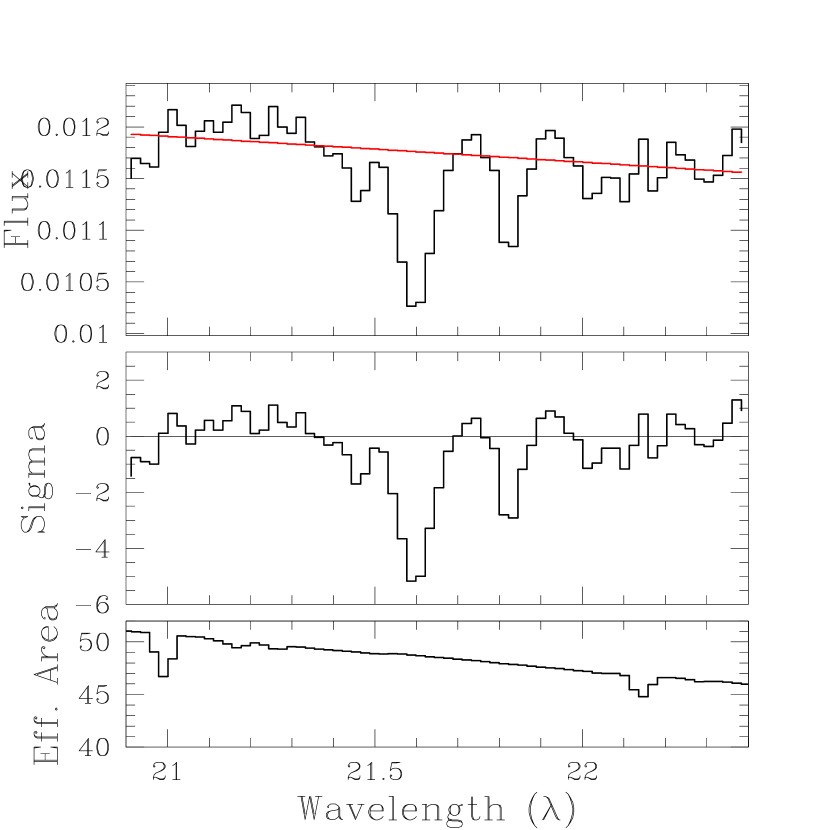
In order to properly model the continuum around the expected WHIM features,
I performed local absorbed power-law fits in the
18.0–20.6 Å and in the 20.9–22.4 Å regions.
I kept the absorbing column fixed to the Galactic value in MRK 421 direction
and modeled the absorption lines with Gaussian.
The lines detected at and the corresponding best fit parameters are listed in Table 2.
It appears to us that the only possible interpretation of
the 21.82 Å line ( detection; Fig. 1)
is redshifted O vii K. This places the gas producing it at
and makes this a solid X-ray detection of WHIM outside our local group of Galaxies.
The corresponding O vii K is expected to be too faint
(EW mÅ at Å) to be detected in this spectrum.
If any O viii were present in the WHIM, the strongest expected
line would be Ly at 19.18 Å, not detected in our spectrum.
The upper limit on the line EW, computed fixing the line FWHM
to the 21.82 Å line FWHM value, is 2.47 mÅ.
Under the assumption of unsaturated line the EW ratios between different
species depend on the gas temperature and density.
Using the ratio between the upper limit on the EW of O viii at
and the 21.82 Å line EW, I obtain an upper limit on the
gas temperature of K, for a gas density
of 1 atom cm-3 and of K, for a gas density
of atom cm-3 (see Fig. 5 in Nicastro et al., 2002).
These values are consistent with the temperature range predicted for the
WHIM emitting in the soft X-ray band.
I derive from the 21.82 Å line a velocity of km s-1,
consistent, within the errors, with the redshift of a strong H Ly
line detected by HST on MRK 421 spectrum ( km s-1) and coming
from absorbing material in a cosmic void (Shull, Stocke, & Penton, 1996; Penton, Stocke, & Shull, 2000).
The location of WHIM in a cosmic void is consistent with the picture that
such gas is connecting the overdense regions of the sky that collapsed
into clusters and groups during the structures formation.
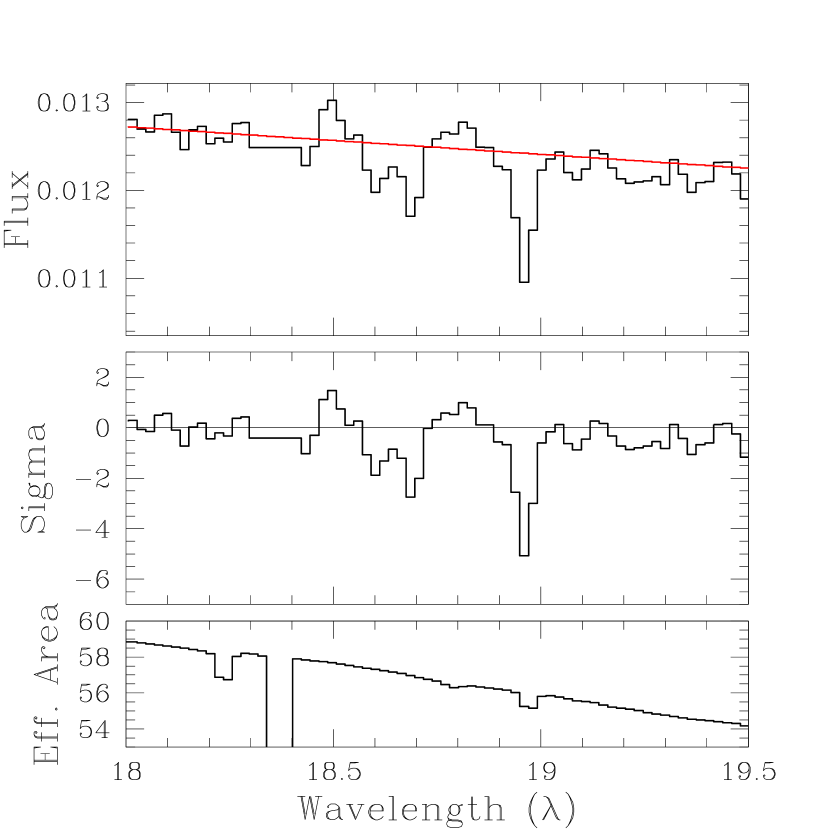
For the other lines listed in Table 2, the strongest is the O vii
K absorption at 21.6 Å (Fig. 1); the corresponding
O vii K is visible at 18.67 Å (Fig. 2).
The 21.6 Å feature has already been seen in MRK 421 itself (Nicastro et al., 2001)
and in other 4 AGNs (Nicastro et al., 2002; Fang et al., 2002; Cagnoni et al., 2003; Mathur, Weimberg & Chen, 2002; Fang, Sembach & Canizares, 2003) and it is usually attributed to
a WHIM within our local group of galaxies (e.g. Nicastro et al., 2002)
or to radiatively cooling gas inside our Galaxy (e.g. Heckman et al., 2002).
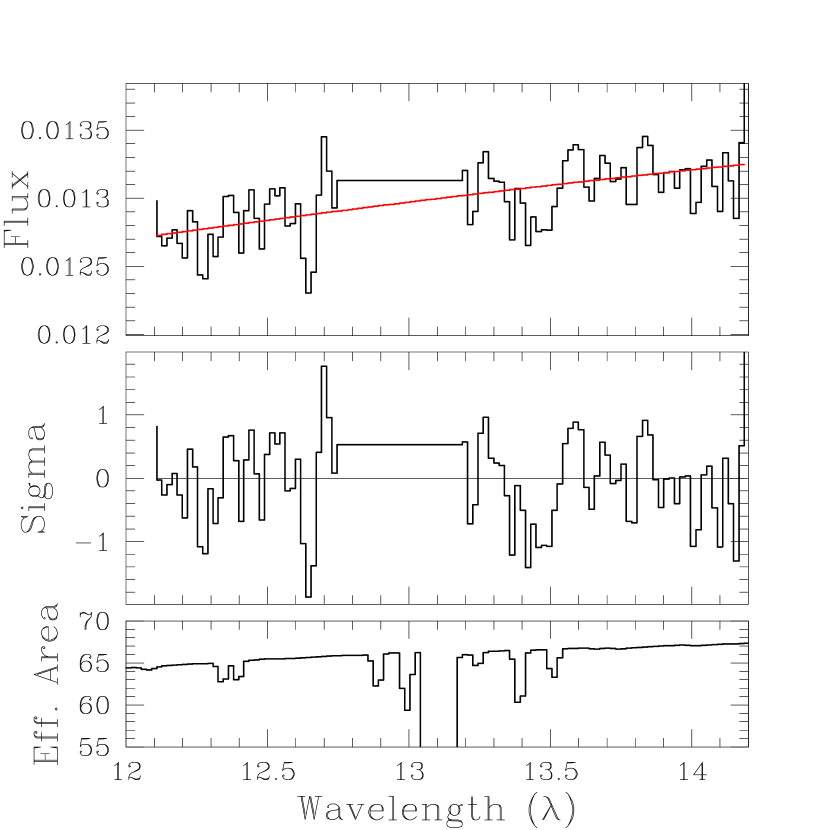
I also report the detection of zero redshift O viii Ly at
18.97 Å (Fig. 2) and of Neix K at 13.4 Å (Fig. 3).
Note however that these lines are affected by small features in the effective area.
The EW of the zero redshift features (O vii,O viii and Neix)
are compatible with those measured with Chandra for PKS2155-304
(Nicastro et al., 2002; Fang et al., 2002) and for MRK 421 (Nicastro et al., 2001). In particular,
the EW derived fixing the lines FWHM to the value of the 21.6 Å line,
(i.e. 0.33, 0.27 and 0.20 eV respectively)
are consistent with the lines being unsaturated and with column densities of
atoms cm-2 per ion species (see Fig. 4 in Nicastro et al., 2002).
For a gas density of atoms cm-3,
Neix/Ovii and O viii/Ovii ratios indicate gas
temperatures of K, and K, respectively (Fig. 5 of Nicastro et al., 2002).
These ranges move to K and K
in case of Galactic gas density.
Even if these estimates have to be regarded with caution because of the possible
modifications of the effective area features,
they are all consistent with the range of temperatures predicted for the WHIM.
4 Conclusion
I report strong evidence of WHIM outside our local group of galaxies through
the detection of a 21.82 Å O vii K absorption
line in the XMM-Newton RGS-1 spectrum of MRK 421.
The line redshift is , in agreement with that derived
for the strong H Ly absorption line detected by HST and related
to an absorber in a cosmic void. The three closest galaxies are at
2.14, 3.98 and 4.12 Mpc (Penton, Stocke, & Shull, 2000).
This detection is a firm proof the existence of a WHIM filament at
possibly connecting the nearby galaxies with other denser regions of the sky,
as expected by the models of the cosmic structures formation and evolution.
I derive an upper limit on the gas temperature of K
for a gas density of atom cm-3.
The only known similar evidences are a detection of
O viii at reported by Fang et al. (2002) in the Chandra
spectrum of PKS 2155-304 and the detections of two O vii
lines at in the Chandra spectrum of H1821643 (Mathur, Weimberg & Chen, 2002).
However Fang et al. (2002) feature is not confirmed in other Chandra and
XMM-Newton observations (e.g. Nicastro et al., 2002; Cagnoni et al., 2003).
I also detect the zero redshift absorption features of O vii, Ovii and Neix
with positions and EWs consistent with previous detections in the direction of other bright AGNs (e.g. Nicastro et al., 2002; Cagnoni et al., 2003).
References
- Cagnoni et al. (2003) Cagnoni, I. et al., 2003, ApJ in preparation
- Fang & Canizares (2000) Fang, T. & Canizares, C. R. 2000, ApJ, 539, 532
- Fang et al. (2002) Fang, T., Marshall, H. L., Lee, J. C., Davis, D. S., & Canizares, C. R. 2002, ApJ, 572, L127
- Fang, Sembach & Canizares (2003) Fang, T. , Sembach, K. R. & Canizares, C. R., 2003, ApJL in press astro-ph/0210666
- Fukugita, Hogan, & Peebles (1998) Fukugita, M., Hogan, C. J., & Peebles, P. J. E. 1998, ApJ, 503, 518
- Kashyap & Drake (2000) Kashyap, V. & Drake, J. J., 2000, Bull. Astron. Soc. India, 28, 475
- Heckman et al. (2002) Heckman, T. M. , Norman, C. A., Strickland, D. K. and Sembach, K. R., 2002, ApJ in press (astro-ph/0205556)
- Hellsten, Gnedin, & Miralda-Escudé (1998) Hellsten, U., Gnedin, N. Y., & Miralda-Escudé, J. 1998, ApJ, 509, 56
- Lockman & Savage (1995) Lockman, F. J. & Savage, B. D. 1995, ApJS, 97, 1
- Ma et al. (1998) Ma, C. et al. 1998, AJ, 116, 516
- Mathur, Weimberg & Chen (2002) Mathur, S., Weimberg, D. H. & Chen, X., 2002, proceedings of the conference ”IGM/Galaxy Connection- The Distribution of Baryons at z=0”, astro-ph/0210575
- Morrison & McCammon (1983) Morrison, R. & McCammon, D. 1983, ApJ, 270, 119
- Nicastro et al. (2001) Nicastro, F. et al. 2001, (astro-ph/0102455)
- Nicastro et al. (2002) Nicastro, F. et al. 2002, ApJ, 573, 157
- Nicastro, private comm (2002) Nicastro, F., 2002, private communication
- Penton, Stocke, & Shull (2000) Penton, S. V., Stocke, J. T., & Shull, J. M. 2000, ApJS, 130, 121
- Rumph, Bowyer, & Vennes (1994) Rumph, T., Bowyer, S., & Vennes, S. 1994, AJ, 107, 2108
- Sembach et al. (2000) Sembach, K. R. et al. 2000, ApJ, 538, L31
- Sembay et al. (2002) Sembay, S., Edelson, R., Markowitz, A., Griffiths, R. G., & Turner, M. J. L. 2002, ApJ, 574, 634
- Shull, Stocke, & Penton (1996) Shull, J. M., Stocke, J. T., & Penton, S. 1996, AJ, 111, 72
- Tripp et al. (2001) Tripp, T. M., Giroux, M. L., Stocke, J. T., Tumlinson, J., & Oegerle, W. R. 2001, ApJ, 563, 724
| Obs. Id. | Obs. Start timeaaYY-MM-DD | Total ExposurebbTotal RGS-1 (RGS-2) on time in ks. | Net ExposureccFor RGS-1 in ks after the high particle background times rejection. RGS-2 net exposure times are similar. | Offset | Used observartion?ddFor details see footnote 2 in the text. |
|---|---|---|---|---|---|
| 0099280201 | 00-11-01 | 40 | 34 | 6.3 | YES |
| 0099280301 | 00-11-13 | 50 | 40 | 5.87 | YES |
| 0099280401 | 00-11-14 | 43 | 27 | 116.69 | NO |
| 0099280501 | 00-11-13 | 21 | 15 | 7.63 | YES |
| 0099280601 | 00-11-15 | 20 | 12 | 117.4 | NO |
| 0136540101 | 01-05-08 | 39 | 36 | 12.95 | YES |
| 0136540201 | 01-05-08 | 10 | 0 | 13.16 | NO |
| 0153950601 | 02-05-04 | 40 | 39 | 123.98 | NO |
| 0153950701 | 02-05-05 | 20 | 18 | 169.43 | NO |
| 0153950801 | 02-05-05 | 22 | 21 | 177.49 | NO |
| Line ID | FWHM | EWaaThe values in parenthesis are obtained fixing the FWHM of the line to the value of the zero redshift Ovii K | |||
|---|---|---|---|---|---|
| (Å) | (km s-1) | ( Å) | (mÅ) | ||
| NeixbbThese lines could possibly be enhanced or modified by the presence of small effective area features (see the bottom panels in Fig. 2 and Fig. 3) | () | 2.5 | |||
| Ovii K | () | 3.8 | |||
| Oviii LybbThese lines could possibly be enhanced or modified by the presence of small effective area features (see the bottom panels in Fig. 2 and Fig. 3) | () | 4.8 | |||
| Ovii K | 7.6 | ||||
| Ovii K | 2.8 |