Determination of Primordial Metallicity and Mixing in the Type IIP Supernova 1993W111Partially based on observations performed at ESO La Silla
Abstract
We present the results of a large grid of synthetic spectra and compare them to early spectroscopic observations of SN 1993W. This supernova was discovered close to its explosion date and at a recession velocity of 5400 km s-1 is located in the Hubble flow. We focus here on two early spectra that were obtained approximately 5 and 9 days after explosion. We parameterize the outer supernova envelope as a power-law density profile in homologous expansion. In order to extract information on the value of the parameters a large number of models was required. We show that very early spectra combined with detailed models can provide constraints on the value of the power law index, the ratio of hydrogen to helium in the surface of the progenitor, the progenitor metallicity and the amount of radioactive nickel mixed into the outer envelope of the supernova. The spectral fits reproduce the observed spectra exceedingly well. The spectral results combined with the early photometry predict that the explosion date was days before the first spectrum was obtained. The ability to obtain the metallicity from early spectra make SN IIP attractive probes of chemical evolution in the universe and by showing that we have the ability to pin down the parameters of the progenitor and mixing during the supernova explosion, it is likely to make SN IIP useful cosmological distance indicators which are at the same time complementary to SNe Ia.
1 Introduction
Supernova 1987A (SN 1987A) confirmed our basic theoretical understanding of a Type II supernova (SN II) as the core collapse of a massive star, which leaves behind a compact object (neutron star or black hole) and expels the outer mantle and envelope into the interstellar medium (see Arnett et al., 1989, and references therein). While the explosion mechanism itself remains a subject of active research, the propagation of the shock wave through the mantle and envelope is reasonably well understood. Theoretical models for the light curve do a good job of reproducing the observations (Blinnikov, 1999; Blinnikov et al., 2000) and detailed radiation transport calculations verify that these models reproduce the observed spectra from the UV to the IR (Mitchell et al., 2001, 2002). Unlike Type Ia supernovae (SNe Ia) where the actual compositions as a function of velocity are an important subject of current research (Fisher et al., 1999), the compositions of the envelopes of red or blue supergiant stars is primarily hydrogen and helium and thus we show that the primordial compositions, and the degree of mixing of hydrogen and 56Ni, can be determined to high precision by the detailed spectral modeling of observed SN II spectra.
SNe II have a very large spread in their intrinsic brightness, from the very dim SN 1987A, to the exceedingly bright SNe 1979C and 1997cy. The observed spread in intrinsic luminosity is greater than a factor of 500. This is not surprising given the fact that the progenitors span a wide range of initial stellar masses, possible binary membership, and prior star formation histories. Clearly, SNe II do not meet the astronomers requirement of being a standard candle, however we believe that the fact that our models can determine the stellar compositions, degree of mixing, and kinetic energy of the explosion shows that their atmospheres can be well understood. Although we do not present distances in this paper, we believe that these results increase the attractiveness of SNe II as cosmological probes and in the future SNe II will become complementary with SNe Ia as distance indicators. Both the SEAM (see Baron et al., 1995b, 1996; Mitchell et al., 2002, and references therein) and the EPM (see Baade, 1926; Schmidt et al., 1994; Hamuy et al., 2001; Leonard et al., 2002) methods for determining distances to SNe II (and other supernova types for SEAM) depend on the ability to model the spectral energy distribution (SED) of the supernova atmosphere accurately. Clearly, quantities like the composition and degree of mixing play a role in the output SED and thus the work presented here helps to place both these methods on firmer footing.
While the average SN II is several times dimmer than a SN Ia, current ground-based searches and proposed future space-based searches for supernovae will easily detect these objects at cosmologically interesting distances. In the very deep high-redshift supernova searches by the Hi-Z Team (Riess et al., 1998) and the Supernova Cosmology Project (SCP) (Perlmutter et al., 1999) several SNe II have been discovered even though the searches are geared to finding SNe Ia. The SCP has positively identified via spectroscopy 5 SNe II out to a redshift . Gilliland et al. (1999) detected SN 1997fg through differencing two epochs of Hubble Deep Field North -band photometric images. While the supernova was not spectroscopically classified, the combination of the host galaxy type (an irregular), its redshift , and the supernova’s apparent brightness makes it a strong candidate for a SN II. A. Clocchiatti et al. (IAUC 7549) found SN 2000fp at , G. Altavilla et al. (IAUC 7762) found SN 2001gg at , SN 2001gh at , and SN 2001gj at , and G. Altavilla et al. found SN 2002co at . The proposed SNAP satellite, a wide-field optical imaging telescope, (see http://snap.lbl.gov) will easily be able to find, follow, and spectroscopically identify SNe II beyond redshifts of . NGST, a large, small field IR telescope, will be able to detect SNe II to the initial star formation period in the universe, .
The explosion mechanism is now thought to result in a non-spherically symmetric shock-wave (LeBlanc & Wilson, 1970; Khokhlov et al., 1999) and this has been confirmed by the detection of significant polarization in the spectra of SNe II (Wang et al., 1996; Leonard et al., 2000). Nevertheless, the large expansion of the ejecta before the supernova becomes visible leads to significant “sphericalization” (Chevalier, 1984), and asphericity effects may only be important at late times, or in SNe II that are strong circumstellar interacters (SNe IIn). These supernovae are clearly distinguishable observationally from “normal” Type II supernovae.
Calculations (Miralda-Escudé & Rees, 1997; Dahlén & Fransson, 1999; Yungelson & Livio, 2000) indicate that SNe II may in fact be the first stellar objects visible in the universe and hence they serve as important probes for the star formation rate, the rate of chemical evolution by measuring their primordial abundances, and directly for the cosmological parameters. We show that the primordial abundances of the progenitor star can be reliably determined by detailed synthetic spectral modeling.
2 Calculations
We have chosen to model SN 1993W in detail because there are several high signal to noise spectra very near the time of explosion as well as at later times and because we found that this object is clearly a low metallicity supernova although both the photometry (see Table 1) proves that it is indeed an SN IIP, closely resembling the light curve of SN 1969L and SN 1988A.
The calculations were performed using the multi-purpose stellar atmospheres program PHOENIX version 11.7 (Hauschildt & Baron, 1999; Baron & Hauschildt, 1998; Hauschildt et al., 1997a, b, 1996). PHOENIX solves the radiative transfer equation along characteristic rays in spherical symmetry including all special relativistic effects. The non-LTE (NLTE) rate equations for many ionization states are solved including the effects of ionization due to non-thermal electrons from the -rays produced by the radiative decay of 56Ni, which is produced in the supernova explosion. The atoms and ions calculated in NLTE are: H I, He I–II, C I-III, N I-III, O I-III Na I-III, Mg II, Ca II, Si I–III, S I–III, Fe I–III, Ni I-III, and Co I-III. These are all the elements whose features make important contributions to the observed spectral features in SNe II.
Each model atom includes primary NLTE transitions, which are used to calculate the level populations and opacity, and weaker secondary LTE transitions which are are included in the opacity and implicitly affect the rate equations via their effect on the solution to the transport equation (Hauschildt & Baron, 1999). In addition to the NLTE transitions, all other LTE line opacities for atomic species not treated in NLTE are treated with the equivalent two-level atom source function, using a thermalization parameter, . The atmospheres are iterated to energy balance in the co-moving frame; while we neglect the explicit effects of time dependence in the radiation transport equation, we do implicitly include these effects, via explicitly including the rate of gamma-ray deposition in the generalized equation of radiative equilibrium and in the rate equations for the NLTE populations.
The models are parameterized by the time since explosion and the velocity where the continuum optical depth in extinction at 5000 Å () is unity, which along with the density profile determines the radii. This follows since the explosion becomes homologous () quickly after the shock wave traverses the entire star. The density profile is taken to be a power-law in radius:
where typically is in the range . Since we are only modeling the outer atmosphere of the supernova, this simple parameterization agrees well with detailed simulations of the light curve (Blinnikov et al., 2000) for the relatively small regions of the ejecta that our models probe.
Further fitting parameters are the model temperature , which is a convenient way of parameterizing the total luminosity in the observer’s frame. We treat the -ray deposition in a simple parameterized way, which allows us to include the effects of nickel mixing which is seen in nearly all SNe II. Detailed fitting of a time series of the observed spectra determines all the parameters, i.e., , , the amount of nickel mixing, the amount of helium mixing, and the metallicity.
3 Results
SN 1993W was discovered on Aug. 19, 1993 by C. Pollas (IAUC 5848). Spectroscopy was obtained on Aug. 20 and Aug. 24 at ESO; and on Sept. 10, Sept. 11, Oct. 22, and Nov. 8 at Lick Observatory.
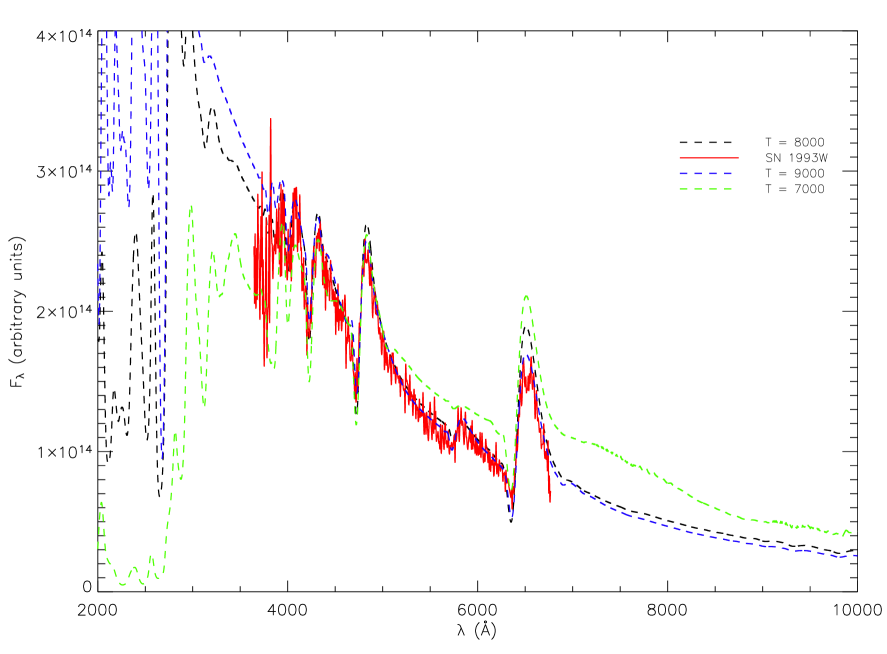
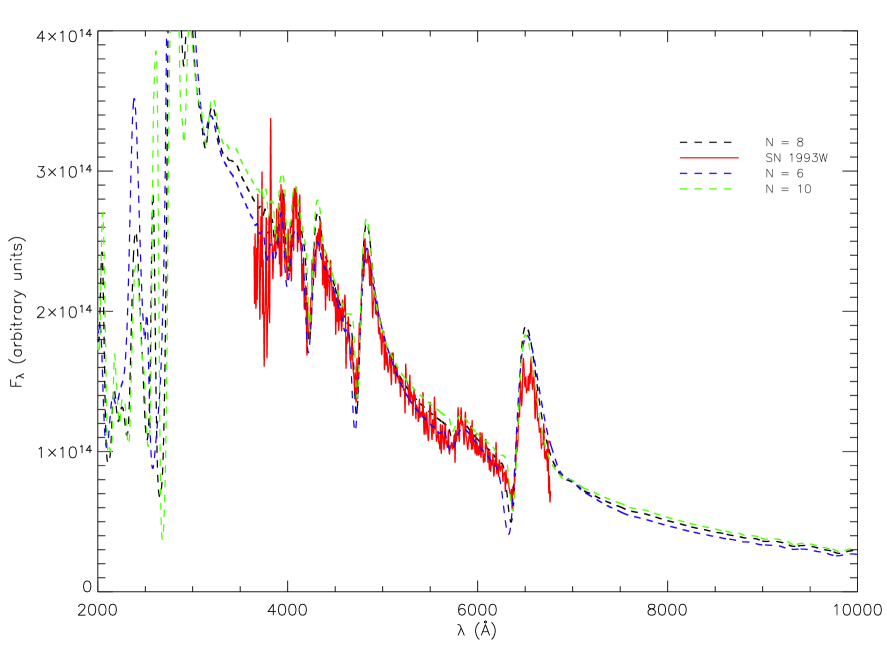
Figures 1 and 2 display the observed and best fit synthetic spectra for the two early epochs that we will study here. The observed spectra were de-redshifted by 5400 km s-1 and de-reddened using the reddening law of Cardelli et al. (1989) with , i.e., accounting for galactic foreground extinction. There is no evidence of interstellar reddening in the parent galaxy since no narrow Na ID lines are visible in the observed spectra. Table 2 displays the model parameters used for each date. The fit quality is superb, no line deviates from the observed feature by more than 5% in the Aug 20 spectrum and the deviation is below 50% (except in Ca II which we discuss below) in the Aug 24 spectrum, which is excellent. Table 3 displays the synthetic colors for the best fit models and Table 4 lists the observed values. For Aug. 24, the synthetic , agrees with the observed colors to within 0.04 mag which is within the observational uncertainties. The colors differ somewhat more, but photometry is often uncertain and when the Ca H+K line is well fit the synthetic value of (see Figure 16). Clearly, our ability to fit observed spectra in such detail gives us confidence in the physical parameters that we can extract from our models. Figure 3 displays the Balmer lines as a function of velocity for Aug 20, 1993 and Figure 4 displays both the Balmer lines and the weak Fe II 5169 line which is often used in the expanding photosphere method (Schmidt et al., 1992; Eastman et al., 1996; Schmidt et al., 1992; Hamuy et al., 2001; Leonard et al., 2002). This result shows that the Spectral-fitting Expanding Atmosphere method (SEAM, Baron et al., 1993, 1994, 1995a, 1995b, 1996; Mitchell et al., 2002) fits not only the weak lines such as Fe II 5169 but also the prominent SNe II Balmer lines. The velocities determined by detailed spectral analysis are extremely accurate (close to the instrumental resolution) and indicates that early spectra are quite important for SEAM analyses.
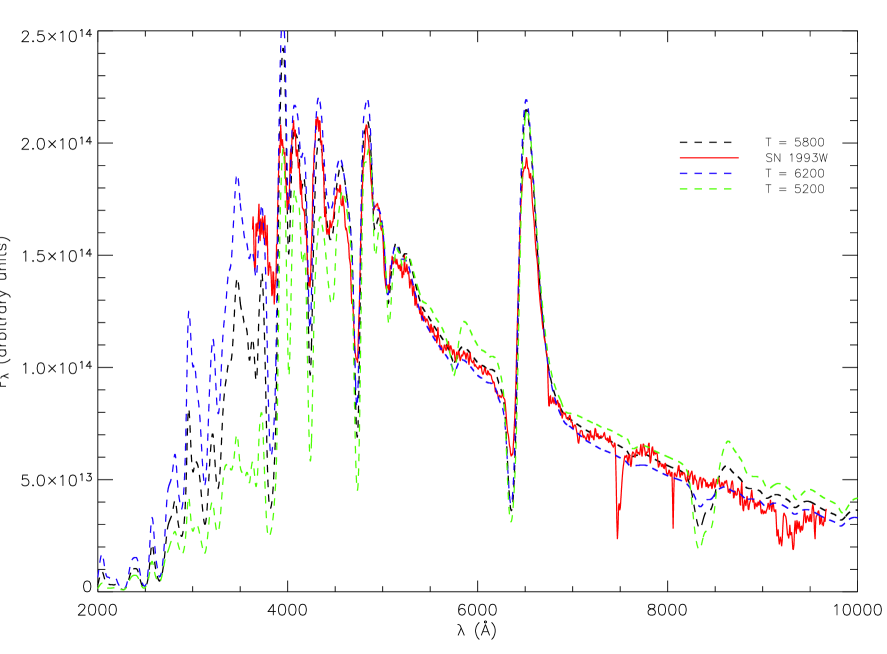
Besides velocity, the other important fitting parameter is the total observed bolometric luminosity which provides the outer boundary condition for the requirment of global energy conservation. It is convenient to parameterize the luminosity in terms of the model temperature . Figures 5 and 6 show the effect of varying the the model temperature on the standard reference models. From Figure 5 it is clear that the 7000 K model is too cool, producing both too little flux in the blue and far too much in the red. The 9000 K model produces too much flux in the blue, but with the spectral coverage of the observation, it is difficult to distinguish it in the red from our standard 8000 K model (see Fig. 1). Thus we can obtain the model temperature at this single epoch to K. With larger spectral coverage we should be able to determine the model temperature to K. Fig. 6 shows that on Aug 24, the cool model produces poorer fits to the Balmer lines, produces a very strong Ca II IR triplet (which also depends somewhat on the metallicity, discussed below) and also does less well at reproducing the Ca II H+K line. The hotter model also does a poorer job of reproducing the Balmer lines, and although the Ca II IR triplet is weaker, as needed by the observations, the Ca II H+K line is still far too strong.
3.1 Aug 20
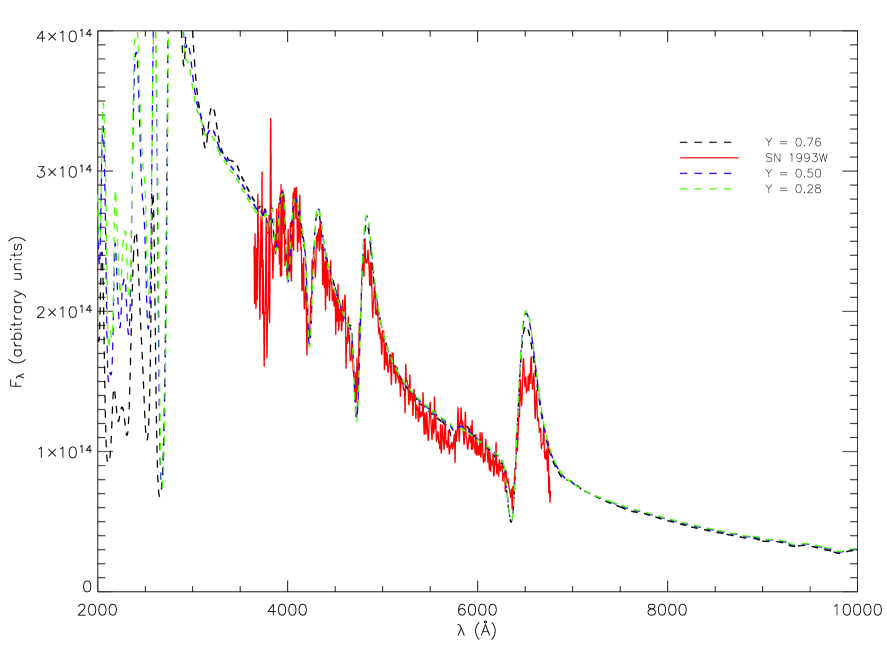
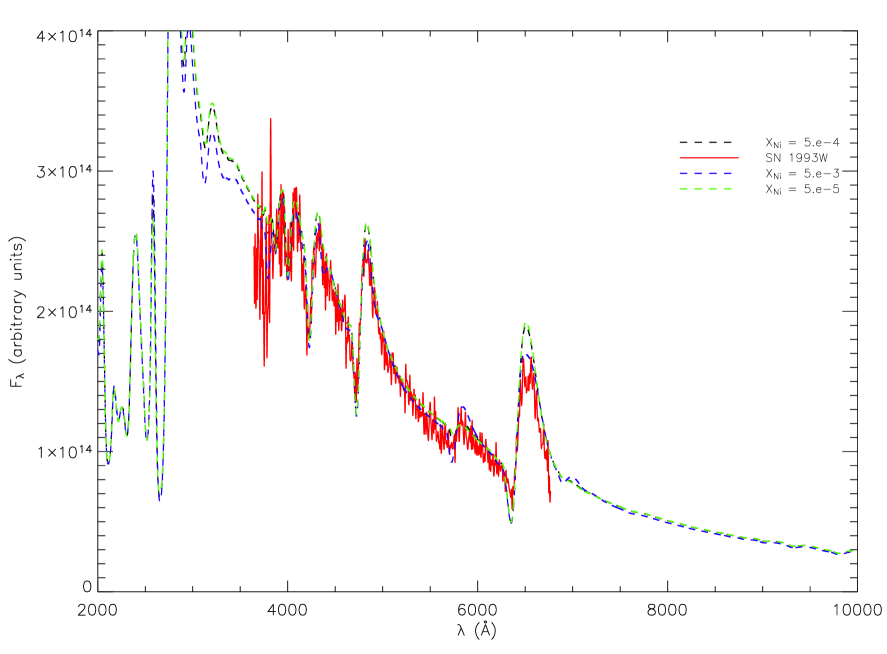
Because the Aug 20 spectrum is so hot and so early, it contains (in the optical) only lines of hydrogen and helium. Thus we may use this spectrum to determine the amount of hydrogen and helium mixing, although we must simultaneously determine the amount of non-thermal excitation due to the radioactive decay of 56Ni. We have calculated a very large number of models () and we find that no reasonable value of -ray deposition can produce the observed He I line without enhancing the helium abundance over the solar value. We find that in order to fit this feature there must significant mixing of hydrogen and helium in the outer envelope and the helium must also be excited by non-thermal -ray deposition which comes from the radioactive decay of 56Ni. A similar result was found for SN 1987A (Arnett et al., 1989; Eastman & Kirshner, 1989; Lundqvist & Fransson, 1996; Blinnikov et al., 2000; Mitchell et al., 2001, 2002) and for SN 1999em (Baron et al., 2000). Figures Figure 7 and 8 show the effects of varying the helium mass fraction. Figure 8 shows that with a fixed amount of -ray deposition, solar abundances of helium do not produce a strong enough He I feature. Figures 9 and 10 show the effect of varying the -ray deposition, with a constant . Even with enhanced helium abundances in the outer layers, the He I feature does not appear with no non-thermal ionization, therefore mixing of nickel (in order to produce -rays to excite the helium) into the outer layers is required. The mixing of nickel, hydrogen, and helium in SNe II is not well understood and the situation is unlikely to improve until the explosion mechanism is better understood. Therefore we use a very simple prescription for -ray deposition, the -rays are deposited locally by a constant mass fraction of nickel — the deposition function follows the density profile. We have used this prescription successfully in modeling other SNe II (Lentz et al., 2001; Mitchell et al., 2001, 2002). Both enhanced surface helium and the excitation of the helium by -ray deposition appear to be a common feature of SNe IIP and support the notion that fluid instabilities or MHD jets are intimately involved in the explosion mechanism in order to produce large amounts of mixing.
Finally, Figure 11 displays the effects of varying the density profile . The Balmer profiles are too narrow in the case and the model does nearly as well as our standard case. There is some degeneracy between the value of and the velocity, since the narrow lines in the case could be made broader by increasing the velocity of the ejecta, however in our large grid of models we found that lower values of are favored, largely due to the fact that changing and increasing the velocity alters the slope of the P-Cygni feature as it rises from the bottom of the absorption trough to the emission peak.
3.2 Aug 24
Figure 2 shows that the Fe II line has now appeared in the observed spectrum and a weak feature is also visible that is likely due to Fe II . However, there is not significant line blanketing in the blue even though the model temperature has dropped to the hydrogen recombination temperature (see Fig. 12). Figure 12 shows the effect of varying the model metallicity with gamma-ray deposition turned off. The results are expected, higher metallicity leads to large absorption due to iron line blanketing in the region 4000–4500 Å. In fact even at very low metallicity the line blanketing is much larger than observed, gamma-ray deposition significantly reduces the line blanketing as shown in Figure 13. In fact, the comparison of the two figures strengthen the need for significant gamma-ray deposition at early times. While Fig. 13 clearly shows that there is more line blanketing as the metallicity increases, it also shows that metallicity and -ray deposition radically alter the flux in the blue part of the spectrum.
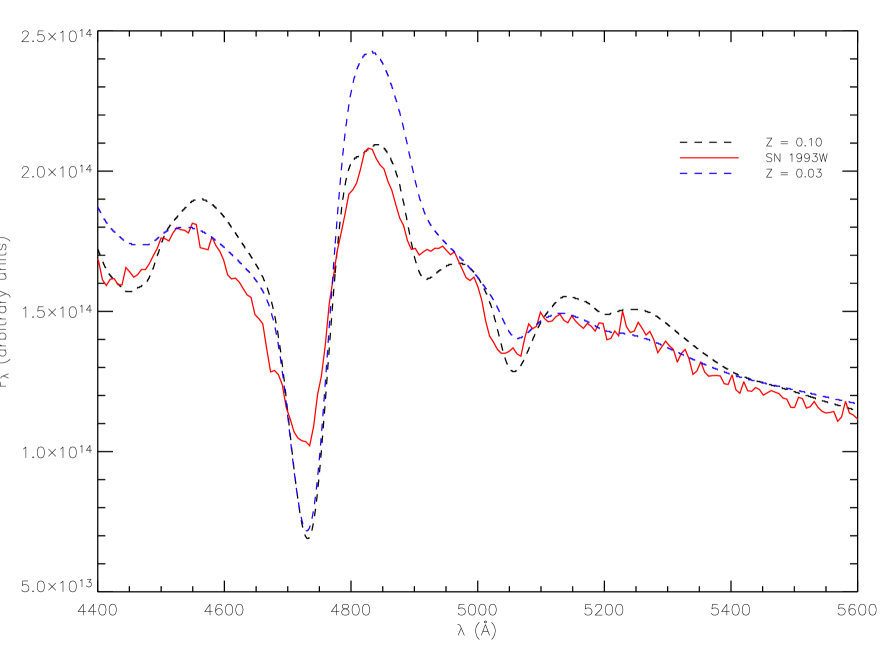
Figure 14 shows that even at very low metallicity, the early spectra are also quite sensitive to the primordial metallicity, when gamma-ray deposition is included. The higher metallicity is favored to fit the two Fe II features in the blue (see Fig. 15), but the Ca II IR triplet is too strong with , and is even a bit too strong for . The Ca II H+K feature is too strong in both cases and is likely affected by the choice of gamma-ray deposition as can be seen from Figure 12. Since we have not tried to alter individual abundances, but only scaled total overall metallicity our preferred value for metallicity is set by the iron features in the blue. Clearly the progenitor star for SN 1993W had a significantly lower metallicity than the sun.
Fig. 16 shows a model with the same parameters as Figure 2, but with the Ca abundance reduced by a factor of 10. Now both the H+K and IR triplet lines are reasonably well reproduced in the synthetic spectrum; however since we have held everything else fixed the Balmer lines are not as well fit as they are in Figure 2. It is interesting to note that nucleosynthetic models for Type Ia and Type II supernovae from low mass progentitors produce Fe/Ca ratios that are about a factor of four higher than that produced by more massive SNe II (Tsujimoto et al., 1995). It is possible that the progenitor of SN 1993W just happened to occur in a region that was recently enriched by the explosion of a Type Ia supernova, resulting in enhanced Fe/Ca. Although low S/Fe and Si/Fe would also be expected in this scenario these are not ruled out by the spectra presented here. Si and S abundances can best be determined in later (nebular) spectra of SNe IIP. Since calcium lines are so strongly dependent on the temperature, small changes in the non-thermal ionization could possibly produce the suppression in the calcium strengths that we obtain here. A detailed study of a full time series of a similar SN IIP would thus be illustrative and we intend to carry out such a program in future work.
We find that , and we strongly prefer a value of (particularly if Fe/Ca is enhanced). The metallicity likely could be even better pinned down with UV observations that can be obtained by HST and by SNAP. By studying the progenitors of SNe II, Smartt et al. (2002), found that metallicities near solar with on SN 1987A and SN 1980K having metallicities of about . Thus the value of for SN 1993W is interestingly low. Therefore early observations of SNe II are crucial if we wish to use these objects as probes of galactic chemical evolution.
4 Explosion Time
We can use simple arguments to obtain a limit on the explosion time. The total bolometric luminosity of the supernova is approximately
where is the velocity of the photosphere. The ratio of the luminosities between time (Aug 20) and time is
where we have used the fact that days. From our synthetic spectra we can determine that the bolometric correction was on Aug 20, and on Aug 24. The magnitude is estimated to be 18.3 on both days (see Tab. 1) and using the color from Table 3 we find that the ratio of to is 1.17. Plugging in our values for the velocities and temperatures we find that Aug 20 is days after the explosion. The largest contributor to the uncertainty in the explosion time is the error in the observed photometry.
5 Conclusions
We have shown that synthetic spectra of SNe IIP can be fit to high accuracy, and that the primordial metallicity, degree of mixing of H and He, as well as the amount of mixing of 56Ni can also be determined by early spectra. Baron et al. (2000) showed that the total amount of extinction due to dust either in the parent galaxy or in our own galaxy can also be estimated with UV+optical spectra at very early times. While the reduced calcium abundance that was needed to reduce the strength of the calcium lines is intriguing, we do not as yet believe that our results require a reduced value of Ca/Fe. In a future paper we will explore a grid of models and determine a distance to SN 1993W, along with an estimate of the systematic error. We have shown that primordial metallicity, H/He mixing, and 56Nimixing are derivable from the detailed analysis of early spectra of SNe IIP. The analysis of abundances of individual elements is in reach, but will require a larger grid of models intercompared with a set of well studied SNe IIP. The data for this will be obtained as part of searches for nearby SNe Ia and will just require followup spectrophotometry. We believe that we have demonstrated that SNe IIP atmospheres can be well understood theoretically and hence are likely to make excellent independent cosmological probes, both as distance indicators and as probes of cosmic nucleosynthesis.
References
- Arnett et al. (1989) Arnett, W. D., Bahcall, J., Kirshner, R. P., & Woosley, S. E. 1989, Ann. Rev. Astr. Ap., 27, 629
- Baade (1926) Baade, W. 1926, Astr. Nach., 228, 359
- Baron & Hauschildt (1998) Baron, E. & Hauschildt, P. H. 1998, ApJ, 495, 370
- Baron et al. (1994) Baron, E., Hauschildt, P. H., & Branch, D. 1994, ApJ, 426, 334
- Baron et al. (1995a) Baron, E., Hauschildt, P. H., Branch, D., Austin, S., Garnavich, P., Ann, H. B., Wagner, R. M., Filippenko, A. V., Matheson, T., & Liebert, J. 1995a, ApJ, 441, 170
- Baron et al. (1996) Baron, E., Hauschildt, P. H., Branch, D., Kirshner, R. P., & Filippenko, A. V. 1996, MNRAS, 279, 799
- Baron et al. (1993) Baron, E., Hauschildt, P. H., Branch, D., Wagner, R. M., Austin, S. J., Filippenko, A. V., & Matheson, T. 1993, ApJ, 416, L21
- Baron et al. (1995b) Baron, E., Hauschildt, P. H., & Young, T. R. 1995b, Physics Reports, 256, 23
- Baron et al. (2000) Baron, E. et al. 2000, ApJ, 545, 444
- Blinnikov (1999) Blinnikov, S. 1999, Astronomy Letters, 25, 359
- Blinnikov et al. (2000) Blinnikov, S., Lundqvist, P., Bartunov, O., Nomoto, K., & Iwamoto, K. 2000, ApJ, 532, 1132
- Cardelli et al. (1989) Cardelli, J. A., Clayton, G. C., & Mathis, J. S. 1989, ApJ, 345, 245
- Chevalier (1984) Chevalier, R. A. 1984, Ann. NY Acad. Sci., 422, 215
- Dahlén & Fransson (1999) Dahlén, T. & Fransson, C. 1999, A&A, 350, 349
- Eastman & Kirshner (1989) Eastman, R. & Kirshner, R. P. 1989, ApJ, 347, 771
- Eastman et al. (1996) Eastman, R., Schmidt, B. P., & Kirshner, R. 1996, ApJ, 466, 911
- Fisher et al. (1999) Fisher, A., Branch, D., Hatano, K., & Baron, E. 1999, MNRAS, 304, 67
- Gilliland et al. (1999) Gilliland, R. L., Nugent, P. E., & Phillips, M. M. 1999, ApJ, 521, 30
- Hamuy et al. (2001) Hamuy, M. et al. 2001, ApJ, 558, 615
- Hauschildt & Baron (1999) Hauschildt, P. H. & Baron, E. 1999, J. Comp. Applied Math., 109, 41
- Hauschildt et al. (1997a) Hauschildt, P. H., Baron, E., & Allard, F. 1997a, ApJ, 483, 390
- Hauschildt et al. (1996) Hauschildt, P. H., Baron, E., Starrfield, S., & Allard, F. 1996, ApJ, 462, 386
- Hauschildt et al. (1997b) Hauschildt, P. H., Schwarz, G., Baron, E., Starrfield, S., Shore, S., & Allard, F. 1997b, ApJ, 490, 803
- Khokhlov et al. (1999) Khokhlov, A. M., Höflich, P. A., Oran, E. S., Wheeler, J. C., Wang, L., & Chtchelkanova, A. Y. 1999, ApJ, 524, L107
- LeBlanc & Wilson (1970) LeBlanc, J. & Wilson, J. R. 1970, ApJ, 161, 541
- Lentz et al. (2001) Lentz, E. et al. 2001, ApJ, 547, 406
- Leonard et al. (2000) Leonard, D., Filippenko, A. V., Barth, A., & Matheson, T. 2000, in Cosmic Explosions! Proc. of the 10th Maryland Conference on Astrophysics, ed. V. Trimble (New York: American Inst. of Physics)
- Leonard et al. (2002) Leonard, D. C. et al. 2002, PASP, 114, 35
- Lundqvist & Fransson (1996) Lundqvist, P. & Fransson, C. 1996, ApJ, 464, 924
- Miralda-Escudé & Rees (1997) Miralda-Escudé, J. & Rees, M. J. 1997, ApJ, 478, L57
- Mitchell et al. (2002) Mitchell, R., Baron, E., Branch, D., Hauschildt, P. H., Nugent, P., Lundqvist, P., Blinnikov, S., & Pun, C. S. J. 2002, ApJ, 574, 293
- Mitchell et al. (2001) Mitchell, R., Baron, E., Branch, D., Lundqvist, P., Blinnikov, S., Hauschildt, P. H., & Pun, C. S. J. 2001, ApJ, 556, 979
- Perlmutter et al. (1999) Perlmutter, S. et al. 1999, ApJ, 517, 565
- Riess et al. (1998) Riess, A. et al. 1998, AJ, 116, 1009
- Schmidt et al. (1992) Schmidt, B. P., Kirshner, R., & Eastman, R. 1992, ApJ, 395, 366
- Schmidt et al. (1994) Schmidt, B. P. et al. 1994, ApJ, 432, 42
- Smartt et al. (2002) Smartt, S. J., Gilmore, G. F., Tout, C. A., & Hodgkin, S. T. 2002, ApJ, 565, 1089
- Tsujimoto et al. (1995) Tsujimoto, T., Nomoto, K., Yoshii, Y., Yanagida, S., Hashimoto, M., & Thielemann, F.-K. 1995, MNRAS, 277, 945
- Wang et al. (1996) Wang, L., Wheeler, J. C., Li, Z., & Clocchiatti, A. 1996, ApJ, 467, 435
- Yungelson & Livio (2000) Yungelson, L. R. & Livio, M. 2000, ApJ, 528, 108
| Date | ||||
|---|---|---|---|---|
| Aug 24 | 18.58 | 18.32 | 18.05 | |
| Sep 09 | 19.15 | 18.25 | 17.95 |
| Date | / | ||||
|---|---|---|---|---|---|
| Aug. 20 | 9356 | 8 | 9356 | 0.10 | 0.76 |
| Aug. 24 | 6897 | 8 | 6689 | 0.10 | 0.76 |
Note. — Model parameters for our best fit models shown in Figures 1–2. Date, refers to the date of observation, is the velocity (in km s-1) at the reference optical depth ( total extinction optical depth in the continuum at 5000 Å), is the exponent of the density power-law, characterizes the total luminosity of the model, is the metallicity in units of the solar metallicity, is the fraction by mass that is helium.
| Date | ||||
|---|---|---|---|---|
| Aug20 | -0.70 | 0.03 | 0.22 | 0.00 |
| Aug24 | 0.03 | 0.30 | 0.27 | 0.08 |
| Date | ||
|---|---|---|
| Aug24 | 0.26 | 0.26 |