A 1.2 mm MAMBO/IRAM-30m Study of Dust Emission from optically luminous Quasars
We report 250 GHz (1.2 mm) observations of redshift optically luminous (), radio quiet quasars using the Max-Planck Millimeter Bolometer (MAMBO) array at the IRAM 30-metre telescope. Nine quasars were detected and for 26 quasars 3 flux density limits in the range 1.8 to 4 mJy were obtained. Adopting a typical dust temperature of 45 K, the millimeter emission implies far-infrared luminosities of order and dust masses of . Applying a statistical survival analysis to our total sample of 43 detected and 95 undetected quasars at and , we find that there is no apparent difference in the far-infrared (FIR) luminosities, hence the star formation rates, of QSOs at and at . This differs from radio galaxies, for which the FIR luminosity was found to increase with redshift (Archibald et al. 2001). We furthermore find that there is no strong correlation between the far-infrared and optical luminosities, confirming previous results obtained on smaller samples.
Key Words.:
Galaxies: formation – Galaxies: starburst – Galaxies: high-redshift – Quasars: general – Cosmology: observations – Submillimeter1 Introduction
The relation between the growth of the central black hole and the formation of the bulge stars is a key issue for the formation and evolution of galaxies. Probing starburst activity in the host galaxies of high redshift quasars has therefore become a key area of observational cosmology. Since the formation of massive stars often occurs in heavily obscured regions, star formation is best traced through the far-infrared (FIR) dust emission (e.g., Sanders & Mirabel 1996), the peak of which is red-shifted into the (sub)millimeter atmospheric windows for sources at redshifts . Deep (sub)millimeter blank field surveys using SCUBA (e.g., Scott et al. 2002) and MAMBO (Bertoldi et al. 2000a,b) have now detected over one hundred sources. For most of these objects optical obscuration prevents a spectroscopic redshift determination and any detailed study of the relation between star formation and Active Galactic Nuclei (AGN). Therefore, such studies must currently rely on pointed (sub)millimeter observations of radio galaxies and of optically selected quasars.
Observations at 1.2 mm and 0.85 mm using MAMBO and SCUBA, respectively, have lead to the detection of more than 60 high-redshift quasars (Omont et al. 1996 and references therein for earlier work; Omont et al. 2001; Carilli et al. 2001a; Isaak et al. 2002; and present paper; Priddey et al. 2002), radio galaxies (Archibald et al. 2001), and X-ray selected AGN (Barger et al. 2001; Page et al. 2001). Whether most of the dust FIR emission is due to heating by the UV/X radiation of the AGN or by massive stars remains unclear. Only for a few cases there are searches for CO line emission deep enough for achieving detection and providing good evidence that a substantial fraction of the FIR emission must be caused by star formation (Guilloteau et al. 1999; Cox et al. 2002a,b; Carilli et al. 2002).
Up to now most of the studies of the (sub)millimeter emission from high redhift QSOs have focused on sources at redshifts , for which 40 detections were reported (Omont et al. 1996, Omont et al. 2001, Carilli et al. 2001a, Isaak et al. 2002, and references therein). In order to study the quasar population at the peak of their space density, which is at a later epoch than that probed in previous studies, we extended the millimeter observations of optically luminous quasars to . This paper reports on 1.2 mm continuum observations of a sample of redshift 1.8 to 2.8 QSOs with optical luminosities in excess of ().
We adopt a -cosmology with , and . However, for the definition of the rest-frame absolute B-band magnitudes, , we have used the standard Einstein-de Sitter cosmology with Mpc-1 and =0.5, in order to ease the comparisons with standard quasar catalogues and luminosity functions. Throughout this paper, the far-infrared luminosity () is defined as the luminosity of a modified black-body with a dust temperature and emissivity index as given in Sect. 3.1.
2 Source Selection and Observations
Thirty-five optically luminous () radio-quiet QSOs at redshifts were observed from 60 sources we had selected from the catalogue of Véron-Cetty & Véron (2000). As the result of our random selection among the sources listed by Véron-Cetty & Véron, the observed sources derive from a broad variety of QSO surveys. However, about half of them were originally identified in the Hamburg Quasar Survey (Engels et al. 1998; Hagen; Engels & Reimers 1999, http://www.hs.uni-hamburg.de). The observed sources have a distribution in rest-frame absolute B-band magnitudes, , between and , which is comparable to the distribution of PSS quasars studied by Omont et al. (2001) – see Sect. 3.1. For the present sample at z 2, the values of were determined including J and H magnitudes obtained from the 2MASS near-infrared survey - see Priddey et al. (2002). However, the values are more uncertain for the 4 sample because 2MASS data are lacking for most sources. The selected QSOs are at high declination ( and mostly ) to favor observations done at low air mass. The list of the observed sources is given in Tables 1 and 2.
The observations were made during the winter of 2000-2001 using the 37-channel Max-Planck Millimeter Bolometer (MAMBO; Kreysa et al. 1999a, 1999b) array at the 30-meter IRAM telescope on Pico Veleta (Spain). The sources were observed with the array’s central channel, using the standard on-off mode with the telescope secondary chopping in azimuth by 50′′ at a rate of 2 Hz. The target was positioned on the central bolometer of the array, and after 10 seconds of integration, the telescope was nodded so that the previous off beam became the on beam. A typical scan lasts for 12 or 16 such 10 seconds sub-scans. The pointing was checked frequently on nearby continuum sources, and was found to be stable within . The sky opacity was measured regularly, with zenith opacities at 1.2 mm varying between 0.08 and 0.4. Gain calibration was performed using observations of Mars. We adopted a calibration factor of 12500 counts per Jansky, which we estimate to be reliable to within 20%. The point-source sensitivity of MAMBO during the observations was .
The data were analyzed using the MOPSI software (Zylka 1998). Correlated sky-noise was subtracted from each channel; it was computed for each channel as a weighted mean of the signals from the eight best-correlating surrounding channels. Skynoise subtraction reduces the noise in the signals by typical factors of 2 to 3. For each quasar, the total on-target plus off-target observing time was always greater than 650 sec. The mean r.m.s noise of the coadded signals is . As for Omont et al. (2001), we defined a quality factor for the detections (A for good and B for poor) based on the consistency of the flux densities measured on different dates, on the stability of the pointing, on calibration uncertainties and general observing conditions (see Table 1).
| Source | z | R.A. | Dec. | Flux Density | time | Quality | 1.4 GHz | |
|---|---|---|---|---|---|---|---|---|
| (J2000.0) | [sec] | |||||||
| KUV 08086+4037 | 08 12 00.5 | +40 28 14.0 | A | – | ||||
| [VV96] J093750.9+730206 | 09 37 48.7 | +73 01 58.0 | B | * | ||||
| HS 1002+4400 | 10 05 17.5 | +43 46 09.0 | A | – | ||||
| HS 1049+4033 | 10 51 58.6 | +40 17 36.0 | A | – | ||||
| [VV96] J110610.8+640008 | 11 06 10.8 | +64 00 08.0 | A | * | ||||
| [VV96] J140955.5+562827 | 14 09 55.5 | +56 28 27.0 | A | – | ||||
| [VV96] J154359.3+535903 | 15 43 59.3 | +53 59 03.0 | B | – | ||||
| HS 1611+4719 | 16 12 39.9 | +47 11 58.0 | A | – | ||||
| [VV2000] J164914.9+530316 | 16 49 14.9 | +53 03 16.0 | A | |||||
NOTE – The radio flux densities at 1.4 GHz are extracted from the VLA FIRST survey.
The symbol * indicates that
there is no data available, and the minus symbol indicates
a upper limit to the flux density of 1 mJy.

3 Results
3.1 General properties
Thirty-five quasars were observed at 1.2 mm. Nine quasars were detected at levels , of which seven have signals , where . The 1.2 mm flux densities of these quasars are listed in Table 1. Twenty-six sources were not detected with flux density upper limits in the range 1.8–4 mJy (Table 2). The weighted mean signal of the non-detections is .
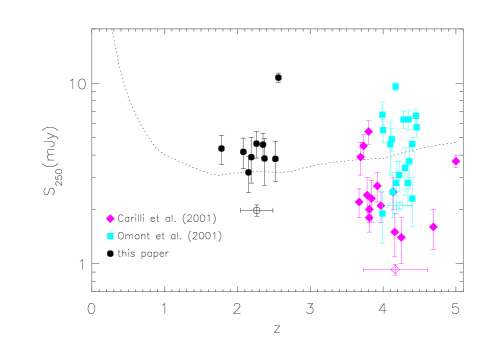
Fig. 1 displays the observed 1.2 mm flux density versus , the optical absolute magnitude in the B rest-frame band, which represents the bolometric luminosity, . Leaving aside J1409, which has an exceptionally high 1.2 mm flux density of , the other eight detected quasars have comparable flux densities of 3–4 mJy. There is no obvious correlation between and , a point which will be discussed in Sect. 4.
| Source | z | R.A. | Dec. | Flux Density | time | 1.4 GHz | |
|---|---|---|---|---|---|---|---|
| (J2000.0) | [sec] | ||||||
| HS 0749+4259 | 07 50 54.7 | +42 52 19.0 | – | ||||
| HS 0800+3031† | 08 03 42.1 | +30 22 54.0 | – | ||||
| HS 0808+1218† | 08 10 57.0 | +12 09 14.0 | – | ||||
| HS 0830+1833† | 08 32 55.7 | +18 23 01.0 | – | ||||
| HS 0834+1509† | 08 37 12.6 | +14 59 17.0 | – | ||||
| SBSS 0910+586 | 09 14 25.8 | +58 25 19.0 | * | ||||
| [VV96] J092230.1+710937 | 09 22 30.1 | +71 09 37.0 | * | ||||
| HS 0932+2410 | 09 35 34.0 | +23 57 20.0 | – | ||||
| [VV96] J093935.1+361001 | 09 39 35.1 | +36 40 01.0 | – | ||||
| [VV96] J095845.5+470324 | 09 58 45.5 | +47 03 24.0 | – | ||||
| HS 1110+3813 | 11 12 51.0 | +37 57 15.0 | – | ||||
| KUV 11467+3725 | 11 49 20.2 | +37 08 29.0 | – | ||||
| [VV96] J121010.2+393936 | 12 10 10.2 | +39 39 36.0 | – | ||||
| [VV96] J121303.1+171422† | 12 13 03.1 | +17 14 22.0 | |||||
| [BCF91] 524 | 13 04 12.0 | +29 53 49.0 | – | ||||
| [BBE90] 130623+283002 | 13 09 17.2 | +28 14 04.0 | – | ||||
| [VV96] J140148.4+543859 | 14 01 48.4 | +54 38 59.0 | – | ||||
| SBSS 1417+596 | 14 19 06.4 | +59 23 12.0 | * | ||||
| [VV96] J160637.6+173516 | 16 06 37.6 | +17 35 16.0 | – | ||||
| HS 1616+3708 | 16 18 15.5 | +37 01 03.0 | – | ||||
| [VV86] J162645.7+642654 | 16 26 45.7 | +64 26 54.0 | * | ||||
| HS 1707+4602 | 17 09 04.9 | +45 59 08.0 | – | ||||
| [VV96] J171635.4+532815 | 17 16 35.4 | +53 28 15.0 | |||||
| HS 1754+3818† | 17 56 39.6 | +38 17 52.0 | * | ||||
| [VV96] J183825.0+510558 | 18 37 25.3 | +51 05 59.0 | * | ||||
| HS 2134+1531† | 21 36 23.7 | +15 45 08.0 | * | ||||
NOTE – The radio flux densities at 1.4 GHz are extracted from the VLA FIRST survey.
Symbols as for Table 1.
† Quasars observed (and not
detected) at 850 by Priddey et al. (in preparation).
With a single measurement at 250 GHz (at , this corresponds to an emitted frequency of or a wavelength of ), it is not possible to distinguish whether the observed millimeter emission is thermal dust or synchrotron emission. The VLA 1.4 GHz FIRST survey (Becker, White, & Helfand 1995) provides a first estimate on the radio to millimeter slope. No radio source within 30′′ of six of the detected quasars is found to a limiting flux density of . Two mm-detected QSOs are not covered by the FIRST survey, and J1649 coincides with a radio source with a 1.4 GHz flux density of (Table 1). For the quasars not detected at 1.2 mm (Table 2), two sources have a radio counterpart with 1.4 GHz flux densities of . In all cases, the 1.4 GHz flux densities are too small to consider the quasars as radio loud. For the detected source J1649, the millimeter-radio spectral index is , well above the extrapolation of a synchrotron spectrum and close to the value expected at for starbursts (e.g., Carilli & Yun 1999). Its case is similar to the QSOs PSS J1048+4407 and PSS J1057+4555 detected at 1.2 mm and 1.4 GHz with comparable flux densities (Omont et al. 2001; Carilli et al. 2001b). We shall assume in the following that the millimeter flux density of the quasars detected at 1.2 mm is thermal in nature, as supported by their very recent deep VLA 1.4 GHz observations (Petric et al. in preparation).
For consistency with our earlier treatments (Omont et al. 2001), we adopt a dust emissivity index of , and a dust temperatures of 45 K111Adopting different values for the dust temperature and , e.g., 40 K and 2.0 (Priddey & McMahon 2001), will not change the main conclusions of this paper. In the redshift range , the FIR luminosity can then be expressed as a function of the 1.2 mm (250 GHz) flux density, , as
| (1) |
The corresponding proportionality factor for the quasars is . The derived FIR luminosities for the quasars detected at 1.2 mm are , with corresponding dust masses of a few , where is the dust absorption coefficient at in units of .
Like for the QSOs detected at , for the newly detected objects is about one tenth of the optical luminosity . If a substantial fraction of arises from young stars, such luminosities imply star formation rates approaching , comparable to the values derived for quasars (Omont et al. 2001; Carilli et al. 2001a).
3.2 Comments on Individual Sources
-
•
VV96 J140955.5+562827 (SBS 1408+567)
This quasar has an exceptionnally strong 1.2 mm flux density which puts it among the seven known high sources with S. Four of the latter are known to be strongly lensed, while there is presently no indication of a strong amplification for SBS 1408+567. The optical spectrum of SBS 1408+567 shows spectacular detached broad absorption lines (BAL) with double troughs (Korista et al. 1993). Deriving the redshift from the unpublished Keck HIRES spectrum of Barlow & Junkkarinen (1994) - and Junkkarinen (private communication), we recently detected CO in this QSO using the IRAM Plateau de Bure interferometer (Beelen et al. in preparation).
-
•
VV96 J154359.3+535903 (SBS 1542+541)
This source was discovered in the Second Byurakan Survey (Stepanyan et al. 1992) and has many interesting properties: BAL with a very high ionization degree (Telfer et al. 1998), associated absorption system and damped Ly (DLA) absorption system, and a strong X-ray absorption (Green et al. 2001).
-
•
VV96 J110610.8+640008 (HS 1103+6416)
It is the brightest optical source of the sample. Its spectrum was analysed by Koehler et al. (1999), using a high resolution HIRES/Keck optical spectrum and a UV HST spectrum. The most striking feature is a strong, complex absorption system at .
-
•
KUV 08086+4037
The only reference in SIMBAD is the discovery paper (Darling & Wegner 1996), quoting broad emission lines.
-
•
VV2000 J093748.7+730158
It displays a rich absorption system with a complex DLA at and a Lyman limit system near (Rao & Turnshek 2000).
-
•
HS 1002+4400, HS 1049+4033 and HS 1611+4719
For these three sources, the only references in SIMBAD are the report of their discovery in the Hamburg survey (Hagen, Engels & Reimers 1999). Their low–resolution spectra (available at http://www.hs.uni-hamburg.de) display rather broad emission lines without very peculiar features.
-
•
VV2000 J164914.9+530316
There is not a single explicite reference in SIMBAD except the Véron-Cetty & Véron catalogue. As discussed in Sect. 3.1, this QSO is weakly radio loud.
4 Statistical Study
In order to compare the results of the 1.2 mm studies of the and quasars and to search for possible correlations between the FIR luminosity (derived from the 1.2 mm flux density) and the optical luminosity (derived from the absolute B-Band magnitude ), we made a statistical study of the present data set and the QSO surveys by Omont et al. (2001) and Carilli et al. (2001a) which are based on the PSS and SDSS QSO samples, respectively, and are hereafter referred to as the PSS and SDSS samples. The statistical study is based on the survival analysis method which is the most appropriate to handle the censored data (upper or lower limits) in astronomical surveys (Feigelson & Nelson 1985; Isobe et al. 1986, Isobe & Feigelson 1986). In these methods the values of the upper (or lower) limits are formally taken into account for the statistical analysis. However, the algorithms assume that the limiting value is precisely measured, while in astronomy the limiting value is rather a specific likelihood upper limit (e.g., Gleser 1992). In this paper, we adopt a (99%) upper limit for the survival analysis whereas in the figures of this paper the upper limits are shown at the 68% level confidence level (see caption of Fig. 1).
4.1 Properties of the and QSOs
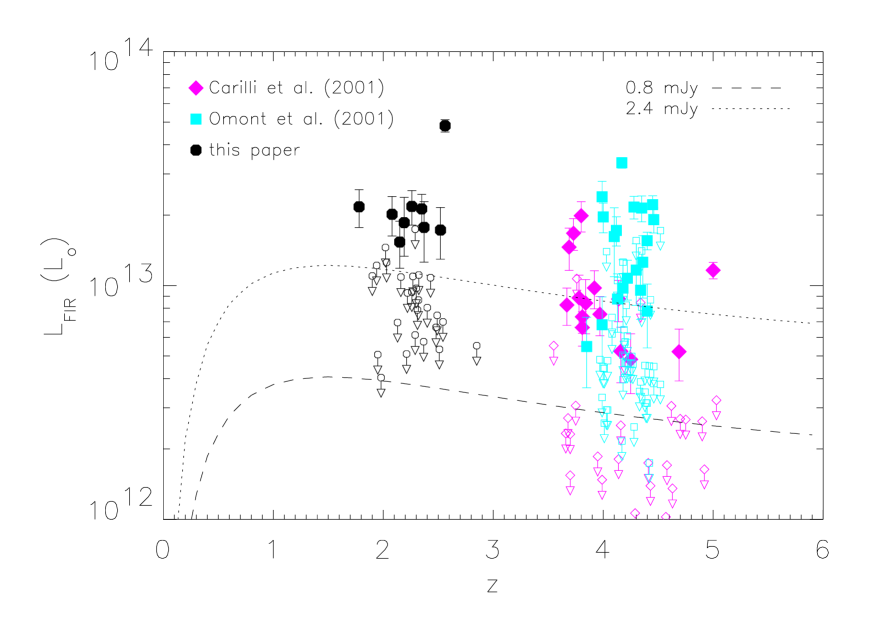
With similar 1.2 mm flux densities, the implied luminosities, dust masses and star formation rates for the quasars are comparable to the values derived for the SDSS and PSS samples. This is due to the fact that at high redshifts for a given FIR spectral energy distribution (SED) and luminosity, the (sub)millimeter flux density is nearly independent of redshift. At comparable sensitivities, there is no obvious difference in the 1.2 mm flux densities of the and quasars (note though that the flux densities correspond to rest-frame emission at 400 and 240 , respectively). This is illustrated in Fig. 2 where the 1.2 mm flux densities of the quasars and of the PSS and SDSS quasars are plotted against redshift.
| Sample | Numb. | Frac. | median r.m.s. | |||||
|---|---|---|---|---|---|---|---|---|
| (%) | [mJy] | [mJy] | [] | |||||
| Detected | 9 | 26 | 0.80 | 5.24 | 0.27 | 24.8 | 28.2 | |
| Undetec. | 26 | 74 | 0.93 | 0.71 | 0.17 | 3.3 | 27.9 | |
| Total | 35 | 0.90 | 1.97 | 0.14 | 9.3 | 28.0 | ||
| PSS | Detected | 19 | 29 | 0.70 | 4.52 | 0.16 | 15.7 | 27.8 |
| Undetec. | 44 | 71 | 0.90 | 0.40 | 0.13 | 1.4 | 27.9 | |
| Total | 63 | 0.80 | 2.07 | 0.10 | 7.2 | 27.9 | ||
| SDSS | Detected | 15 | 38 | 0.40 | 2.35 | 0.11 | 8.3 | 27.0 |
| Undetec. | 25 | 62 | 0.40 | 0.19 | 0.08 | 0.6 | 27.0 | |
| Total | 40 | 0.40 | 0.93 | 0.06 | 3.2 | 27.0 | ||
NOTE – The average flux of the sample is where the weights are and . Note that, in the cases of the and PSS QSO samples, the average total flux densities and luminosities are biased by the lower r.m.s. values of the detections.
The statistical properties of the 1.2 mm continuum surveys of the present QSO sample () and of the PSS and SDSS samples are compared in Table 3. Of the 35 quasars which were observed, 26% were detected, which is comparable to the detection fraction of 29% of the PSS sample (both surveys have comparable median r.m.s. values). The 1.2 mm continuum survey of the SDSS sample has about twice the depth of the and PSS samples, and a detection fraction of 38%.
A parallel study of quasars done at 850 by Priddey et al. (2002) report a detection fraction of 15% for a median r.m.s. error of , which is comparable to the r.m.s. error of the present study if one adopts a typical ratio of 850 to 1.2 mm flux densities of 2.5.
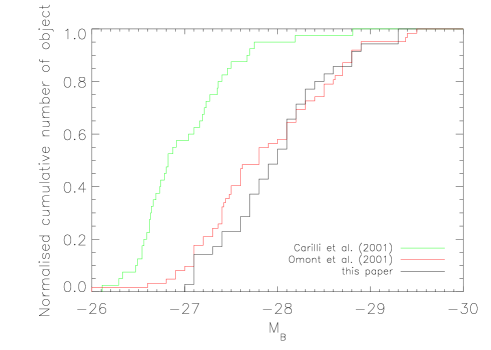
Figure 3 shows the cumulative distributions of the observed sources for the QSO sample compared to those for the PSS and SDSS samples. It illustrates the difference in range of the SDSS sample, which has a cumulative distribution fainter by about one magnitude compared with that of the PSS and samples (Fig. 3). For the three samples, there is no obvious difference in the cumulative magnitude distributions between the detected sources and the whole sample (not shown in Fig. 3).
4.2 The Far-Infrared Luminosity Distributions
The average 1.2 mm flux density, and hence , is smaller by about a factor two for the SDSS sample compared with the PSS and samples (Table 3 and Fig. 2). To statistically explore the differences in the FIR luminosity distributions between the samples, we applied the univariate methods of the survival analysis (e.g., Isobe et al. 1986). These statistical tests compute the probability, , that two samples derive from the same parent distribution.
Comparing the PSS and SDSS samples, the tests return probabilities between 12 and 17%, whereas for the PSS and samples, ranges between 25 and 38%, and for the SDSS and samples, from 1 to 5%. These tests indicate that the PSS and samples could derive from similar parent FIR luminosity distributions, whereas the SDSS sample could derive from a different underlying distribution. This difference is apparent already from its lower average flux densities (Table 3), and is even more pronounced when considering the average luminosities.
That the millimeter fluxes measured for the SDSS QSOs are lower than those found for the other samples could be related to the lower optical luminosities of the SDSS QSO or to some other bias introduced in the source selection. Some difference between the three samples could also arise from the fact that the PSS and SDSS samples result from homogeneous selections, whereas the QSOs are selected from the Véron-Cetty & Véron catalogue, which is a compilation of all QSOs discovered by various methods.
The FIR luminosities of the QSOs are only slightly higher than the luminosities of the QSOs, especially when comparing to the PSS sample which has a more similar optical luminosity distribution, a fact which indicates that there is no strong FIR luminosity evolution for optically luminous QSOs between . This result differs from that obtained by Archibald et al. (2001), who reported that the FIR luminosity of radio galaxies is a strong function of redshift.
4.3 Relation between the Far-Infrared and Optical Luminosities
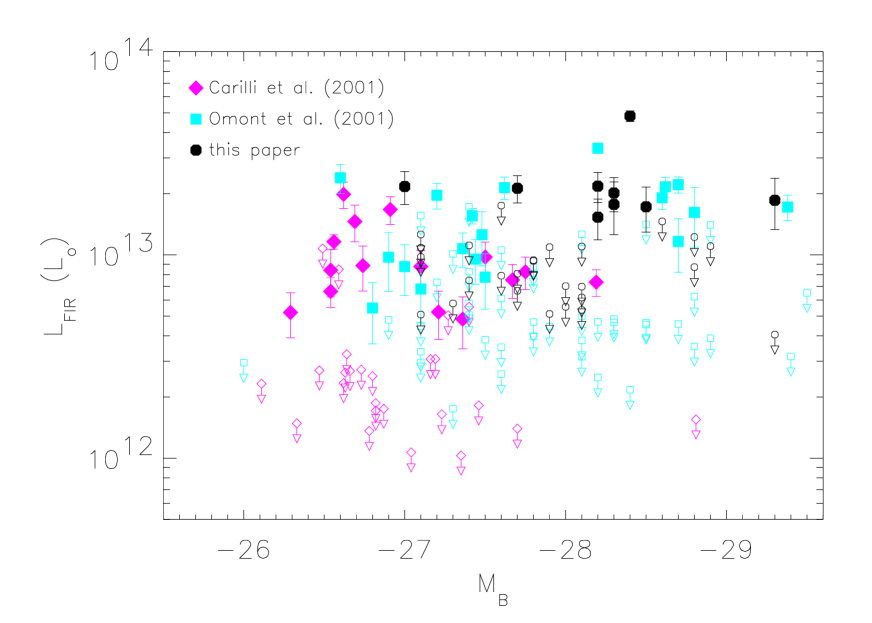
We applied the bivariate methods of the survival analysis to quantify the probability of a correlation between the FIR and optical luminosities. For the PSS and SDSS samples the tests return high values indicating that there is no correlation between and . Specifically, the Cox regression, the generalized Kendall’s tau and the Spearman’s rho222The small number of sources, detected and undetected, is near the limit of the Spearman’s rho test accuracy tests return values for of 55, 75 and 34%, respectively, for the PSS sample, and 77, 86, 94%, respectively, for the SDSS sample. For the concatenated SDSS and PSS samples is somewhat lower with 49, 41 and 15%, respectively. Since is significantly higher than 5%, no correlation between and can be proved. The three bivariate methods applied to the QSO sample return 22, 17 and 10%, respectively, again showing no strong correlation between and .
The lack of an apparent correlation between the FIR and optical luminosities agrees with previous studies (Omont et al. 2001; Carilli et al. 2001a; Isaak et al. 2002; Bertoldi & Cox 2002; Priddey et al. 2002). However, the lower average values of and for the the SDSS sample relative to the PSS and samples is suggestive that some correlation could be present, although the scatter of the present data is too large to quantify this further. QSO samples with a wider range in would be required for further studies.
Some proportionality between the FIR and the optical luminosities might well be expected. If the dust is heated by the AGN, both the FIR and blue luminosities should scale with the bolometric luminosity, and a strong correlation between the two should be seen, and is in fact observed for low-redshift QSOs (Haas et al. 2000). If on the other hand young stars are the main heating source of the dust, a correlation between the average optical and FIR luminosities could arise from the coeval growth of the central black hole and of the stellar spheroid, which is also suggested by the observation of a proportionality of the black hole and spheroid masses in local galaxies (e.g., Kormendy & Richstone 1995; Magorrian et al. 1998). A correlation between the optical and FIR luminosities might be overshadowed by a strong scatter due to the uncorrelated temporal variability of star formation and accretion activity.
5 Discussion
5.1 Absence of Redshift Evolution of
The comparison of the 1.2 mm observations of QSOs at and indicates that there is no strong evolution between of the FIR luminosity function of optically bright QSOs. Quasars apparently differ in this respect from radio galaxies which are FIR-brighter at higher redshifts. Archibald et al. (2001) argue that the apparent FIR luminosity evolution of radio galaxies they found is not a selection effect related to the inevitable youth of the known high-redshift radio galaxies. Both their luminosity and morphological evolution lead to the interpretation that high- radio galaxies trace the formation and evolution of massive elliptical galaxies (van Breugel et al. 1998; Lacy et al. 2000; Pentericci et al. 2001).
It may be premature to claim a true difference between the QSOs and high- radio galaxies. For one, we have yet observed only the most optically luminous QSOs, which are not representative for the bulk of the QSO emission at high redshift, which is due to QSOs with . Given the locally observed black hole to stellar bulge mass ratios, the time-integrated rate of star formation (assuming that is reflected by the FIR emission) vs. black hole growth (reflected by the optical emission) must in fact be higher by a factor ten compared to what we imply from the FIR to optical luminosity ratio of the QSOs in our sample. This suggests that either the optically less luminous QSOs show star formation rates similar to their bright peers, or the star formation rate increases in time for the entire population – a trend which is not confirmed for our QSO sample, and contrary to what is seen for the high- radio galaxies.
Another important unknown is the effective temperature of the FIR emission – which enters in high order when evaluating the FIR luminosity, not even to mention a possible evolution of the dust emission properties.
The lack of an evolution of the apparent FIR brightness (sampled at rest wavelengths 400 m and 240 m at redshifts 2 and 4, respectively) of optically bright QSOs might well be the cumulative effect of several underlying, evolving processes, such as the decline of star formation activity along with a drop in effective dust temperature, or opposite variations in the contributions of starbust and QSO radiation to dust heating.
Future studies should explore the FIR emission of optically fainter QSOs, and try to measure the temperature of the FIR SED to better estimate the FIR luminosity. To compare with an independent indicator of star formation activity, the molecular line emission could be measured. Currently, only the millimeter-brightest QSOs were observed, and the few resulting CO line detections (e.g., Cox et al. 2002b) show no redshift dependence of the line to continuum flux ratio.
5.2 Source Counts and Relation between Far-Infrared and Optical Luminosities
From correlated SCUBA and Chandra X-ray observations it is estimated that about of the submillimeter background sources contain AGN (Bautz et al. 2000; Barger et al. 2001; Blain et al. 2002). Most of these sources are not optical quasars, but have optically obscured nuclei. Among 100 blank-field sources detected with SCUBA and MAMBO, only two are known to be optical quasars (Knudsen et al. 2001; Bertoldi et al. 2000a),
At millimeter wavelengths the density of background sources with mJy is observed to be (Bertoldi et al. 2000a; Blain et al. 2002). The optically very bright quasars we have studied with MAMBO should make a negligible contribution to this millimeter background, as the following simple estimate illustrates. Fan et al. (2001a, b, c) infer a number density for QSOs with at all redshifts, of which about one quarter would be brighter 2 mJy if we assume that the millimeter brightness of QSOs is about constant from (Carilli et al. 2001a; Omont et al. 2001) through (this work) to the present. Optically very bright QSOs targeted in this study should thus only contribute some 0.05% to the millimeter background above 2 mJy. However, there are times as many QSOs with fainter optical luminosities to . If these had similar millimeter properties as their brighter peers (a yet unfounded extrapolation), such QSOs could contribute some 5 % to the millimeter background, a number marginally consistent with the direct count of such objects from the SCUBA and MAMBO surveys and the analysis of the Chandra–millimeter associations. However, it seems that such counts favour a smaller contribution which would imply a slightly smaller QSO FIR luminosity function in the range of to than their brighter counterparts.
6 Conclusion
We have presented results of an on-going survey measuring the thermal dust emission of high-redshift quasars. After surveying the millimeter continuum of QSOs (Omont et al. 2001; Carilli et al. 2001a), we here report 250 GHz (1.2 mm) observations of optically luminous (), radio-quiet quasars at redshift , corresponding to the peak of quasar activity. As for the sources, dust masses of and FIR luminosities of are implied by the observed 1.2 mm flux densities. If the FIR luminosity arises from massive star formation, the inferred star formation rate would be . The millimeter properties of the quasars are similar to optically comparably bright QSOs at . There is no sign of a redshift evolution of the FIR luminosity of optically luminous QSOs, in contrast to what was reported for radio galaxies by Archibald et al. (2001).
With a significant sample size in the combined QSO samples at redshifts and , (43 detections and 95 non-detections), we find a large scatter and no clear correlation between the millimeter and optical luminosities. Lower average values of and S250 for the SDSS sample compared with the PSS sample are suggestive of a gross correlation, but the large scatter makes this correlation of low statistical significance.
To better quantify the millimeter properties of high redshift QSOs and especially the contribution of star formation to their emission, we need to measure the millimeter emission of optically fainter QSOs. We further need to constrain the dust temperature through observations at submillimeter and far-IR wavelengths, the AGN activity through observations at far-IR, radio, and X-ray wavelengths, and we must measure the strength of the molecular and atomic/ionic line emission. Most of these observations will need to wait for a new generation of sensitive infrared/submillimeter observatories: SIRTF, Herschel and especially ALMA.
Acknowledgements: We are most grateful to E. Kreysa and the MPIfR bolometer group for providing MAMBO and to R. Zylka for creating the MOPSI data reduction package. Many thanks to the IRAM staff for their support, and to all guest observers during the pool observing sessions at the 30m. J. Bergeron, C. De Breuck and P. Petitjean are acknowledged for useful discussions, E.D. Feigelson for his help on the survival analysis, and V. Junkkarinen for providing the analysis of a Keck HIRES spectrum. The Referee’s comments and suggestions by C. Willott were very helpful to improve the manuscript. This work was carried out in the context of EARA, a European Association for Research in Astronomy. The National Radio Astronomy Observatory (NRAO) is a facility of the National Science Foundation, operated under cooperative agreement by Associated Universities, Inc. IRAM is supported by INSU/CNRS (France), MPG (Germany), and IGN (Spain).
References
- (1) Archibald, E.N., Dunlop, J.S., Hughes, D.H., et al. 2001, MNRAS, 323, 417
- (2) Barlow, T.A., & Junkkarinen, V.T. 1994, BAAS, 26, 1339
- (3) Barger, A.J., Cowie, L.L., Steffen A.T., et al., 2001, ApJ 560, L23
- (4) Bautz, M.W., Malm, M.R., Baganoff, F.K., et al. 2000, ApJ 543, L119
- (5) Becker, R.H., White, R.L., & Helfand, D.J. 1995, ApJ, 450, 559
- (6) Bertoldi, F., Menten, K.M., Kreysa, E., Carilli, C.L., & Owen, F., 2000a, in Cold Gas and Dust at High Redshift, Highlights of Astronomy Vol. 12, (ed.) D.J. Wilner
- (7) Bertoldi, F., Carilli, C.L., Menten, K.M., et al., 2000b, A&A, 360, 92
- (8) Bertoldi, F., & Cox, P. 2002, A&A, 884, L11
- (9) Blain, A.W., Smail, I., Ivison, R.J., Kneib, J.-P., & Frayer, D.T. 2002, Phys. Reports, in press
- (10) Carilli, C.L. & Yun, M. S. 1999, ApJ 513, L13
- (11) Carilli, C.L., Bertoldi, F., Rupen, M.P. et al. 2001a, ApJ, 555, 625
- (12) Carilli, C.L., Bertoldi F., Omont, A., Cox, P., McMahon, R.G., Isaak, K. 2001b, AJ, 122, 1679
- (13) Carilli, C.L., Cox, P., Bertoldi F., et al. 2002, ApJ, 575, 145
- (14) Cox, P., Omont, A., Djorgovski, S.G., et al. 2002a, A&A, 387, 406
- (15) Cox, P., Omont, A., Bertoldi, F. 2002b, in Infrared and Submillimeter Space Astronomy, eds. M. Giard, J.P. Bernard and I. Ristorcelli, EAS, EDP Sciences, p. 399
- (16) Darling, G.W., & Wegner, G., 1996, AJ 111, 865
- (17) Engels, D., Hagen, H.-J., Cordis,, L., Koehler, S., Wisotzki, L. Reimers, D. 1998, A&ASS, 128, 507
- (18) Fan, X., Strauss, M.A., Richards, G.T., et al., 2001a, AJ 121, 31
- (19) Fan, X., Strauss, M.A., Schneider, D.P. et al. 2001b, AJ, 121, 54
- (20) Fan, X., Narayanan, V.K., Lupton, R.H., et al. 2001c, AJ 122, 2833
- (21) Feigelson, E.D. & Nelson, P.I. 1985, ApJ, 293, 192
- (22) Gleser, J.L. 1992, in Statistical Challenges in Modern Astronomy, eds. E.D. Feigelson & G.J. Babu, Springer-Verlag, pp. 264-266
- (23) Green, P.J., Aldcroft, T.L., Mathur, S., Wilkes, B.J., Elvis, M., 2001, AJ 109, 558
- (24) Guilloteau, S., Omont, A., Cox, P., McMahon, R.G., & Petitjean, P. 1999, A&A, 349, 363
- (25) Haas, M., Müller, S.A.H., Chini, R., et al. 2000, A&A, 354, 453
- (26) Hagen, H.-J., Engels, D., Reimers, D. 1999, A&ASS, 134, 483
- (27) Isaak, K.G., Priddey, R.S., McMahon, R.G., et al., 2002, MNRAS, 329, 149
- (28) Isobe, T., & Feigelson, E.D. 1986, Nsl. WG Modern. Astron. Meth. 3, 209
- (29) Isobe, T., Feigelson, E.D. & Nelson, P.I. 1986, ApJ, 306, 490
- (30) Knudsen, K.K., van der Werf, P.P., Jaffe W. 2001, in Deep millimeter surveys. Implications for galaxy formation and evolution, J.D. Lowenthal & D. Hughes (eds.), World scientific Publishing, p. 168
- (31) Koehler, S., Reimers, D., Tytler, D., et al. 1999, A&A 342, 395
- (32) Korista, K.T., Voit, G.M., Morris, S.L., & Weymann, R.J. 1993, ApJS 88, 357
- (33) Kormendy, J., & Richstone, D. 1995, ARA&A, 33, 581
- (34) Kreysa, E., et al. 1999a, SPIE, 3357, 319
- (35) Kreysa, E., Gemünd, H.-P., Gromke, J., et al. 1999b, Infrared Physics & Technology, 40, 191
- (36) Lacy, M., Bunker, A.J., & Ridgway, S.E. 2000, AJ, 120, 68
- (37) Magorrian, J., Tremaine, S., Richstone, D., et al. 1998, AJ 115, 2285
- (38) Omont, A., McMahon, R.G, Cox, P., Kreysa, E., Bergeron, J., Pajot, F., & Storrie-Lombardi, L.J. 1996, A&A, 315, 1
- (39) Omont, A., Cox, P., Bertoldi, F., McMahon, R.G., Carilli, C. & Isaak, K.G. 2001, A&A, 374, 371
- (40) Page, M.J., Stevens, J.A., Mittaz, J.P.D., Carrera, F.J., 2001, Science 294, 2516
- (41) Pentericci, L., McCarthy, P.J., Röttgering, H.J.A., et al. 2001, ApJS, 135, 63
- (42) Priddey, R.S., & McMahon, R.G. 2001, MNRAS, 324, L17
- (43) Priddey, R.S., Isaak, K.G., McMahon, R.G. et al. 2002, MNRAS in press
- (44) Rao, S.M., & Turnshek, D.A., 2000, ApJS 130, 1
- (45) Sanders, D.B. & Mirabel, I.F. 1996, ARA&A 34, 749
- (46) Scott, S.E., Fox, M.J., Dunlop, J.S., et al. 2002, MNRAS 331, 817
- (47) Stepanyan, D.A., Lipovetskii, V.A., Chavushyan, V.O., Erastova, L.K., & Shapovalova, A.I., 1992, Astrophysics 34, 163
- (48) Telfer, R.C., Kriss, G.A., Zheng, W., Davidsen, A.F., Green, R.F., 1998, ApJ 509, 132
- (49) van Breugel, W.J.M., Stanford, S.A., Spinrad, H., Stern, D., & Graham, J.R. 1998, ApJ, 502, 614
- (50) Véron-Cetty, M.P., & Véron, P., 2001, A Catalogue of Quasars and Active Galactic Nuclei (9th Ed.) ESO Sc. Rep. 19
- (51) Zylka, R. 1998, MOPSI Users Manual, (IRAM: Grenoble)