Subarcsecond Imaging of Hot Cores with BIMA
Abstract
We present 1.4-mm BIMA observations with subarcsecond resolution of the bright dust and molecular line emission from hot cores associated with a sample of four ultracompact H ii regions: G9.62+0.19, G10.47–0.03, G29.96–0.02, G31.41+0.31. Density power laws can reproduce the observed continuum emission but break down on scales smaller than 2000 AU. A total of 38 transitions from 18 species are detected, with G10.47 and G31.41 showing the greatest number of lines. In particular, these sources display emission from two collisionally-excited transitions of methanol lying more than 950 K above the ground state. Outflows traced by H2S emission provide evidence for embedded exciting sources and the observed morphology of molecular lines is consistent with internal heating of the cores.
keywords:
ISM: molecules – ISM: structure – ISM: clouds1 Introduction: hot cores
Hot cores are dense condensations of gas found in the vicinity of ultracompact H ii (UCH ii) regions. Their hot compact nature was first revealed by ammonia observations (e.g. [\astroncitePauls et al.1983]), which also provided the first clues to the different chemistry occurring in hot cores ([\astronciteWalmsley et al.1987]). Compared with dark clouds, the abundances of several species showed orders of magnitude enhancements which led to the proposition that evaporation of grain mantles was important ([\astronciteMenten et al.1986]; [\astronciteHenkel et al.1987]). The inclusion of freeze-out onto dust grains in chemical models yielded good agreement and gave the first clues to the formation process of massive stars, namely that they must go through a cold collapse phase of evolution ([\astronciteBrown, Charnley & Millar1988]).
Most studies of hot cores to date have been limited either spatially or spectrally. Single-dish studies of the rich chemistry of hot cores can yield valuable information on the species present and allow column densities to be estimated (e.g. [\astronciteTurner1991]; [\astronciteMacdonald et al.1996]). However in order to derive spatial information, high resolution observations must be made. The VLA has led the field here with subarcsecond imaging of ammonia ([\astronciteCesaroni et al.1998]) which permits temperature and density information to be derived on scales of a few thousand AU. However, it is millimetre/submillimetre interferometry which hold the key to simultaneously probing the structure and chemistry of hot cores. Furthermore, it is in the 1.3-mm window that current instruments can make substantial gains with the wide variety of molecular lines that are accessible and the fact that the continuum emission will be dominated by emission from dust rather than free-free emission from ionized gas in an H ii region. To date 1.3-mm observations have been made towards the Orion hot core ([\astronciteBlake et al.1996]) and W3(OH) ([\astronciteWyrowski et al.1997], 1999), as well as two of our targets (G29.96 and G31.41), albeit with lower resolution ([\astronciteMaxia et al.2001]).
The proximity of hot cores to H ii regions led early studies to suspect that hot cores may be heated by radiation from the newly-formed OB stars within the H ii region. However, there is now mounting evidence that at least some hot cores mark the sites of massive star formation (e.g. [\astronciteHofner et al.2001], [\astronciteTesti et al.2000]). In the next section, results are presented of a new 1.4-mm BIMA study toward UCH ii/hot core regions, with the aim of separating H ii regions and hot dust from the molecular cores. On the whole, our data support the notion that our target hot cores contain embedded sources.
2 BIMA observations
The observations were made with the 9 elements of the BIMA array at Hat Creek, California, equipped with 1.3-mm receivers. A sample of four hot cores near ultracompact H ii regions (G9.62+0.19, G10.47–0.03, G29.96–0.02, G31.41+0.31) was observed with angular resolution varying from 0.4 (G10.47) to 2.8 arcsec (G9.62). The correlator windows were set to cover a continuous bandwidth of 800 MHz centred at 216.4 and 219.9 GHz with spectral resolution of 4.3 km s-1. In addition, C18O and H2S were observed with higher spectral resolution (1.1 km s-1). The 1.4-mm continuum images were made by summing the line-free channels in each band. All four regions were classified as ‘line-rich’ by [*]htmm.
3 Results I: 1.4-mm continuum
In each case continuum emission was detected towards the hot core positions at 1.4 mm, clearly resolved from the respective UCH ii regions. Comparing our 1.4-mm images with VLA and our own BIMA 3-mm data shows that the 1.4-mm emission is due to warm dust grains. Only in G10.47 is the peak 1.4-mm continuum coincident with a UCH ii region. In G9.62 and G29.96 continuum emission is also detected towards the UCH ii region(s), which appears to be free-free emission from the ionized gas, although in G29.96 there does appear to be some warm dust within the shell of the UCH ii region. The water masers ([\astronciteHofner & Churchwell1996]) in each region are associated with the dust continuum emission. Images comparing the dust continuum with the free-free emission are given in [*]wgm02.
The peak continuum flux ranges from 0.2 to 0.7 Jy per beam, equivalent to brightness temperatures of up to 98 K (in a beam of 0.5 arcsec towards G10.47). Thus the dust emission is warm. Masses of a few hundred to a thousand solar masses are inferred from these data, which translate to molecular hydrogen column densities of cm-2 towards the cores. Volume densities as high as cm-3 are derived for G10.47 and G31.41.
The high angular resolution data enables us for the first time to study the structure of the dust cores on scales of 0.1 pc and below. Previous, single dish studies were limited in the modelling to larger scales, hence probing only the outer envelope (see [\astronciteHatchell et al.2000]). We have used the infrared radiative transfer models of [*]wc86 to model the inner structure of the cores. Results of spherical dust models containing embedded heating sources with luminosity of L⊙ were ‘reobserved’ with the spatial-frequency coverage of the BIMA observations and then compared to the observations directly in Fourier space. Density power laws (with indices ranging from –1.5 to –2.0) can be fit to the data, but they break down on scales of approximately 2000 AU. It is not yet clear what happens within this radius. Currently, we cannot distinguish between, e.g., optically thick embedded disks (cf [\astronciteCesaroni et al.1998]) or, on the other extreme, a dust free inner bubble.
4 Results II: Spectral line data
Emission was detected from 38 transitions from 18 species, although not all lines and species were detected in each source. G9.62 showed the fewest lines (12 for E, 15 for the hot core source G9.62F) and the least number of high excitation transitions. In contrast, G10.47 displayed 38 lines within the 1.6 GHz passband, a line density of 25 lines per GHz. By way of comparison, single-dish studies of hot cores have detected only half this quantity ([\astronciteMacdonald et al.1996]), demonstrating not only the richness the spectrum of hot cores but also how much potential information millimetre interferometry is capable of yielding.
The lowest energy line detected was the 21 line of C18O; the highest energy is the 25(3)24(4) transition of CH3OH which lies 986 K above the ground state. Note too that this methanol line is a high- line and thus is probably collisionally excited in hot gas, rather than pumped by infrared radiation from the warm dust.
In Figure 1 we present images of H2S 2(2,0)2(1,1), CH3OH 7(1)8(0) and HNCO 10(0,10)9(0,9) superimposed on the 1.4-mm continuum emission.
4.1 G9.62+0.19
G9.62 contains up to 9 H ii regions ([\astronciteTesti et al.2000]; [\astronciteCesaroni et al.1994]), A to I. Figure 1 marks the location of H ii regions D to G. The hot core is G9.62F, while G9.62E also appears to be a deeply embedded massive young stellar object. All the lines detected towards G9.62 peak at the position of F although most are also detected towards E. SO and H2S are the brightest lines towards both E and F. The linewidths are consistently higher towards the hot core source (typically 8 km s-1 for F compared with 5 km s-1 for E), possibly due to the presence of the outflow from F ([\astronciteHofner et al.2001]).
4.2 G10.47–0.03
G10.47 may be the most evolved of the sources here since there does appear to be two UCH ii regions embedded within the hot core. The UCH ii region marked B in Figure 1 splits into two (B1 and B2) at higher resolution ([\astronciteCesaroni et al.1998]). G10.47 has the brightest and broadest emission lines in our sample. Since the continuum brightness temperature is of order 100 K (see above) the presence of 40–50 K lines indicates gas temperatures in excess of 150 K. The typical linewidth is 13 km s-1. The brightest line in the passband is the 9(1,8)9(1,9) transition of H2CO (59 K). Surprisingly the second brightest is the 24(4,20)23(4,19) transition of ethyl cyanide (52 K). Two very high excitation lines of methanol (with upper energy levels exceeding 950 K above ground) were detected towards G10.47.
As shown in Figure 1, the emission from H2S and methanol is extended. Although no clear outflow is seen, the extension of the emission is asymmetric and could be part of a bipolar outflow. The ethyl cyanide (not shown) distribution resembles that of a shell, supporting the outflow interpretation. On the whole, the nitrogen-bearing species have a more compact distribution than oxygen-bearing species. In particular, the HNCO lines show a more compact appearance with increasing energy.
4.3 G29.96–0.02
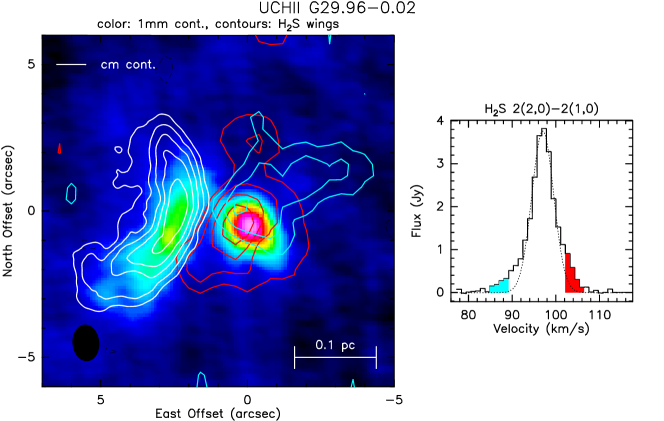
G29.96 is a spectacular cometary H ii region ([\astronciteWood & Churchwell1991]). Like G34.26+0.15 ([\astronciteMacdonald et al.1996]; [\astronciteWatt & Mundy1999]), the hot core lies close to the tip of the cometary bow shape and is thus a prime candidate for testing whether hot cores are internally heated by an embedded source or externally heated by radiation from OB stars in the nearby H ii region. In our observations all line emission originates from the hot core. No line emission is detected towards the UCH ii region. Furthermore, all the line emission peaks on the hot core itself with no evidence for stratification of species by type or excitation. Most notably, the HNCO lines (believed to be pumped by mid- and far-infared radiation) all peak on the dust core, as do optically thinner species such as HCO. Thus in G29.96 all evidence points towards the hot core being internally heated, presumably by a luminous embedded protostar. The lack of line emission towards the UCH ii region and the presence of line emission to the west of the hot core further supports the hypothesis that the cometary H ii region is a champagne flow.
4.4 G31.41+0.31
G31.41 is the second richest source in our sample with 37 detected lines. The two high-energy lines of methanol were detected towards G31.41 as well. The lines are slightly narrower than those of G10.47 ( 10 km s-1), although our spectral resolution is not sufficient to distinguish such differences to high accuracy. The continuum emission is slightly elongated in the same direction as the ammonia (4,4) core detected by [*]c98 suggesting they are tracing the same structure.
Intriguingly, and more clearly than in G10.47, the methanol and H2S shown in Figure 1 appear to trace a shell of emission perhaps indicative of an outflow. Alternatively, the emission south of the hot core (seen in the methanol image) may be a separate source since it is evident in several other lines. The HNCO peaks on the hot core, presumably at the position of the strongest infrared radiation field.
4.5 Outflows from hot cores
The higher-spectral resolution observations of H2S revealed non-Gaussian line wings towards all four targets. It is known that G9.62F houses an embedded source which drives an outflow seen in HCO+ ([\astronciteHofner et al.2001]), although our H2S does not show a clear bipolar distribution. The most striking result is for G29.96 (shown in Figure 2) in which spatially-bipolar red- and blue-shifted line wings are seen centred on the hot core. The SO 6(5)5(4) emission is also extended in the direction of the H2S lobes. Furthermore, the methanol masers of [*]mbc00 are aligned with this flow. This result provides further evidence for the presence of luminous protostellar sources embedded within hot cores.
5 Discussion: embedded sources in hot cores
In G10.47 and G31.41, three lines of methanol and four transitions of HNCO were detected. Three transitions of HNCO were detected in G29.96. We have constructed rotation diagrams (e.g. [\astronciteMacdonald et al.1996]) which are shown in Figure 3. These confirm the expectation from the above results that G10.47 and G31.41 contain hotter cores than the other sources in our sample with G10.47 being the hottest. Clearly more data points are desirable, especially of methanol, in order to constrain these fits further. The temperature of 505 K in G10.47 is the highest yet determined from molecular line observations of hot cores. However, it should be noted that the lowest energy line of methanol used in this derivation may be optically thick, which would give rise to an artificially high rotation temperature.
As pointed out above, the high energy lines of methanol are probably excited by collisions as they come from levels with high (=25 and 24). Thus they reflect the actual gas kinetic temperature on radii of 1500 to 2000 AU from the central source. It is not certain whether these temperatures represent those of the ambient gas or merely a shocked component.
For the HNCO lines, it is likely that their excitation is via a strong mid-infrared radiation field ([\astronciteChurchwell et al.1986]). All the HNCO lines we have detected are from the same (upper) state but lie in different ladders ([\astronciteZinchenko, Henkel & Mao2000]). Transitions between different -levels are very rapid and require either very high densities (exceeding 109 cm-3) or a mid- to far-infared radiation field. Lower values of are excited at longer wavelengths. The detection of the transition at 750 K above ground indicates a significant 20-m radiation field. [*]debuizer02 have detected the hot core in G29.96 at 18 m supporting the HNCO detections.

6 Conclusions
We have used the BIMA millimetre array to observe a sample of four UCH ii regions at a wavelength of 1.4 mm with subarcsecond resolution. In each case we detect compact dust cores spatially distinct from the UCH ii regions, showing that the hot cores mark the location of a hot dense condensation of gas and dust. Dust emission is also detected within the shell of the cometary UCH ii region G29.96. Modelling of the dust emission reveals density power laws with indices of –1.5 to –2 beyond a radius of 2000 AU. It is tempting to speculate that within this radius either no dust is present or the geometry changes from spherical to axisymmetric, although further observations with higher sensitivity on long baselines are required to validate either of these options.
Line emission from 38 transitions of 18 molecular species has been detected. G10.47 shows the greatest number of lines, with G31.41 coming a close second. In each of these sources two high-energy lines of CH3OH are observed with upper-level energies in excess of 950 K above the ground state. The high number for these transitions suggests that they are collisionally excited and are thus tracing highly excited gas. The spectral line emission peaks towards the dust cores with no strong evidence of excitation and/or chemical gradients, which indicates that the hot cores are probably not externally heated. Further evidence for internal heating comes from the observation of spatially-resolved bipolar wing emission from H2S in G29.96. Our observations point towards these hot cores as housing massive, luminous protostellar objects which have yet to develop a UCH ii region.
Acknowledgements.
Research with BIMA is funded by NSF grant AST-9981289.References
- [\astronciteBlake et al.1996] Blake G.A., Mundy L.G., Carlstrom J.E., Padin S., Scott S.L., Scoville N.Z., Woody D.P., ApJ, 472, L49
- [\astronciteBrown, Charnley & Millar1988] Brown P.D., Charnley S.B., Millar T.J., 1988, MNRAS, 231, 409
- [\astronciteCesaroni et al.1994] Cesaroni R., Churchwell E., Hofner P., Walmsley C.M., Kurtz S., 1994, A&A 288, 903
- [\astronciteCesaroni et al.1998] Cesaroni R., Hofner P., Walmsley C.M., Churchwell E. 1998, A&A 331, 709
- [\astronciteChurchwell et al.1986] Churchwell E., Wood D., Myers P.C., Myers R.V. 1986, ApJ 305, 405
- [\astronciteDe Buizer et al.2002] De Buizer J.M., Watson A.M., Radomski J.T., Piña R.K., Telesco C.M., 2002, ApJ, 564, L101
- [\astronciteHatchell et al.1998] Hatchell J., Thompson M.A., Millar T.J., Macdonald G.H., 1998, A&AS, 133, 29
- [\astronciteHatchell et al.2000] Hatchell J., Fuller G.A., Millar T.J., Thompson M.A., Macdonald G.H., 2000, A&A, 357, 637
- [\astronciteHenkel et al.1987] Henkel C., Mauersberger R., Wilson T.L., Snyder L.E., Menten K.M., Wouterloot J.G.A., 1987, A&A, 182, 299
- [\astronciteHofner & Churchwell1996] Hofner P., Churchwell E., 1996, A&AS, 120, 283
- [\astronciteHofner et al.2001] Hofner P., Wiesemeyer H., Henning T., 2001, ApJ, 549, 425
- [\astronciteMacdonald et al.1996] Macdonald, G.H., Gibb, A.G., Habing, R.J., & Millar, T.J., 1996, A&AS, 119, 333
- [\astronciteMaxia et al.2001] Maxia C., Testi L., Cesaroni R., Walmsley C.M., 2001, A&A, 371, 287
- [\astronciteMenten et al.1986] Menten K.M., Walmsley C.M., Henkel C., Wilson T.L., Snyder L.E., Hollis J.M., Lovas F.J., 1986, A&A, 169, 271
- [\astronciteMinier, Booth & Conway2000] Minier V., Booth R.S., Conway J.E., 2000, A&A, 362, 1093
- [\astroncitePauls et al.1983] Pauls T.A., Wilson T.L., Bieging J.H., Martin R.N., 1983, A&A, 124, 23
- [\astronciteTesti et al.2000] Testi L., Hofner P., Kurtz S., Rupen M., 2000, A&A, 359, L5
- [\astronciteTurner1991] Turner B.E., 1991, ApJS, 76, 617
- [\astronciteWalmsley et al.1987] Walmsley C.M., Hermsen W., Henkel C., Mauersberger R., Wilson T.L., 1987, A&A, 172, 311
- [\astronciteWatt & Mundy1999] Watt S., Mundy L.G. 1999, ApJS 125, 143
- [\astronciteWood & Churchwell1989] Wood D.O.S., Churchwell E., 1989, ApJS, 69, 831
- [\astronciteWood & Churchwell1991] Wood D.O.S., Churchwell E., 1991, ApJ 372, 199
- [\astronciteWolfire & Cassinelli1986] Wolfire M.G., Cassinelli J.P., 1986, ApJ, 310, 207
- [\astronciteWyrowski, Gibb & Mundy2002] Wyrowski F., Gibb A.G., Mundy L.G., 2002, in Crowther P.A., ed, The Earliest Stages of Massive Star Birth. Astronomical Society of the Pacific, San Francisco, p.43
- [\astronciteWyrowski et al.1997] Wyrowski F., Hofner P., Schilke P., Walmsley C.M., Wilner D.J., Wink J.E. 1997 A&A 320, L17
- [\astronciteWyrowski et al.1999] Wyrowski F., Schilke P., Walmsley C.M., Menten K., 1999, ApJ 514, L43
- [\astronciteZinchenko, Henkel & Mao2000] Zinchenko I., Henkel C., Mao R.Q., 2000, A&A, 361, 1079