00 \Year0000 \Month0 \Pagespan14 \lhead[0]M.G. Watson et al.: The XMM-Newton Serendipitous Source Catalogue \rhead[Astron. Nachr./AN XXX (200X) X]0 \headnoteAstron. Nachr./AN 32X (200X) X, XXX–XXX
The XMM-Newton Serendipitous Source Catalogue
Abstract
We describe the production, properties and scientific potential of the XMM-Newton catalogue of serendipitous X-ray sources. The first version of this catalogue is nearing completion and is planned to be released before the end of 2002.
keywords:
surveys — X-rays — methods: data analysismgw@star.le.ac.uk
1 Introduction
Serendipitous X-ray sky surveys have been pursued with most X-ray astronomy satellites since the Einstein Observatory. The resultant serendipitous source catalogues have made a significant contribution to our knowledge of the X-ray sky and our understanding of the nature of the various Galactic and extragalactic source populations. The XMM-Newton Observatory (Jansen et al., 2001) provides unrivalled capabilities for serendipitous X-ray surveys by virtue of the large field of view of the X-ray telescopes with the EPIC X-ray cameras (Turner et al., 2001; Strüder et al., 2001), and the high throughput afforded by the heavily nested telescope modules. This capability ensures that each XMM-Newton observation provides significant numbers of previously unknown serendipitous X-ray sources in addition to data on the original target (Watson et al., 2001). The compilation of a high quality serendipitous source catalogue from the XMM-Newton EPIC observations is one of the major responsibilities of the XMM-Newton Survey Science Centre (SSC; Watson et al., 2001).
This paper describes the approach taken to the production of the catalogue and an overview of its main properties together with some comments on its scientific potential. It should be stressed that we are describing here the first installment of the catalogue; further releases are planned as the constituent observations become public. The catalogue is not yet complete; we are aiming for release by the end of 2002. The description provided here thus relates to the “working” version from which the catalogue will be extracted once the full range of checks on integrity and quality have been completed. Nevertheless the catalogue project is at a sufficiently mature stage for the current version to be reasonably representative.
2 Catalogue production
2.1 Selection of catalogue fields
For the first installment of the catalogue we have selected XMM-Newton observations (“fields”) which fulfill the following criteria:
-
•
observation made before XMM-Newton revolution 300 (to match our planned catalogue release date to public availability of the observations);
-
•
at least one EPIC camera having a net exposure time seconds;
-
•
for the EPIC MOS cameras: data taken in any of the normal observing modes; the outer 6 MOS CCDs in each camera normally accumulate images even when the central CCD is taking data in window mode or timing mode;
-
•
for the EPIC pn camera: data taken in full-frame and large window imaging modes only; other EPIC pn modes either provide very limited sky coverage (e.g. small window modes) or no imaging data.
No other selection of fields, e.g. in terms of sky location, exposure time etc., has been made. Fig.1 shows the sky distribution of the catalogue fields. The overall sky distribution is reasonably uniform, although there are some biases such as the paucity of fields in the Cygnus region due to XMM-Newton visibility constraints.

The current working version of the catalogue described in this paper contains a total of around 700 fields. The average exposure time per field is ksec for the EPIC MOS cameras and ksec for the EPIC pn cameras. Only % of the total have data from all 3 EPIC cameras. This surprisingly low fraction reflects the exclusion of EPIC pn exposures not taken in full-frame or large window mode, coupled with the fact that the planned observation with all EPIC cameras did not take place due to operational problems for a fraction of the observations. The fraction of total fields with data from both EPIC MOS cameras is %.
2.2 Data processing
Data processing for the production of the XMM-Newton catalogue is based closely on the standard SSC pipeline (see, e.g., http://xmmssc-www.star.le.ac.uk/) used to process each XMM-Newton dataset for distribution to the observer, and population of the XMM-Newton Science Archive. Catalogue processing uses a fixed software and calibration data configuration in order to guarantee uniformity. The main processing stages for each XMM-Newton observation are:
-
•
production of calibrated events from the ODF science frames;
-
•
generation of the appropriate low-background time intervals using a threshold optimized for point source detection;
-
•
generation of multi-energy-band X-ray images and exposure maps from the calibrated events;
-
•
a four-stage source detection and parameterization procedure:
-
–
generation of a preliminary source list using a sliding-box technique and local background estimation;
-
–
generation of a background map from 2-D spline fits to the images with bright sources excised;
-
–
generation of a refined source list again using a sliding-box technique but employing the background map;
-
–
maximum-likelihood fitting and parameterization of sources in the refined list.
-
–
-
•
merging of the 3 camera-level source lists into an EPIC-level source list with merging on the basis of positional coincidence alone;
-
•
cross-correlation of the source list with a variety of archival catalogues and other resources using the CDS facilities in Strasbourg.
The source search approach utilized involves simultaneous fitting of 5 energy band images for each EPIC camera, thus producing a source list for each camera which contains source and detection information in each energy band (as well as the total band). The camera lists combined in the penultimate stage described above thus produce a merged source list which forms the reference source list for that observation.
For the purposes of producing the XMM-Newton catalogue a number of enhancements to the standard processing have been introduced (these features will shortly be introduced into the standard processing pipeline). The most significant of these are:
-
•
inclusion of the EPIC pn “out-of-time” events in the background model, thus reducing the spurious detection rate significantly;
-
•
correction of the astrometric reference frame of each XMM-Newton field using cross-correlation of the XMM-Newton source list with the USNO A2.0 catalogue (see section 3.4).
The current catalogue focuses on point-like sources. A search for extended sources is included in the catalogue processing on an experimental basis, but the results will not be included in the first version. Experience with this analysis will form the basis for adding extended source information to subsequent releases.
2.3 Quality control
Although the source detection algorithm described above is now mature, typically producing reliable source lists from most XMM-Newton observations, the approach is not perfect and is known to have problems in producing reliable results in a number of (rare) circumstances. These include:
-
•
where the EPIC image contains a bright point-like or high surface brightness extended source, small errors in the PSF model or background estimation can lead to significant numbers of spurious sources being detected at the bright source periphery;
-
•
the edges of the EPIC CCDs (primarily in MOS1) can show occasional brightening leading to spurious detections.
Each XMM-Newton field included in the catalogue is therefore visually screened to locate such defects. Where problems are noted the sources affected are “flagged” and the flag values transferred to the source lists. In rare cases (% of the total) the entire field has significant problems, e.g. very high background or very high surface brightness diffuse sources, which mean that it is of marginal value for detecting serendipitous sources. Such fields will be excluded from the final catalogue. Apart from these rare cases, the median fraction of sources flagged as being spurious amounts to only 4% overall, reflecting the maturity of the source detection approach. The screening process does not address the reality of low significance detections (i.e. sources are not flagged simply because they appear to be marginally significant visually); this issue is being pursued via simulations.
3 Catalogue properties
3.1 Source numbers
The working catalogue contains a total of source detections in any EPIC camera (i.e. in one or more cameras) and a total of sources detected in all 3 EPIC cameras. These numbers refer to a broad-band detection above a likelihood of 10, corresponding to . At this significance the a priori probability of spurious detections is low, corresponding to spurious source per field, although simulations are underway to verify the calibration of the likelihood parameterisation. The total sky area covered for detections in any camera is sq.deg., whilst for detection in all 3 cameras the area is sq.deg.
The large difference between the total number of sources detected and the number detected in all three cameras is due a combination of three effects: the fact that only 2/3 of the fields have data from all three cameras, because the fields-of-view of the cameras do not precisely overlap and because source lists at a likelihood of 10 are significantly incomplete.
For the released version of the catalogue these numbers will be reduced by the fraction flagged as spurious (and the small number of fields totally excluded). We also anticipate setting a somewhat higher likelihood threshold once we have completed our investigation of the reliability of detections as a function of likelihood, being pursued by simulations.
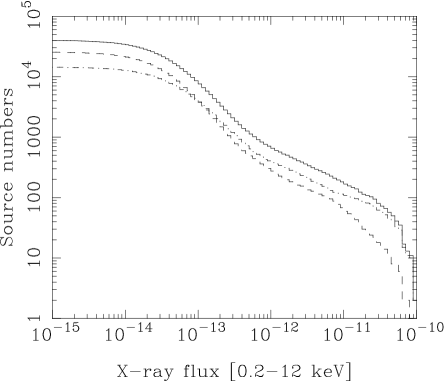
3.2 Source count distribution
Figure 2 shows the distribution for all EPIC pn sources in the working catalogue. The distribution is not corrected for sky coverage, i.e. how the actual sky area covered varies with X-ray flux. Comparing the uncorrected with the expected source counts demonstrates that the catalogue is essentially complete down to an X-ray flux (0.2-12 keV) (equivalent to in the 0.5-2 keV band and in the 2-10 keV band). This limit is in line with expectations given the exposure time distribution of catalogue fields. Around 30% of the catalogue sky area is covered to (0.2-12 keV). Work to establish the definitive coverage corrections is underway and will be part of the ancillary information included with the released version of the catalogue.
3.3 Count rate comparison
For the sources detected in more than one EPIC camera we can compare the count rates to investigate the accuracy and reliability of the catalogue (as well as the underlying calibration data). The overall count rate fidelity found is excellent. Investigation of the relatively small fraction of outliers has shown that these mostly correspond to spurious detections which fortuitously line up with detections in another camera. These and other anomalies will be removed in the released version of the catalogue.
3.4 Astrometry
For each XMM-Newton field, the catalogue processing (section 2.2) attempts to correct the astrometric reference frame using cross-correlation of the XMM-Newton source list with the USNO A2.0 catalogue (Monet et al., 1998). The technique employed involves finding the maximum likelihood in a grid of trial astrometric shifts and rotations with a likelihood function depending on the angular separation between each potential XMM-Newton–USNO object match. If an acceptable solution is found (% of fields) the resultant astrometric correction is applied to the XMM-Newton source list for that field. (The cases where an acceptable solution is not found are primarily fields with low numbers of X-ray sources and/or fields with high optical object density).
The results of applying this technique to the catalogue fields can be employed to quantify the initial accuracy of the astrometry of each XMM-Newton field (i.e. before correction). Fits to the distribution of shifts in RA, Dec and field rotation imply that the intrinsic accuracy of the XMM-Newton field astrometry (as determined solely from the in-orbit attitude solution) can be characterized by a Gaussian with arcsec. After correction using this technique, the residual field astrometric errors are of the order 0.5-1 arcsec, close to the nominal 1 arcsec. astrometric accuracy of the USNO catalogue itself.
As the typical statistical error-circle for a faint XMM-Newton source has arcsec., the size of the field systematic component determined justifies the arcsec. positional accuracy which has been assumed to date as the effective % confidence radius of uncorrected positions, e.g. for the identification of XMM-Newton source counterparts.
4 Scientific potential of the catalogue
The XMM-Newton catalogue represents a significant resource that can be used for a variety of astrophysical projects. Although deep Chandra and XMM-Newton pencil-beam surveys (e.g. Mushotzky et al., 2000; Hasinger et al. 2001; Giacconi et al. 2001; Brandt et al. 2001) have probed the faintest parts of the extragalactic source population, the XMM-Newton catalogue also can make a major contribution. The XMM-Newton catalogue reaches modest depths () at high coverage (tens of square degrees). As this flux limit is where the bulk of the objects that contribute to the X-ray background lie (due to the fact the distribution breaks to a flatter slope at around this flux), the large samples of medium-deep flux sources that the XMM-Newton catalogue provides will thus be a significant resource for X-ray background studies.
The XMM-Newton catalogue also provides a rich resource for generating well-defined samples for specific studies, utilizing the fact that X-ray selection is a highly efficient (arguably the most efficient) way of selecting certain types of object, notably AGN, clusters of galaxies, interacting compact binaries and very active stellar coronae. AGN samples have obvious value in evolution studies and cluster samples can provide, potentially, key measurements of cosmological parameters. Selecting “clean” samples requires knowledge of the likely parameter ranges of different types of object: some of this is already known but further “calibration” of this concept is one of the key aims of the SSC’s XID programme (Watson et al., 2001; Barcons et al., 2002). The inclusion of matches with archival catalogues for each XMM-Newton catalogue source also provides a valuable starting point for investigation of well-defined samples.
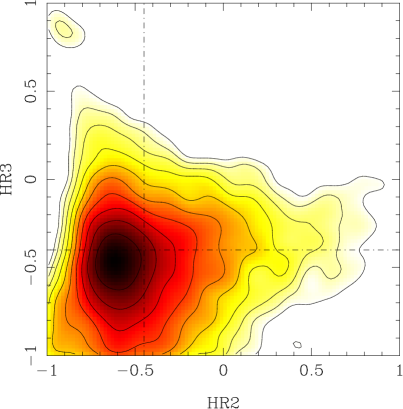
To illustrate some of the potential described above, Figure 4 shows the overall distribution of X-ray colours in the catalogue. This figure provides a glimpse of the power of the XMM-Newton catalogue for providing interesting samples. The spectrum of the X-ray background corresponds to HR2 , HR3 , but evidently the bulk of the catalogue sources have spectra softer than this. Thus merely by extracting a subset of XMM-Newton sources with X-ray colours harder than these limits, one automatically selects those objects that must be an important constituent of the background. Optical and near-IR observing programmes to investigate the nature of the hard source samples constructed in this manner are already underway.
As well as the potential for building up large samples, the brighter sources in the XMM-Newton catalogue also provide the prospect of obtaining high quality X-ray spectra and time series data (and morphology). Amongst the catalogue sources more than 15% have more than 200 EPIC pn counts, enough for a reasonable spectral characterization and crude variability indications, whilst 3% have more than 1000 counts, sufficient for a very good X-ray spectral measurement or variability analysis.
Acknowledgements.
Our ability to construct a high quality XMM-Newton catalogue rests on the efforts of many members of the SSC, ESA science operations (SOC) and XMM-Newton instrument teams who have contributed to every aspect of the project from operating the satellite, calibrating the instruments, writing the science analysis software and constructing and operating the processing pipelines.References
- [1] Barcons, X. et al. 2002, A&A, 382, 522
- [2] Brandt, W. N. et al. 2001, AJ, 122, 1
- [3] Giacconi, R. et al. 2001, ApJ, 551, 624
- [4] Hasinger, G. et al. 2001, A&A, 365, L45
- [5] Jansen, F. et al. 2001, A&A, 365, L1
- [6] Monet, D., Bird A., Canzian, B., Dahn, C., Guetter, H., Harris, H., et al. 1998, The USNO-A2.0 Catalogue, (U.S. Naval Observatory, Washington DC; VizieR Online Data Catalog, 1252)
- [7] Strüder, L. et al. 2001, A&A, 365, L18
- [8] Turner, M. J. L. et al. 2001, A&A, 365, L110
- [9] Watson, M. G. et al. 2001, A&A, 365, L51