The Fundamental Plane and the evolution of the ratio of early-type field galaxies up to
Abstract
We analyse the Fundamental Plane (FP) of 26 strong gravitational lens galaxies with redshifts up to , using tabulated data from Kochanek et al. (2000) and Rusin et al. (2003). The lens galaxies effectively form a mass-selected sample of early-type galaxies in environments of relatively low density. We analyse the FP and its evolution in the restframe Johnson and Gunn bands. Assuming that early-type galaxies are a homologous family, the FP then provides a direct measurement of the ratio evolution.
If we assume that the ratios of field early-type galaxies evolve as power-laws, we find for the lens galaxies an evolution rate of in restframe and in restframe Gunn for a flat cosmology with and . For a Salpeter (1955) Initial Mass Function and Solar metallicity these results correspond to mean stellar formation redshifts of and respectively. After correction for maximum progenitor bias, van Dokkum & Franx (2001) find a mean stellar formation redshift for cluster galaxies of , which is not significantly different from that found for the lens galaxies. However, if we impose the constraint that lens and cluster galaxies that are of the same age have equal ratios and we do not correct for progenitor bias, the difference is significant and we find that the stellar populations of the lens galaxies are 10–15 younger than those of the cluster galaxies.
We find that both the ratios as well as the restframe colors of the lens galaxies show significant scatter. About half of the lens galaxies are consistent with an old cluster-like stellar populations, but the other galaxies are bluer and best fit by single burst models with younger stellar formation redshifts as low as . Moreover, the scatter in color is correlated with the scatter in ratio. We interpret this as evidence of a significant age spread among the stellar populations of lens galaxies, whereas the ages of the stellar populations of the cluster galaxies are well approximated by a single formation epoch.
keywords:
galaxies: elliptical and lenticular, cD – galaxies: evolution – galaxies: formation – gravitational lensing1 Introduction
One of the central problems in astronomy is that of galaxy formation and evolution: when were the visible parts of galaxies assembled and when were the stars formed? The merging of galaxies leads to changes in their masses, and stellar evolution changes their luminosities. The evolution of the mass-to-light () ratio relates the mass and luminosity evolution.
Galaxy mass measurements are notoriously difficult. Fortunately, empirical relations such as the Tully-Fisher relation for spiral galaxies (Tully & Fisher 1977) and the Fundamental Plane (FP) for early-type galaxies (Dressler et al. 1987; Djorgovski & Davis 1987) can provide us with information on the masses and mass evolution of galaxies. The FP is a tight relation between the structural parameters and velocity dispersion, which under the assumption of homology implies that with low scatter (Faber et al. 1987).
Due to stellar evolution the ratio of a stellar population changes with redshift, and hence also the FP will change. The redshift evolution of the intercept of the FP is proportional to the evolution of the mean ratio. Hence, the tightness of the FP relation makes it a very sensitive indicator of the mean age of the stellar population of early-type galaxies (van Dokkum & Franx 1996).
For cluster galaxies, the ratio evolves very slowly, indicating that the stars were formed at redshifts (e.g. Kelson et al. 1997; Bender et al. 1998; van Dokkum et al. 1998). Current semi-analytical hierarchical models place the assembly time of typical early-type galaxies at much lower redshifts (e.g. Kauffmann 1996; Kauffmann & Charlot 1998; Diaferio et al. 2001). However, in hierarchical galaxy formation models the assembly time and star formation epoch are strongly dependent on the environment, with cluster early-type galaxies forming much earlier than those in the general field (e.g. Kauffmann 1996). Hence cluster early-type galaxies do not provide the most stringent tests of these models. Moreover, the measured evolution of early-type galaxies may underestimate the true evolution because of the effects of morphological evolution. If many early-type galaxies evolved from late-type galaxies at , the sample of early-type galaxies at high redshift is only a subset of all progenitors of present-day early-type galaxies. This would lead us to underestimate the luminosity evolution, and hence overestimate the stellar formation redshift (see van Dokkum & Franx 2001, hereafter vDF01).
Recent studies have started to explore the FP and ratios of high redshift early-type galaxies in the general field. Interestingly, the FP of field early-type galaxies appears to be quite similar to that of cluster early-type galaxies out to (Treu et al. 2001; van Dokkum et al. 2001), in apparent conflict with current semi-analytical models (see van Dokkum et al. 2001). However, there are indications for a significant offset between the two populations at higher redshift (Treu et al. 2002).
Kochanek et al. (2000, hereafter K00) analysed the FP and color evolution of strong gravitational lens galaxies up to . The lensing cross section is dominated by galaxies with high central velocity dispersions, and the lens galaxies effectively provide a mass-selected sample of field early-type galaxies which can be compared to optically selected samples of field and cluster galaxies. The mass-selection is important because it limits Malmquist-type biases, and it is much less sensitive to selection effects caused by morphological evolution. K00 find that the stars constituting the lens galaxies must have formed at for a flat cosmology with and , and conclude from their analysis that there are no significant differences between field and cluster early-type galaxies.
K00 analyse the evolution of the FP in the observed photometric bands, and their modeling necessarily includes the large variation in observed magnitudes and colors due to redshift (the “K”-correction). This complicates the measurement of the smaller effect due to evolution of (the stellar populations of) the lens galaxies. Rusin et al. (2003, hereafter R03) study the same sample of lens galaxies, with recent photometric observations included. They convert the data from observed filters into magnitudes in standard restframe bands, so that the evolution of the ratio that follows from the FP (under the usual assumption that early-type galaxies are a homologous family) can be investigated instead of the evolution within the FP. This clarifies the analysis and allows for direct comparison of the results with those of other FP studies. From their evolution analysis R03 find a (2) lower limit for the formation of the stars in lens galaxies. Although this limit is more precise, it is similar to that of K00. Hence, R03 also conclude that the evolution measurements favor old stellar populations among field galaxies, like those of cluster galaxies, and argue against significant episodes of star formation at , as predicted by the semi-analytical hierarchical models.
For the analysis in this paper we use the tabulated data of K00, extended with the recent photometric measurements as given by R03. We convert the observed surface brightnesses and colors to the restframe Johnson and Gunn bands. Our transformation to restframe differs from that of R03. In both approaches the modeled color between restframe band and observed filter is used to convert the observed magnitude into an estimate of the restframe magnitude. R03 obtain the modeled color for a given spectral energy distribution, whereas we use the observed color between a pair of filters to interpolate between the modeled colors for four different spectral types (Fig. 1). Moreover, while R03 use the (weighted) contribution of all observed magnitudes to determine the restframe magnitude, we select the best one with small observational error and filter close to the (redshifted) restframe band. Hence, the model dependence of our correction is small and we exclude observed magnitudes with large uncertainties, minimizing the error in the resulting restframe magnitude. We analyze the evolution of the lens galaxies and compare our results with those of R03 and with results from previous studies. Additionally, we test whether age differences between the lens galaxies are significant. To this end, we study the scatter in both the evolution and the restframe colors of the lens galaxies, and investigate whether the deviations are correlated.
This paper is organized as follows. In Section 2 we determine the FP parameters, using the lensing geometry to estimate the velocity dispersion. The transformation from observed to restframe bands is described in Section 3. In Section 4, we construct the FP of the lens galaxies and present the evolution derived from the FP. We estimate the age of the stellar populations of the lens galaxies by fitting single burst models to the evolution in Section 5. In Section 6 we study the colors of the lens galaxies. The results are summarized and discussed in Section 7. Unless stated otherwise we assume and a flat cosmology with and . We note that our results are not dependent on the value of the Hubble constant.
2 FP parameters
| Name Lens | ||||||
|---|---|---|---|---|---|---|
| () | () | (kpc) | () | () | ||
| 0047-2808 | 0.49 | 254 26 | 229 15 | 7.7 0.7 | 21.79 0.16 | 21.11 0.28 |
| Q0142-100 | 0.49 | 224 22 | 4.3 0.2 | 20.42 0.05 | 19.64 0.05 | |
| MG0414+0534 | 0.96 | 303 30 | 8.6 1.6 | 21.07 0.17 | 19.97 0.16 | |
| B0712+472 | 0.41 | 181 18 | 2.8 0.4 | 20.67 0.17 | 19.60 0.16 | |
| RXJ0911+0551 | 0.77 | 260 26 | 7.0 0.6 | 21.74 0.17 | 20.75 0.14 | |
| FBQ0951+2635 | 0.24 | 128 13 | 0.9 0.2 | 19.82 0.25 | 19.05 0.25 | |
| BRI0952-0115 | 0.41 | 117 12 | 0.8 0.2 | 20.00 0.21 | 18.61 0.20 | |
| Q0957+561 | 0.36 | 431 43 | 305 11 | 14.1 1.3 | 22.48 0.12 | 21.45 0.11 |
| LBQS1009-0252 | 0.88 | 198 21 | 1.9 0.3 | 19.81 0.14 | 18.90 0.13 | |
| Q1017-207 | 0.78 | 151 16 | 3.1 0.1 | 21.28 0.49 | 20.28 0.07 | |
| FSC10214+4724 | 0.75 | 241 26 | 11.8 5.2 | 22.97 0.44 | 22.03 0.56 | |
| B1030+074 | 0.60 | 218 22 | 4.2 0.6 | 21.38 0.14 | 20.14 0.25 | |
| HE1104-1805 | 0.73 | 316 32 | 6.4 1.9 | 21.34 0.33 | 20.22 0.30 | |
| PG1115+080 | 0.31 | 210 21 | 288 27 | 3.0 0.1 | 21.23 0.06 | 20.01 0.05 |
| HST14113+5211 | 0.46 | 190 19 | 3.8 0.4 | 21.70 0.09 | 20.72 0.11 | |
| HST14176+5226 | 0.81 | 292 29 | 230 14 | 7.5 0.9 | 20.98 0.15 | 20.35 0.12 |
| B1422+231 | 0.34 | 160 16 | 2.1 0.6 | 21.18 0.25 | 19.93 0.24 | |
| SBS1520+530 | 0.72 | 220 22 | 3.5 0.3 | 20.13 0.17 | 19.36 0.08 | |
| MG1549+3047 | 0.11 | 188 19 | 242 20 | 2.3 0.2 | 21.39 0.09 | 20.12 0.09 |
| B1608+656 | 0.63 | 292 29 | 6.2 1.0 | 20.68 0.19 | 19.88 0.15 | |
| MG1654+1346 | 0.25 | 206 21 | 4.9 0.1 | 21.99 0.07 | 20.73 0.05 | |
| MG2016+112 | 1.00 | 299 30 | 328 32 | 2.5 0.3 | 19.22 0.10 | 18.06 0.10 |
| B2045+265 | 0.87 | 378 38 | 4.1 1.3 | 20.50 0.44 | 19.41 0.30 | |
| HE2149-2745 | 0.50 | 203 20 | 4.3 0.4 | 20.92 0.12 | 20.36 0.12 | |
| Q2237+030 | 0.04 | 168 17 | 220 31 | 4.3 0.8 | 22.37 0.50 | 21.15 0.23 |
| HS0818+1227 | 0.39 | 251 25 | 6.6 0.2 | 22.18 0.07 | 21.13 0.04 |
The study of the FP of strong gravitational lens galaxies differs in two important aspects from that of cluster galaxies. First, the lens galaxies are individual galaxies spread over a large range in redshifts, instead of an ensemble of galaxies at the same redshift. Additionally, whereas studies of the FP of optically selected galaxies measure velocity dispersions from spectra, for lens galaxies we use the lensing geometry to estimate this quantity. The separation between lensed images of background sources increases with the mass of the lens and is therefore a measure of the velocity dispersion. The two remaining FP parameters, the effective radius and surface brightness, are determined from surface photometry as for cluster galaxies.
2.1 Velocity dispersion
For a singular isothermal sphere (SIS) mass model the relation between the velocity dispersion of the matter distribution and the separation of the source images is . Here, and are the angular diameter distances from the lens galaxy to the source and from the observer to the source. To determine these values, the redshifts of both the lens galaxy and the source are needed (e.g. Hogg 2000). If the redshift of a lens galaxy is not known spectroscopically, we adopt a photometrically estimated value111Obtained from the CfA-Arizona Space Telescope Lens Survey (CASTLES) web site at http://cfa-www.harvard.edu/castles/ with a uncertainty. The lens systems for which no redshift is known for the source, we exclude from our analysis. This leaves a total of 26 lens galaxies, of which 5 have a redshift that is estimated photometrically (Table 1). The velocity dispersion depends also (weakly) on cosmology through the angular diameter distances, but is independent of the value of the Hubble constant since the distances appear as a ratio.
The velocity dispersion is that of the total matter distribution, including possible dark matter, rather than the central velocity dispersion of the stellar component . For a given mass and luminosity distribution, the ratio can be modeled by solving the single Jeans equation for a spherical system with and the anisotropy parameter (e.g. Binney & Tremaine 1987). The overall mass distribution is assumed to be isothermal. We model the luminosity distribution by a Hernquist (1990) profile with characteristic radius . For each lens galaxy with effective radius in kpc (see Section 2.2), we integrate the resulting line of sight velocity dispersion within the Coma aperture to obtain an estimate for , so that the stellar velocity dispersion follows as .
For the sample of 26 lens galaxies, is distributed with a (biweight222Throughout this paper we use the biweight location and scale as estimators of the mean and standard deviation (rms) respectively. These estimators are robust for a broad range of non-Gaussian underlying populations and are less sensitive to outliers than standard estimators (e.g. Beers, Flynn & Gebhardt 1990).) mean of and a (biweight) standard deviation of . In the case of an isotropic system (), the estimated stellar velocity dispersion has a mean of and a standard deviation of . Hence, the properties of the sample of lens galaxies will be typical for early-type field galaxies close to , which have a characteristic velocity dispersion around (e.g. Kochanek 1994, 1996).
Several sources contribute to the uncertainty in . We account for the scatter in the image separation , which is small and set to 2%. Also the error in the effective radius (Table 1) contributes through the modeled ratio . For those galaxies for which only a photometric estimate of the lens redshift is available, we included an error of . Since the angular diameter distance depends on redshift this error is an additional contribution to the uncertainty in via the determination of and via the conversion of the effective radius in arcseconds into physical units of kpc. Apart from these errors in observational parameters, we also want to take into account that we have made several assumptions in the modeling of the ratio . For the 26 lens galaxies, the distribution of has a mean of , and for an anisotropy parameter of , and respectively. For each lens galaxy we apply the isotropic case , but to take the variation of with into account, together with the assumption of a SIS mass model and a Hernquist profile, we assume an additional error of in and hence in .
For 7 out of the 26 lens galaxies presented in this paper, a velocity dispersion measured from stellar kinematics is available: 0047-2808 (Koopmans & Treu 2003), Q0957+561 (Tonry & Franx 1999; Falco et al. 1997; Rhee 1991), PG1115+080 (Tonry 1998), HST14176+5226 (Ohyama et al. 2002), MG1549+3047 (Lehár et al. 1996), MG2016+112 (Koopmans & Treu 2002) and Q2237+030 (Foltz et al. 1992). Comparing the measured velocity dispersions (Table 1) with the modeled from the lensing geometry, we find for these 7 galaxies that the ratio is distributed with a mean of and dispersion of . For the sample of 7 lens galaxies both methods are consistent. However, due to peculiarities of the lensing system, such as the contamination of Q0957+561 by the mass distribution of the underlying cluster, the velocity dispersion from both methods can be significantly different for individual lens galaxies.
2.2 Effective radius and surface brightness
The lensing systems were observed with the WFPC2, NICMOS1 and NICMOS2 camera on the HST, in filters ranging from the visual F555W through the infrared F205W filter. For each system, the image with optimal contrast between the lens galaxy and the images of the background source is selected, and the effective radius and the mean surface brightness within the effective radius from fits to an law is determined. The data and model fits are described in detail by Lehár et al. 2000 and K00. Note that depends slightly on cosmology due to the conversion of the effective radius from units of arcseconds from the fit into physical units of kpc. Moreover, since the lens redshift is used in the conversion, we have to take into account a (small) additional contribution to the uncertainty in due to the assumed error in the lens redshift in the case it is estimated photometrically (see also Section 2.1).
In this paper we use the surface brightness at the effective radius (in ), which is related to by . We also define . In the following, we refer to the filter in which the fit was made as the reference filter. The dependence of effective radius on passband due to color gradients can be ignored because of the strong correlation between and (see Section 4), and we can use the observed colors (tabulated by K00) to calculate the effective surface brightness in each filter.
The effective surface brightnesses and colors are corrected for Galactic extinction with an extinction curve for a diffuse stellar medium (e.g. Cardelli, Clayton & Mathis 1989; O’Donnell 1994). The galactic extinction is obtained from Schlegel, Finkbeiner & Davis (1998). Extinction corrections on the effective surface brightness are typically magnitudes in the reference filter, which in most cases is the F160W filter. The three galaxies MG0414+0534, MG2016+112 and B2045+265 are exceptions with significantly higher galactic extinction of 0.18, 0.14 and 0.14 magnitudes respectively.
3 Transformation to restframe
In order to compare the FP of the redshifted lens galaxies directly to the FP of the Coma cluster at , we calculate the effective surface brightness of the lens galaxies in restframe Johnson band and restframe Gunn band by interpolating between filters.
In the following example we assume that the redshifted band falls between the WFPC2 F555W (=) and F814W (=) filters and the effective surface brightness is determined in the NICMOS F160W (=) reference filter. We assume a linear relation between the AB magnitudes of the redshifted filter and the and filter, so that for the restframe magnitude of a galaxy at redshift we can write
| (1) |
The constants are the conversion constants between the standard Vega magnitudes and AB magnitudes
| (2) |
with the fluxdensity of Vega, and the filter transmission. The transmission curves of the HST filters (including the CCD response) were obtained from STScI333 http://www.stsci.edu/instruments/observatory/cdbs/cdbs.html , and those of the and passbands were obtained from Bessel (1990) and Thuan & Gunn (1976) respectively. We used the CALCPHOT task of the STSDAS package in IRAF to calculate the conversion constants for the HST filters. The conversion constants for the and passband follow from Bessel (1990) and Frei & Gunn (1994) respectively. The last term in (1) includes the broadening of the band with redshift and makes the magnitude behave as if it is a flux, rather than a fluxdensity.

Equation (1) relates the color of a lens galaxy to its observed color. To determine , we model the and colors for four different spectral types, E/S0, Sbc, Scd and Im, using the spectral energy distribution of Coleman, Wu & Weedman (1980). This gives four estimates of . Using the observed color of the lens galaxy we interpolate linearly between the modeled colors of the two nearest spectral types (Fig. 1). In this way we obtain the best-fit color and corresponding value of for the lens galaxy. To estimate the uncertainty in the conversion constants we compare modeled colors with those predicted by Frei & Gunn (1994). We find that the differences are small and estimate the uncertainty at 0.02 magnitudes.
The observed color is then used to relate the effective surface brightness in the reference filter to that of the restframe band
| (3) |
Similar transformations are derived for each lensing system. In cases where observations are available in more than two passbands, we calculate for all filter combinations and make a selection based on the following criteria: the error in , the wavelength difference between the redshifted band and the observed filter, and a preference for filter pairs enclosing the redshifted band. The latter implies an interpolation between two filters, whereas otherwise we have to extrapolate. As byproducts of our procedure we find the SEDs that provide the best fits to the observed colors of the lens galaxies. For the restframe and band this yields respectively 20 () and 19 () lens galaxies that are best fitted by the E/S0 spectral type, whereas the colors of the remaining lens galaxies are closest to the Sbc spectral type.
Since in (1) behaves like a flux, the effective surface brightness decreases as with increasing redshift444The restframe magnitude (1) behaves therefore as a -corrected magnitude.. We correct the surface brightnesses for this cosmological dimming. For the 26 lens galaxies, the resulting values for the restframe Johnson and Gunn effective surface brightness and are given in Table 1, together with the other two FP parameters; the central stellar velocity dispersion and effective radius . We have also included the redshift of the lens galaxies and the velocity dispersions measured from stellar kinematics when available.
4 FP and Evolution

The Fundamental Plane has the form
| (4) |
(Dressler et al. 1987; Djorgovski & Davis 1987), with in kpc, in and () in . We adopt for the coefficients and the values derived by Jørgensen et al. (1996) for a sample of 225 early-type galaxies in nearby clusters. They found for the Johnson band and , and for the Gunn band and .
We use the tabulated photometric and spectroscopic data of Jørgensen et al. (1995a, 1995b) to construct the FP of Coma. The edge-on projection of the Coma FP in the band is shown in Fig. 2 (small dots). A linear fit to the coma FP yields an intercept of and for the and band respectively. Large symbols show the lens galaxies. The lens galaxies show a large scatter, and are offset with respect to the FP of Coma. This relative difference can be attributed to the evolution of the ratios of galaxies, and the large scatter may in part be caused by the large range of redshifts spanned by the lens sample.
As usual in FP evolution studies, we assume that early-type galaxies are a homologous family, i.e. that they are structurally similar. The total mass of a galaxy (including possible dark matter) is then proportional to an effective mass . With the total luminosity proportional to , the FP relation implies that the effective mass-to-light ratio in the band (e.g. Treu et al. 2001). The tightness of the FP relation implies a low scatter in the ratios of early-type galaxies of (Faber et al. 1987; Jørgensen, Franx & Kjærgaard 1996). Hence, the evolution of can be well studied via the evolution of the FP.
We assume that all early-type galaxies evolve in the same way, i.e. the coefficients and are independent of redshift and the same for cluster and field early-type galaxies. Until now there is no convincing (observational) evidence against these assumptions, but this might change if more and deeper data become available (e.g. van Dokkum & Franx 1996; van Dokkum et al. 2001; Treu et al. 2002). If furthermore the effective radius and velocity dispersion do not change with redshift, the difference in FP intercept is due to a difference in surface brightness caused by luminosity evolution. As a result, the evolution of the intercept of the FP is proportional to the evolution of the mean ratio. For each lens galaxy, the difference in FP intercept with respect to the Coma FP (Fig. 2) can be expressed as an offset in its ratio relative to that of a galaxy of the same mass in Coma. Fig. 3 (two left panels) shows the dependence of the offset on redshift, in the restframe band. The ratio of lens galaxies clearly shows a trend with redshift, with the highest redshift objects having the lowest ratios.
From a linear fit to the ratios of the 26 lens galaxies, we find an evolution rate of and in restframe and band respectively. The intercept of the fit, at , is and respectively, so that locally there is no significant offset in the mean ratio of the lens and cluster galaxies. If this offset is forced to be zero, we find best-fit evolution rates for the and band of and , which are only slightly higher than for the unconstrained fit. (The errors from the fit are smaller than for the unconstrained fit since only the slope is a fitting parameter, while the intercept is fixed to zero.) Restricting the fit to only the 21 lens galaxies with spectroscopic redshifts, has no significant effect on the results. Similarly, we find no significant differences if we exclude the lens galaxies from the fit for which a modest extrapolation was needed in the transformation to restframe band; or if for the 7 lens galaxies for which the velocity dispersion measured from stellar kinematics is available, this value is used instead of the modeled from the lensing geometry.
For cluster galaxies van Dokkum et al. (1998) find in the band an evolution rate This means on average a faster evolution for the lens galaxies, but the difference is only significant if the ratio of lens galaxies is forced to coincide with that of cluster galaxies at . The value for the cluster evolution rate by van Dokkum et al. (1998) does not take into account possible effects due to morphological evolution. If early-type galaxies were transformed from late-type galaxies at modest redshifts (e.g. Dressler et al. 1997) the early-type galaxies that were already present at high redshift are only a subset of all progenitors of low redshift early-type galaxies. As a result of this “progenitor bias” (vDF01) the formation redshift of morphologically selected cluster early-type galaxies may be overestimated. The lens galaxy sample is probably much less affected by progenitor bias, since they are selected on mass and not on morphology, but due to the merging of galaxies, a fraction of the progenitors may still not be accounted for. After applying the maximum correction for progenitor bias allowed by the data, vDF01 find a cluster evolution rate of in the band, similar to the evolution rate for the lens galaxies. These results suggest that, if there is no progenitor bias, field galaxies may be younger than cluster galaxies, but that such an age difference becomes less significant if we correct for possible progenitor bias.
Our results are consistent with determinations for field galaxies based on direct spectroscopic measurements of the velocity dispersions. For the band, van Dokkum et al. (2001) arrive at an evolution rate of , and Treu et al. (2002) find a value of . Comparing our results for the band with those of R03, we find that the evolution rate obtained by R03 is on average slower, but the () confidence limits still overlap. For intercepts that are allowed to vary and forced to be zero, R03 find an evolution rate of and respectively.
The error analysis and the transformation to restframe of R03 differs from ours (see also Section 1), but we cannot further investigate the effects of these differences, as R03 do not give their resulting fundamental plane parameters. However, if we add (in quadrature) an constant additional error to the observed uncertainties in the ratios of the lens galaxies, the slope of the fit does decrease. Around the linear fit we measure a (biweight) scatter of for the band and for the band555 The scatter in the band is probably higher than in the band due to the fact that the band is more sensitive to recent star formation., which in both cases is higher than the expected scatter from the observational errors of . If we now take for the constant additional scatter the difference (in quadrature) between the measured and expected scatter, we find for the unconstrained fit in the band an evolution rate of , almost identical to the result of R03. If the offset is forced to zero the slope changes less, giving an evolution rate of . Note that R03 rescale their input errors so that the best-fit model has a reduced of one. They assume that the additional scatter is due to underestimated errors in the data set, whereas we propose that internal population differences cause the additional scatter. Hence, we multiply our results with the square root of the reduced to reflect this aspect, but we do not change the uncertainties on the input data.
The additional scatter implies that the ratios of the lens galaxies are not well fitted with a single evolution rate, whereas for the cluster galaxies the fit is very good (e.g. van Dokkum et al. 1998). This may be due to a significant spread in stellar population ages among field galaxies, which induces an additional scatter measured in the evolution rate of the lens galaxies In the next Section, we relate the evolution to stellar population ages by fitting simple single burst models. In Section 6, we then study the restframe colors of lens galaxies and their evolution. To find out whether there is a significant age spread, we also investigate scatter in color and if it is correlated with the scatter in ratio.
5 Stellar population ages
The evolution of the ratio depends on the age of the stellar population. A stellar population which formed at low redshift will evolve faster than a population formed at high redshift: the luminosity of a young population becomes rapidly fainter when short-lived massive and bright stars disappear, whereas the dimming of the light is more gradual for an old population dominated by low mass stars. We estimate the stellar population ages of lens galaxies and the age difference between lens and cluster galaxies by fitting simple single burst models to the evolution.
The ratio of a single burst stellar population with fixed mass evolves as
| (5) |
with the stellar formation time, corresponding to a stellar formation redshift (e.g. Tinsley & Gunn 1976). The coefficient depends on the Initial Mass Function (IMF) and metallicity, and also on the passband in which the luminosity is measured. For a normal IMF with Salpeter (1955) slope and Solar metallicity, and for the restframe and bands (Worthey 1994). Note that the predicted evolution is independent of because the age dependence of the ratio is a power-law.
We first investigate if we can fit the observed evolution of the lens galaxies by a single burst evolution model with the same stellar formation redshift as has been derived previously for cluster galaxies (the null-hypothesis). In Section 5.2 and 5.3 we investigate the range of allowed by the data.
5.1 Can cluster galaxies and lens galaxies have the same age?
Before investigating more complex models we consider the case that lens galaxies and cluster galaxies have the same luminosity weighted stellar age. To determine the mean stellar formation redshift of cluster early-type galaxies we fit a single burst model (5) to previously published restframe band data for the clusters CL1358+62 (Kelson et al. 1997), CL0024+16 (van Dokkum & Franx 1996), MS2053+03 (Kelson et al. 1997) and MS1054-03 (van Dokkum et al. 1998) at redshifts 0.33, 0.39, 0.58 and 0.83, respectively, normalized with respect to the average ratio of the local Coma cluster at (Jørgensen et al. 1996).
To perform such a single burst fit, we minimize
| (6) |
with the number of observations used as constraints, the th observation, the corresponding single burst prediction and the uncertainty or error in this observation. To determine the confidence levels, we calculate the difference in between a model and the overall minimum, , to which the usual Gaussian confidence levels can be assigned (e.g. Press et al. 1999).
The resulting best-fit mean formation redshift . This direct fit does not take into account possible progenitor bias. After applying the maximum correction for progenitor bias allowed by the data, vDF01 find for cluster galaxies. Therefore, we consider as a plausible range for the mean star formation epoch of cluster early-type galaxies.
We fitted single burst models with this range of formation redshifts to the restframe and band data of the lens galaxies. The fits improve towards higher formation epoch, but even those with maximum progenitor bias correction are rejected with nearly . We can allow for an offset between ratios of lens galaxies and those of cluster galaxies. We will describe this offset with the value of at , which we denote by . For a stellar formation epoch ranging from to (no to maximum progenitor bias correction) the offset varies from to for the band, and from to for the band. These models with a systematic offset fit the lens data better, but are still rejected with confidence.
5.2 Model A: unconstrained fit
We assume that the ratios of field galaxies are independent of those of cluster galaxies, i.e. a cluster galaxy of a given age can have a very different ratio than a field galaxy of the same age. This may be the case if, e.g. the metallicities of field and cluster galaxies are different at a given mass. In addition to the stellar formation redshift , we also have the normalization of the single burst model as free parameter. We describe this second parameter with (see Section 5.1).
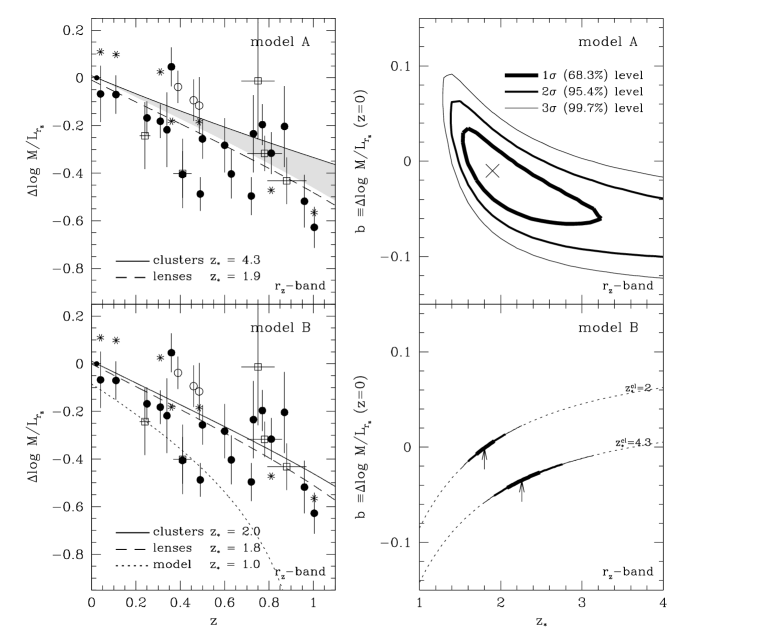
For a range of and values, we fit single burst models the observed values of the redshifted lens galaxies. For the band, the 1,2 and 3 limits on and are shown the in the upper-right panel of Fig. 3, with the minimum indicated by a cross. The best-fit values of and are and for the band, and and for the band (Table 2). Note that the given uncertainties are errors unless noted. The evolution that corresponds to the best-fit values is shown in the upper-left panel of Fig.3 (dashed line). Since for both and band the model parameter is not significantly different from zero, we obtain similar best-fit values for if we normalize the single burst model such that , i.e. if we assume that locally the average ratio of field and cluster galaxies is the same.
5.3 Model B: simultaneous fit to lens and cluster galaxies
Here we assume that the stellar populations of field and cluster galaxies evolve in the same way. The stellar populations of the lens galaxies may form at a different redshift than those of the cluster galaxies, but galaxies of a given age have identical ratios. For the formation redshift of the stars in cluster galaxies we use the values that we obtained in Section 5.1: if not corrected for progenitor bias and after correction for maximum progenitor bias. In both cases we determine the constraints on for the lens galaxies. Note that and are coupled in this model, because of the constraint that lens galaxies with the same age as cluster galaxies have identical ratios. For the band the resulting constraints on (and hence ) are shown in the lower-right panel of Fig. 3, with the best fit values indicated by arrows. From maximum to no progenitor bias correction, we find ranging from 1.6 to 2.4 () for the band, and from 1.6 to 2.6 () for the band (Table 2). For the case of maximum progenitor bias the evolution that follows from the best-fit value in the band, is shown in the lower-left panel of Fig. 3 (dashed line).
| model | band | band |
|---|---|---|
| A | 1.8 (-0.5/+1.4) | 1.9 (-0.6/+1.9) |
| B (with ) | 1.7 (-0.1/+0.2) | 1.8 (-0.2/+0.2) |
| B (with ) | 2.1 (-0.2/+0.3) | 2.3 (-0.3/+0.3) |
5.4 Summary of results
We have demonstrated that the evolution of lens galaxies cannot be fitted with models that provide good fits to cluster galaxies. The fit clearly improves if lens galaxies are allowed to be systematically offset from cluster galaxies due to metallicity differences or other systematic effects.
If we consider both this offset and the stellar formation epoch of the lens galaxies as free parameters, the best-fit single burst model in the and band are consistent. The resulting offset is not significantly different from zero, and although the best-fit stellar formation redshift implies for lens galaxies on average a younger stellar population than for cluster galaxies, the resulting () range of is not significantly different from the formation epoch for cluster galaxies of for the full range from no to maximum progenitor bias correction.
If we impose the constraint that galaxies of the same age have the same ratio irrespective of their environment, we find stellar formation redshifts for the lens galaxies of if the stars in cluster galaxies formed at (maximum progenitor bias), and if the stars in cluster galaxies formed at (no progenitor bias). In the latter case the stellar populations of the lens galaxies are significant younger (10–15 at the present epoch) than those of the cluster galaxies.
If the local offset between lens and cluster galaxies is allowed to vary, R03 find for the stellar formation redshift of the lens galaxies a () range of from their band analysis. Although we find a range of (model A, band) which implies on average a somewhat younger stellar population, the results are consistent. R03 conclude that the evolution rates they measure favor old stellar populations for the lens galaxies with a mean formation redshift at a confidence level. We find a lower confidence limit of .
To test the hypothesis whether the evolution of the lens galaxies can be fitted with a single burst model, we calculate the reduced . We also compare the measured scatter around the fit with the expected scatter from the uncertainties in the ratios of the lens galaxies. If we allow more freedom in the single burst models, the fit improves (lower reduced ) and the measured scatter decreases. However, even the over-all best-fit single burst model is rejected with confidence and the measured scatter of and in and band is significant higher than the expected scatter of from the observational errors. To establish whether the additional scatter is due to a significant spread in ages among field galaxies, we study in the next Section the (restframe) colors of the lens galaxies, and investigate if there is also a significant scatter in the color and if it is correlated with the scatter in their ratios.
6 Colors
If the stellar populations of lens galaxies are on average younger than those of cluster galaxies (Section 5) we expect their colors to evolve more rapidly and to be on average bluer than those of cluster galaxies. For single burst stellar populations the color evolves as
| (7) |
with (Worthey 1994) and a normalization constant.


The left panel of Fig. 4 shows the restframe colors of the lens galaxies versus redshift. For the lens galaxies with open circles, a modest extrapolation was required in the transformation to either the restframe or band. The red outlier (at ) is the lens BRI0952-0115, for which the observed (F675W-F160W) color is significantly redder than the modeled E/S0 color, and for which we had to extrapolate in the transformation to restframe band. The single burst evolution of a stellar population formed at the mean cluster formation epoch of (maximum progenitor bias), is drawn (solid line) through the averaged color of the coma cluster galaxies (small dot). A decline in the colors of the lens galaxies with increasing redshift is visible, in spite of the large scatter. If we fit single burst models as in Section 5 (model A and B), we find on average a younger stellar formation epoch for the lens galaxies, but the difference with the cluster galaxies is never significant. In case the stellar populations of field and cluster galaxies are assumed to evolve in the same way (model B), the evolution model with the best-fit stellar formation redshift of is shown in the left panel of Fig. 4 (dashed line). Similarly as for the single burst model fits to the evolution, the fits to the color evolution are rejected with confidence, and the measured scatter is in all cases significantly higher than the expected scatter from the observational errors in the restframe colors of the lens galaxies.
To further investigate the scatter in color, we subtract the predicted colors of cluster galaxies with , from the restframe colors of the lens galaxies. Note that this choice of formation redshift corresponds to the minimum age difference between field and cluster galaxies. In the right panel of Fig. 4 we show the resulting residual colors plotted against velocity dispersion, with a linear fit to the Coma cluster galaxies. The lens galaxies show a large spread in their reduced colors, and are on average bluer by mag than the cluster galaxies. The bluer average color is qualitatively consistent with the on average younger ages of lens galaxies derived from the single burst model fits above and from the fits to the evolution (Section 5.4). For the total sample of 26 lens galaxies, we measure a scatter in the residual colors of , that is significant higher than the expected scatter of . From the left panel of Fig. 4, we observe that the color scatter increases beyond . For the 15 lens galaxies with we measure a scatter of , whereas for the lens galaxies with the measured scatter is only and nearly identical to the expected scatter of from the errors in the colors of these galaxies.

The additional measured scatter in the residual colors of the lens galaxies may indicate a significant spread in the ages of the stellar populations of the lens galaxies. We test whether the color spread is caused by a spread in ages or other effects, by investigating whether the residual colors correlate with the residual ratios. In Fig. 5 we plot the color of the lens galaxies against the logarithm of their ratio. For both quantities the expected evolution of a stellar population formed at was subtracted; hence a galaxy with the average color and ratio of galaxies in Coma would be located at the origin. From Eq. (7) and (5) it follows that a linear relation is expected in Fig. 5, with a (time-independent) slope of (solid line). The data appear to be correlated in the expected sense, albeit with large scatter. To test whether the correlation is significant we used the Spearman’s rank-order correlation coefficient . We find that , so that with lenses, we can reject the hypothesis that the two quantities are uncorrelated with confidence. The only viable explanation for the correlation is age variation. If the correlation would be caused by metallicity variations, (some) field galaxies would be much less metal rich than cluster galaxies, opposite to the result by Kuntschner et al. (2002).
The colors and ratios of the bluest lens galaxies are best fitted with stellar formation redshifts as low as . About half the lens galaxies are consistent with an old cluster-like stellar population with stellar formation redshift . If galaxies form in a sequence of bursts, formation redshifts are indicative of the last prominent epoch of star formation. The galaxies can have older underlying stellar populations.
7 Summary and Conclusions
We studied the evolution of the ratios of lens galaxies in the restframe Johnson and Gunn bands. For an flat cosmology with and , we obtained an evolution rate of in restframe and in restframe . Due to differences in the determination of the FP parameters and the corresponding errors, the evolution rate obtained by R03 of is slightly slower but not significant different. Our results are consistent with determinations for field galaxies based on direct spectroscopic measurements of the velocity dispersions. For the band, van Dokkum et al. (2001) arrive at an evolution rate of , and Treu et al. (2002) find a value of . The weighted mean of these results and our result yields an evolution rate for field early-type galaxies of in the band. For cluster galaxies van Dokkum et al. (1998) and vDF01 find an evolution rate between and , for minimum and maximum progenitor bias respectively. The latter value is not significantly different from the average evolution rate for the field galaxies.
We further investigated the evolution in Section 5, where we related it to stellar population ages by fitting simple single burst models for a Salpeter (1955) IMF and Solar metallicity. The evolution of cluster galaxies is well approximated by a mean single burst formation redshift of , and after maximum progenitor bias correction (vDF01).
We first tested if these cluster models could fit the evolution of the lens galaxies. This is not the case, but the fits improve if there is a systematic offset between lens and cluster galaxies of in Such an offset could be caused by, e.g. metallicity variations, systematic differences in the velocity dispersions due to the different measurement techniques, or other effects. It is interesting to note that hierarchical models have predicted such a constant offset with redshift between cluster and field galaxies (see van Dokkum et al. 2001). However, similar to van Dokkum et al. (2001), we conclude that the observed offset is much smaller than the predicted offset of .
If we next allow the stellar formation redshift also to vary, we find for the best-fit single burst model that the offset is not significant from zero, together with a mean stellar formation epoch for the lens galaxies of in the band and in the band. This means that on average the stellar populations of the lens galaxies are younger, but the difference with the cluster galaxies is not significant. However, if we impose the constraint that galaxies of the same age have the same ratio irrespective of their environment, we find without correction for progenitor bias that the stellar populations of the lens galaxies are significant younger (10–15 at the present epoch) than those of the cluster galaxies. In the case of maximum progenitor bias the average difference () is not anymore significant.
From their analysis R03 obtain a () lower limit for the mean stellar formation epoch of lens galaxies of , whereas we find that lower stellar formation redshifts are allowed, with as a lower limit. Nevertheless, these results disagree with the prediction of semi-analytical hierarchical galaxy formation models (e.g. Kauffmann 1996; Kauffmann & Charlot 1998; Diaferio et al. 2001) that early-type field galaxies in general have very late star formation with .
Whereas the evolution of cluster galaxies is well approximated by a single burst evolution model, we found that this is not the case for the lens galaxies. All single burst models are rejected with based on the reduced , and the measured scatter is in all cases significant higher than the expected scatter from the observational errors. The additional scatter is most likely caused by differences in the stellar population of the lens galaxies.
To investigate whether there is a significant spread in ages, we studied in Section 6 the restframe colors of the lens galaxies and their evolution. The colors of the lens galaxies are on average bluer than those of the cluster galaxies, consistent with on a younger average stellar population. We found that the measured scatter in the single burst fits to the colors is much larger than the expected scatter from the observational errors. Moreover, we showed that there is a significant correlation between the colors and the ratios of the lens galaxies. We interpret this as evidence for a significant spread in the stellar population ages of the lens galaxies.
Whereas about half of the lens galaxies are consistent with old cluster-like stellar populations, the bluest galaxies are best fit by single burst models with young stellar formation redshifts . For the seven blue lens galaxies with residual colors below mag in the right panel of Fig. 4, we found (as a byproduct of our transformation to restframe band) that only two of them are best fitted by the E/S0 spectral type, i.e. , whereas for the total sample we found . For the band even six of the seven blue galaxies are best fitted by the Scd spectral type, instead of the ES/0 spectral type. Three of the seven blue galaxies indeed show (some) deviations from early-type morphology. FBQ0951+2635 is an edge-on disk galaxy, SBS1520+530 is slightly irregular and B1608+656 is an apparently dusty galaxy with star forming regions. However, a homogeneous sample of quasar subtracted (NICMOS) images of the lens galaxies is needed to do a more detailed and systematic study of their morphologies. Such a study will be valuable to determine the cause of apparently younger populations in a fraction of the lens galaxies.
acknowledgments
We thank the anonymous referee for constructive and detailed comments, which improved the paper significantly.
References
- [1] Beers, T. C. and Flynn, K. and Gebhardt, K., 1990, AJ, 100, 32
- [2] Bender R., Saglia R. P., Ziegler B., Belloni P., Greggio L., Hopp U., Bruzual G., 1998, ApJ, 493, 529
- [3] Bessell M. S., 1990, PASP, 102, 1181
- [4] Binney J., Tremaine S., 1987, Galactic Dynamics. Princeton, NJ, Princeton University Press
- [5] Cardelli J. A., Clayton G. C., Mathis J. S., 1989, ApJ, 345, 245
- [6] Coleman G. D., Wu C. ., Weedman D. W., 1980, ApJS, 43, 393
- [7] Diaferio A., Kauffmann G., Balogh M. L., White S. D. M., Schade D., Ellingson E., 2001, MNRAS, 323, 999
- [8] Djorgovski S., Davis M., 1987, ApJ, 313, 59
- [9] Dressler A., Lynden-Bell D., Burstein D., Davies R. L., Faber S. M., Terlevich R., Wegner G., 1987, ApJ, 313, 42
- [10] Dressler A., et al. 1997, ApJ, 490, 577
- [11] Faber S. M., Dressler A., Davies R. L., Burstein D., Lynden-Bell D., Terlevich R., Wegner G., 1987, Nearly Normal Galaxies. Springer, New York, p. 175
- [12] Falco E. E., Shapiro I. I., Moustakas L. A., Davis M., 1997, ApJ, 484, 70
- [13] Foltz C. B., Hewett P. C., Webster R. L., Lewis G. F., 1992, ApJ, 386, L43
- [14] Frei Z., Gunn J. E., 1994, AJ, 108, 1476
- [15] Hernquist L., 1990, ApJ, 356, 359
- [16] Hogg, D. W., 2000, astro-ph/9905116
- [17] Im M., Simard L., Faber S. M., Koo D. C., Gebhardt K., Willmer C. N. A., Phillips A., Illingworth G., Vogt N. P., Sarajedini V. L., 2002, ApJ, 571, 136
- [18] Jørgensen I., Franx M., Kjærgaard P., 1995a, MNRAS, 273, 1097
- [19] Jørgensen I., Franx M., Kjærgaard P., 1995b, MNRAS, 276, 1341
- [20] Jørgensen I., Franx M., Kjærgaard P., 1996, MNRAS, 280, 167
- [21] Kauffmann G., 1996, MNRAS, 281, 487
- [22] Kauffmann G., Charlot S., 1998, MNRAS, 294, 705
- [23] Kelson D. D., van Dokkum P. G., Franx M., Illingworth G. D., Fabricant D., 1997, ApJl, 478, L13
- [24] Kochanek C. S., 1994, ApJ, 436, 56
- [25] Kochanek C. S., 1996, ApJ, 466, 638
- [26] Kochanek C. S., Falco E. E., Impey C. D., Lehár J., McLeod B. A., Rix H. ., Keeton C. R., Muñoz J. A., Peng C. Y., 2000, ApJ, 543, 131 [K00]
- [27] Koopmans L. V. E., Treu T., 2002, ApJl, 568, L5
- [28] Koopmans L. V. E., Treu T., 2003, ApJ, 583, 606
- [29] Kuntschner H., Smith R. J., Colless M., Davies R. L., Kaldare R., Vazdekis, A., 2002, MNRAS, 337, 172
- [30] Lehár J., Cooke A. J., Lawrence C. R., Silber A. D., Langston, G. I., 1996, AJ, 111, 1812
- [31] Lehár J., et al. 2000, ApJ, 536, 584
- [32] Lilly S. J., Tresse L., Hammer F., Crampton D., Le Fevre O., 1995, ApJ, 455, 108
- [33] O’Donnell J. E., 1994, ApJ, 422, 158
- [34] Ohyama Y., et al. 2002, AJ, 123, 2903
- [35] Press W. H., Teukolsky S. A., Vettering W. T., Flannery B. P., 1992, Numerical Recipes. Cambridge Univ. Press, Cambridge
- [36] Rhee G., 1991, Nature, 350, 211
- [37] Rusin D., Kochanek, C. S., Falco E. E., Keeton C. R., McLeod B. A., Impey C. D., Lehár J., Munoz J. A., Peng C. Y., Rix H.-W., 2003, ApJ, accepted
- [38] Salpeter E. E., 1955, ApJ, 121, 161
- [39] Schade D., Lilly S. J., Crampton D., Ellis R. S., Le Fèvre O., Hammer F. ., Brinchmann J., Abraham R., Colless M., Glazebrook K., Tresse L., Broadhurst T., 1999, ApJ, 525, 31
- [40] Schlegel D. J., Finkbeiner D. P., Davis M., 1998, ApJ, 500, 525
- [41] Thuan T. X., Gunn J. E., 1976, PASP, 88, 543
- [42] Tinsley B. M., Gunn J. E., 1976, ApJ, 206, 525
- [43] Tonry J. L., 1998, AJ, 115, 1
- [44] Tonry J. L., Franx M., 1999, ApJ, 515, 512
- [45] Treu T., Stiavelli M., Bertin G., Casertano S., Møller P., 2001, MNRAS, 326, 237
- [46] Treu T., Stiavelli M., Casertano S., Møller P., Bertin G., 1999, MNRAS, 308, 1037
- [47] Treu T., Stiavelli M., Casertano S., Møller P., Bertin G., 2002, ApJl, 564, L13
- [48] Tully R. B., Fisher J. R., 1977, A&A, 54, 661
- [49] van Dokkum P. G., Franx M., 1996, MNRAS, 281, 985
- [50] van Dokkum P. G., Franx M., 2001, ApJ, 553, 90 [vDF01]
- [51] van Dokkum P. G., Franx M., Kelson D. D., Illingworth G. D., 1998, ApJl, 504, L17
- [52] van Dokkum P. G., Franx M., Kelson D. D., Illingworth G. D., 2001, ApJl, 553, L39
- [53] Worthey G., 1994, ApJS, 95, 107