Properties of tangential and radial angles of muons in EAS ††thanks: Presented at XIIth ISHVECRI, CERN 2002
Abstract
Tangential and radial angles of muons in EAS, a useful concept in investigation of the muon production height, can be used also for the investigation of the muon momenta. A parameter , being a combination of tangential and radial angles, is introduced and its possible applications in investigation of muons in showers are presented.
1 Introduction
EAS experiments, combining field detector arrays - being capable in measuring the shower direction - with muon tracking detectors, can be used for determination of the mean muon production height (MPH), a parameter sensitive to the primary mass. Muon tracks in air shower are, in general, not coplanar with the shower axis, which have led to the concept of tangential and radial angles [1]. However, as it will be shown in the following, these two independent observables may provide a possibility to investigate the muon momentum components in showers. A good example of the EAS experiment, where the ideas presented in this paper can be used is KASCADE [2] with its recently introduced large Muon Tracking Detector [3]. We are using data simulated with CORSIKA [4] ver.5.644 and QGSJet hadronic interaction model for all discussions and examples given below.
2 Tangential and radial angles
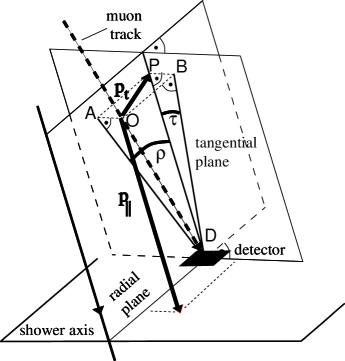
As it is shown in Fig. 1, shower direction and the location of the muon detector define two perpendicular planes: tangential and radial ones.
Tangential angle and radial angle are angles between the shower direction and the orthogonal projections of the muon track onto the tangential and radial planes, respectively.
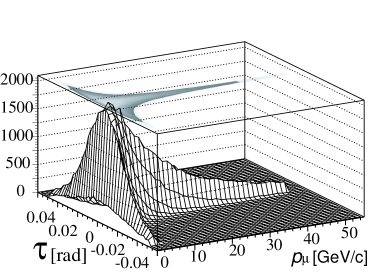
The measured value of reflects the amount of muon scattering in the atmosphere and any relevant absorber/detector material, together with a possible displacement of the muon production place from the shower axis. Its distribution (Fig. 2) is symmetrical around zero and gets narrower with the increase of the muon momentum, what one could expect from the quantity related to the multiple scattering.
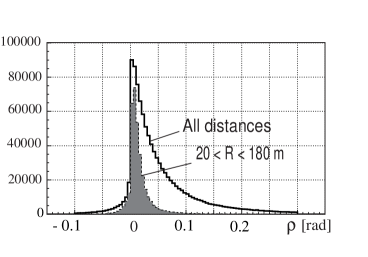
A typical distribution of the radial angle is shown in Fig. 3. Its value depends on the muon parent’s (meson’s) transverse momentum and the distance of the muon to the shower axis at the observation level. In real experimental conditions muons are sampled within certain range of distances from the core. The shaded distribution is shown for a typical distance 20 m - 180 m from the core. The large values are removed.
3 Parameter
As it is seen from Fig. 1, using simple trigonometry and substituting tangent for an angle, what is correct within 5 error up to , one can write the following expressions for and :
Let us define the new parameter as follows:
;
which is valid for 0.4 rad, and 0.4 rad.
So, measuring in an experiment angles of a shower and of muons and calculating and , by means of one gets the possibility to investigate the muon momentum space. The precision of depends on the precision of angular measurements in the air shower, and, in particular, on the precision of muon tracking. It is known, that the tracking accuracy improves when the high energy muons only are considered. Therefore, one would like to have as large content of high energy muons in the analyzed data sample as possible.
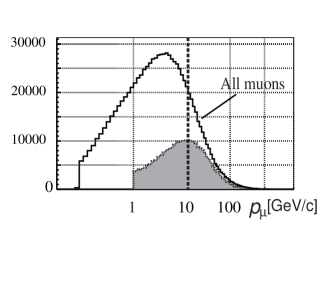
A typical muon momentum distribution in showers initiated by proton primaries with = eV is shown in Fig. 4. In all simulated showers (solid line) are muons with momentum larger than 10 GeV/c. In real experimental conditions, where a threshold, eg. 1 GeV/c, is present and muons are registered in a restricted range of distances to the shower core, one gets the shaded distribution in Fig. 4. In this sample, with significantly reduced statistics, there is already 45 of muons with 10 GeV/c. However, one would like to increase high energy muon content in the data sample even more, and for this purpose the parameter can be used.
Indeed, as seen from Fig. 5, shows strong dependence on the muon momentum. While at low momenta the full spread of values is observed, its distribution becomes more confined to the low values with the increase of the muon momentum.
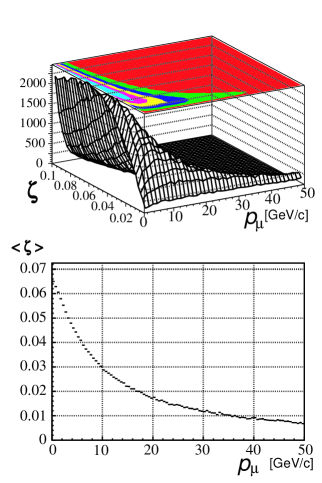
The mean value of decreases with momentum exponentially, what is shown in the lower panel of Fig. 5. So, it is possible to use in the analysis the cut on the value and, in this way, to increase the high energy muon content in the analyzed sample.
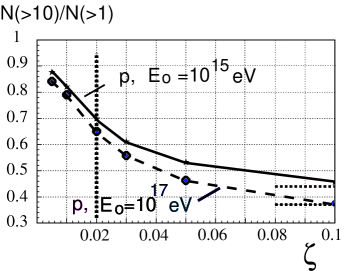
In Fig. 6 the ratio of muons with momentum larger than 10 GeV/c to all muons in a sample (above the threshold of 1 GeV/c) as a function of the applied cut on value is plotted for two primary proton energies. Only muons in the distance between 20 and 180 m to the shower core were considered. It is seen that choosing for the analysis muons e.g. with 0.02 results in significant increase of the high energy muon content in the data sample.
Another application of the parameter is rather straightforward. Its value is nothing else but a tangent of the muon angle versus the shower axis. So, knowing the distance to the shower core a simple triangulation allows to reproduce the muon production height. It is, off course, assumed that muons stem from the shower axis, what is generally not true. But, it turns out, that such approximation works well.
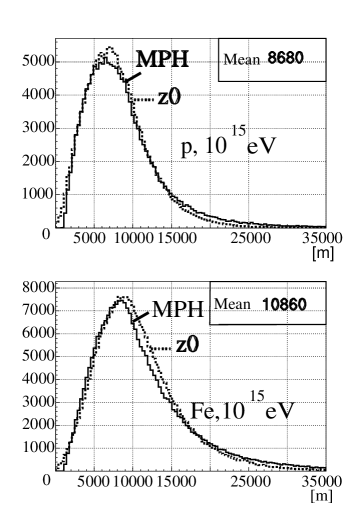
In Fig. 7 the true muon production height distributions () are compared with the calculated ones (MPH), using the just mentionned procedure, for two primary species, H and Fe with energy = eV. In these calculations a cut on 0.02 was applied. One sees a good agreement of both curves. The mean production height values are separated by more than 2 kilometers for proton and iron. So, one can use this procedure of calculating mean muon production height for the primary mass determination.
Parameter can be used for investigation of muon rapidities in showers. Substituting momentum for the total energy, which is allowed above 1 GeV without signifcant error, one can express rapidity and pseudorapidity using parameter as follows:
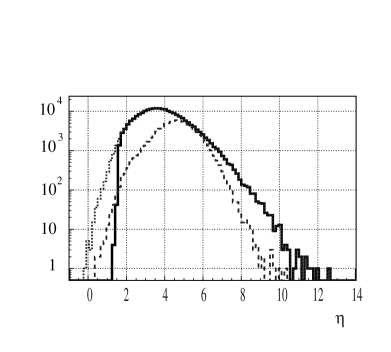
As an example in Fig. 8 pseudorapidiy distribution of muons in showers initiated by proton primary with the energy = eV is shown. Only muons with momentum larger than 1 GeV/c are considered. Dotted line shows all pseudorapidity values for all simulated muons. Solid line corresponds to the case, where can be calculated using parameter , i.e. for muons with absolute values of and less than 0.4 radian. Dashed line corresponds to the case, where the distance of muons to the shower core is in the range of 20 - 180 m. The large values, being the most interesting ones, are cut away due to 20 m minimum distance, so it is important to come with measurements as close to the core as possible.
The above example shows, that by means of it is possible to investigate rapidities of muons in showers. In general, measuring directional parameters of muons in showers by means of the parameter one can investigate muon momentum space.
The authors acknowledge very much support for this work obtained from Polish State Committee for Scientific Research (grant No. 5 P03B 133 20) and from the German Federal Ministry of Research (05 CU1VK1/9, WTZ POL 99/005).
References
- [1] K. Bernlöhr, Astropart. Phys. 5 (1996) 139.
- [2] H.O. Klages et al.-KASCADE collaboration, Nucl. Phys. B (Proc. Suppl.) 52B (1997) 92.
- [3] P. Doll et al., Nucl. Instr. and Meth. A488 (2002) 517.
- [4] D. Heck et al., FZKA report 6019, Forschungszentrum Karlsruhe (1998).