01 \Year2003 \Month1 \Pagespan14 \lhead[0]X. Barcons et al: The XMM-Newton SSC MS \rhead[Astron. Nachr./AN XXX (200X) X]0 \headnoteAstron. Nachr./AN 32X (200X) X, XXX–XXX
The XMM–Newton Survey Science Centre Medium Sensitivity Survey††thanks: Based partly on observations obtained with XMM-Newton, an ESA science mission with instruments and contributions directly funded by ESA member states and the USA (NASA)
Abstract
We present preliminary results on the XMM-Newton Survey Science Centre medium sensitivity survey, with 0.5-4.5 keV flux limit . At present, 19 fields have been examined with a total of 239 X-ray sources. Identifications for about 2/3 of these reveal that type 1 AGN dominate, but type 2 AGN, absorption-line galaxies and clusters as well as stars are also present. We also discuss on a few X-ray selected Broad-Absorption-Line QSOs found in this survey
keywords:
Sources as a function of wavelength: x-rays; galaxies: activebarcons@ifca.unican.es
1 Introduction
After more than 2 years of scientific operations, XMM-Newton is building up smoothly an unsurpassed serendipitous sky survey of X-ray sources at an approximate rate of 50,000 new sources per year. The XMM-Newton Survey Science Centre is conducting various activities to characterise and, eventually, fully exploit the content of this survey (Watson et al 2001). This will be achieved via an imaging programme, whereby many XMM-Newton target fields are being imaged in the optical (often in multiple bands) and near-infrared, and a core programme where large samples of carefully selected X-ray sources are fully identified via archival searches and optical spectroscopy.
This paper presents the current status of the XMM SSC Medium Survey (XMS) at high galactic latitudes. The XMS has the goal of characterising the 0.5-4.5 keV X-ray selected source population down to a source density of , which corresponds to a flux limit of . A first compilation of 29 X-ray sources in two XMM-Newton fields has been presented in Barcons et al (2002). The XMS will bridge the gap between the deep surveys (e.g., Hasinger et al 2001), aimed at exploiting the most distant Universe, and the shallower bright sample (Della Ceca et al 2002) which is meant to characterise the local and high luminosity X-ray source populations.
2 The XMM-Newton SSC Medium Survey (XMS)
The XMS is being built by using EPIC pn images of XMM-Newton observations fulfilling a number of criteria: galactic latitude , good-time-intervals exceeding ks (typically ks), no bright () stars in the field and moderate Galactic column density (). We used XMM-Newton data where the corresponding PI had granted access to the Survey Science Centre to exploit the serendipitous content of the fields. The targets of the observations have been obviously excluded, together with a region around them (that depending on the brightness and/or extension of the X-ray target).
The data had been processed by the Survey Science Centre pipeline with SAS version 5.2. We plan to update the current source lists with the more reliable SAS version 5.3.3 processed data products, but this will happen not earlier than the beginning of 2003. That new version of the source lists should have better calibrated source fluxes and improved positions.
At present we have only included fields visible from the Observatorio del Roque de Los Muchachos in the island of La Palma (Spain), where all the spectroscopic identifications have been obtained. There is an on-going complementary effort in the South that will ultimately double the size of this sample.
In the present paper we discuss a sample of X-ray sources found in 19 XMM-Newton EPIC pn fields. All XMM-Newton observations, except for those referring to one particular field, are now public. The EPIC pn source lists were searched for sources having a flux in the 0.5-4.5 keV band, as obtained from the sum of the 0.5-2 and 2-4.5 keV standard subbands, exceeding . Given the rather long exposure times, the likelihood associated to these sources is in most cases significantly larger than the overall limit imposed to the standard 5-band search of 16 (see, e.g., Barcons et al 2002 for details). The sample contains a total of 239 sources, covering approximately of sky, with a source density of .
3 Optical observations
All but one of the 19 XMM-Newton fields were imaged with the Wide Field Camera (WFC) on the INT on the island of La Palma in various filters. The remaining field is part of the Subaru deep survey and was imaged by the Subaru telescope. For the 18 fields observed with the INT, 16 were imaged in the 4 filters g’(SDSS), r’(SDSS), i’(SDSS) and Z (Gunn), one with r’ and i’ and one with i’ only. The depth of the optical images varied slightly as sky conditions were different, but on average the i’-band image had a limiting magnitude . Images were astrometrically calibrated against the USNO A.2 catalogue, with residuals , and photometrically calibrated to zeroth order using nightly average extinction constants and observations of standard stars. Calibrated optical images for a large number of XMM-Newton fields can be downloaded from the XMM-Newton SSC site (http://xmmssc-www.star.le.ac.uk) and will ultimately enter the XMM-Newton Science Archive maintained by ESA.
We used either the i’-band or the r’-band images to search for candidate counterparts around each X-ray source. The algorithm searched within 5 standard deviations in the statistical positioning error of XMM-Newton (typically 1 arcsec error) or 5 arcsec, whichever is larger. This last criterion was included in order to account for any residual systematics in the XMM-Newton attitude orbit control system astrometric solution of the X-ray data. With the newer SAS version 5.3.3 processed data products, the astrometry of the source lists is automatically corrected via a cross-correlation with a number of catalogues, resulting in very small residual systematics ().
The majority of the XMS sources had a single optical candidate counterpart in the optical images. A few of them had more than one and about 11% showed either faint (i.e. close to our detection limit of ) or no candidate counterpart within our sensitivity limits. It is still possible that a few of these sources are not real X-ray sources, but this will have to await to the new SAS 5.3.3 source lists to be confirmed.
Optical candidates were spectroscopically observed within the AXIS111For more information on AXIS (An XMM-Newton International Survey), visit our page http://www.ifca.unican.es/~xray/AXIS programme at La Palma. AXIS is an international time programme which was granted a total of 85 telescope nights spread over April 2000 - April 2002 distributed in the 4 major telescopes at the Observatorio del Roque de Los Muchachos: the Isaac Newton Telescope (2.5m, used for imaging), the Nordic Optical Telescope (2.6m, used for long-slit spectroscopy), the Telescopio Nazionale Galileo (3.5m, used mostly for long-slit spectroscopy) and the William Harschel Telescope (4.2m, used for both fibre and long-slit spectroscopy).
4 Identifications
Out of the 239 X-ray sources in the sample, we have successfully identified 134 (56%) and a further 25 (10%) are identified with some residual uncertainty. These uncertainties typically refer to the redshift of the source which in some cases, particularly in those observed with the fibre spectrograph which had shorter wavelength coverage (Å), was drawn from one emission line only. As previously said a further 27 sources (11%) had either very faint (barely visible) or no optical counterpart down to magnitude . There is a final lot of 53 sources (22%) which have not been spectroscopically observed or whose optical spectra are of poor quality. A significant fraction of these (about 1/3) are too faint for spectroscopic identification in 4m-class telescopes and will therefore require 8-10m class telescope observations.
| Source class | Number | % of ids. |
|---|---|---|
| BLAGN | 110 | 69.2 |
| NELG | 21 | 13.2 |
| Stars | 18 | 11.3 |
| Galaxies & Clusters | 9 | 5.7 |
| BL Lacs | 1 | 0.6 |
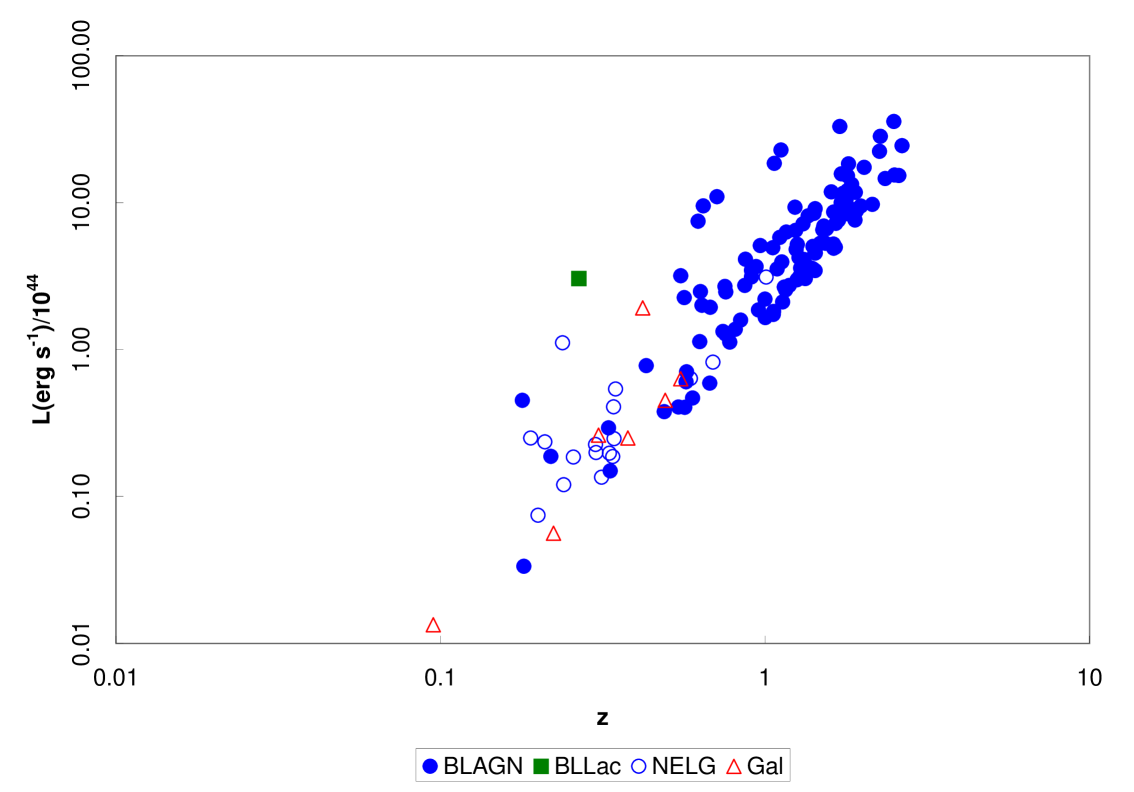
The breakdown of identified sources is presented in table 1. At a variance with other surveys, here we use a purely optical classification scheme: Broad-line Active Galactic Nuclei (BLAGN), Narrow Emission Line Galaxies (NELG), Galaxies and Clusters for those not showing any emission lines (as some of the absorption-line galaxies may lie in clusters unltimately responsible for most of the X-ray emission), Stars and BL Lacs.
Figure 1 presents the luminosity redshift diagram for the extragalactic identified sources. As it can be seen, all NELGs in this diagram have an X-ray luminosity in excess of and therefore there is no doubt they harbour an active nucleus. In a more physical scheme, they would be classified as narrow-line AGNs.
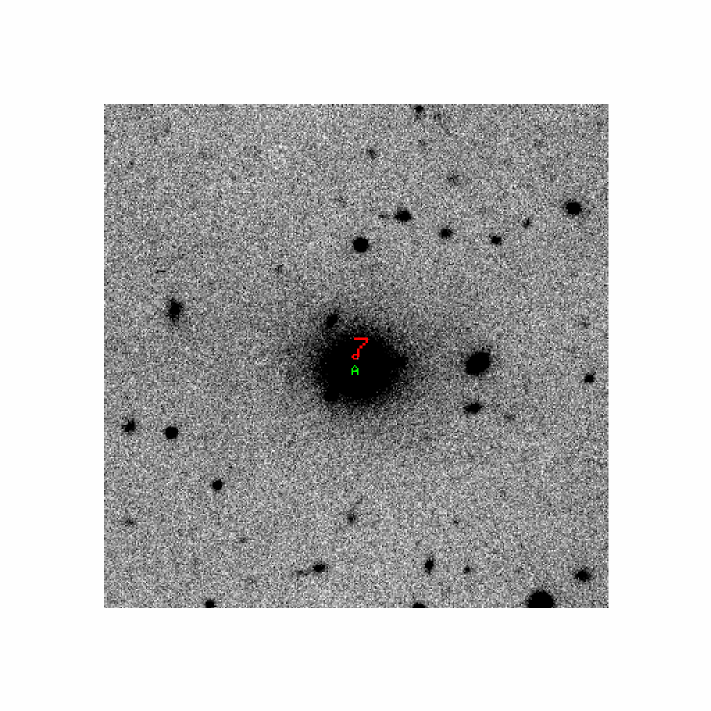
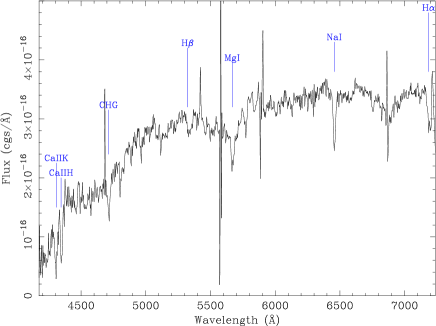
Our survey also finds a number of X-ray sources which we identify as galaxies without emission lines. In most cases there is real evidence that these sources are directly associated with an optically dull galaxy. One of such cases is shown in figure 2. This is a galaxy at z=0.095 with a 0.5-4.5 keV luminosity of , i.e., some sort of AGN must be present in that galaxy to give rise to such a high luminosity, although there is no hint of optical emission lines. The nature of such sources are discussed in Severgnini et al (2002). We must caution, however, that other cases where the putative identification of the X-ray source is an optically dull galaxy, might actually correspond to a group or cluster of galaxies. Careful inspection of both the optical images and the possible extent of the X-ray sources is then necessary.
5 The AGN distribution
Synthesis models of the X-ray background based on the AGN unified scheme, make specific predictions for the redshift and absorption column distribution of AGN. We show in fig. 3 the expected redshift distribution in the Comastri et al (1995) model, as drawn from a simulation.
Similar numbers of absorbed and unabsorbed objects should be found at a flux level . Also, the redshift distributions for both absorbed and unabsorbed AGN are expected to be similar in this model. Indeed both of these predictions depend critically on the assumptions of the XRB model and in fact they would be different in, e.g., the Gilli, Salvati & Hasinger (2001) model, in the sense that more absorbed AGN should be found at high redshifts.
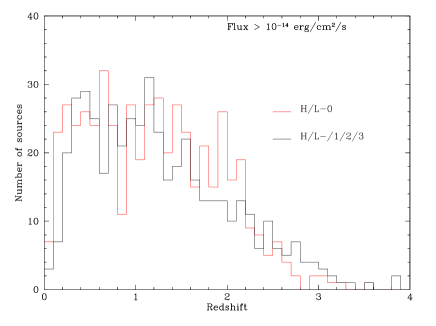
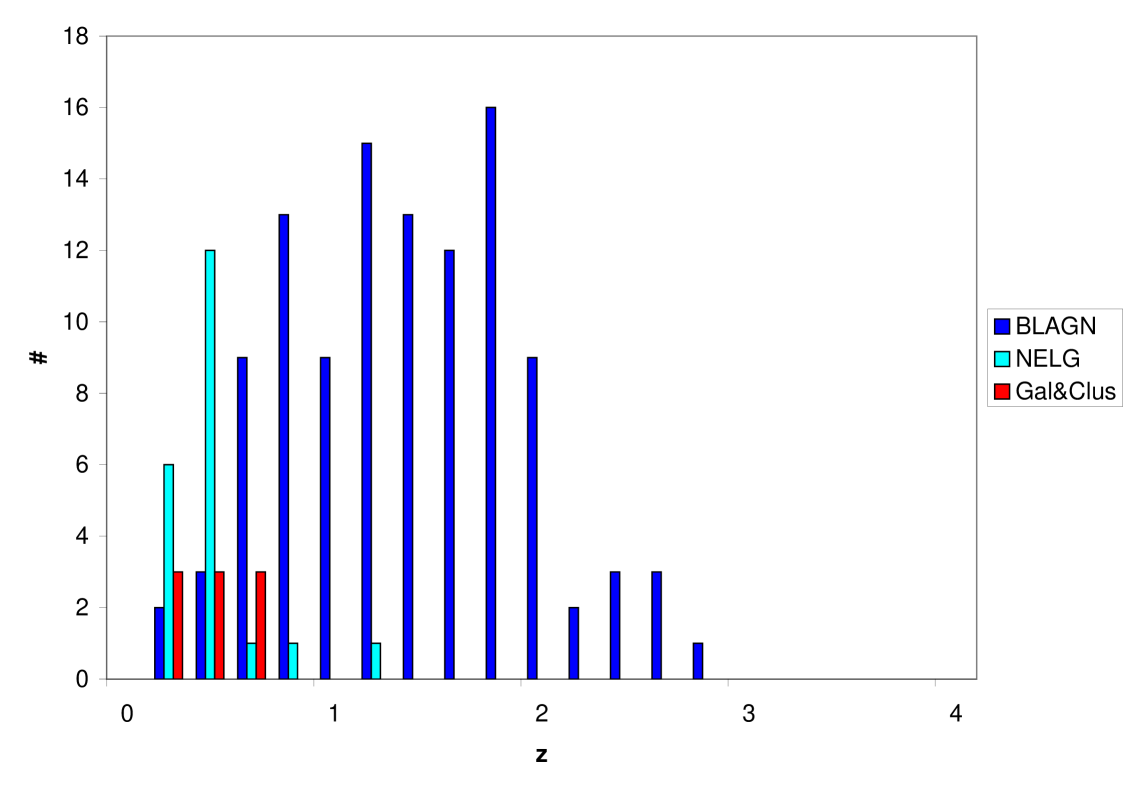
For comparison, figure 4 shows the redshift distribution for the various classes of extragalactic objects of the sources identified so far in this survey. If we add all of them (or even adding the broad-line and narrow-line AGN), we find rough agreement between the observed and predicted redshift distributions of the Comastri et al (1995) model. The problem arises if the usual identification of X-ray unabsorbed with type 1 and X-ray absorbed with type 2 X-ray to optical link is assumed. Clearly type 2 AGN are much more concentrated at low redshift than type 1 AGN. This appears to be a feature of even the deepest X-ray surveys, and therefore it presents an important challenge to the XRB synthesis models. Possible ways to understand this mismatch include
-
•
Type 1 and type 2 AGN are truly independent populations with unrelated evolution stories. Along these lines Franceschini, Braito & Fadda (2002) propose that type 1 AGN at high redshifts form at the highest and rarest peaks of the density field in the Universe, while type 2 AGN are more closely related to the assembly of large galaxies at , and are therefore more related to star formation.
-
•
The XRB synthesis models make assumptions about the X-ray absorption of AGNs, not about optical spectral types. There is a wealth of evidence for discordant cases in the literature, including X-ray absorbed type 1 AGNs and X-ray unabsorbed type 2 AGNs. Mateos et al (2003) discuss the possibility that type 1 AGN at high z are absorbed in the X-ray domain.
6 Broad Absorption Line QSOs
Four Broad Absorption Line QSOs have been found so far in our X-ray selected survey, one of them below the flux threshold (see table 2). Such objects have been so far extremely rare in X-ray surveys (Green & Mathur 1996), the likely explanation being that the BAL gas absorbs X-rays in such a way that the X-ray flux decreases significantly. Indeed, 4 out of 110 appears to be less than the expected fraction of BAL QSOs in an optically selected sample (typically 10%), but in a representative number of cases we do not have enough wavelength coverage to detect BALs.
| BI | ||
|---|---|---|
| 1.820 | 3650 | |
| 1.919 | 580 | |
| 1.881 | 1620⋆ | |
| 2.000 | 1460 |
We must stress that all 4 BALs belong to the high ionisation class, as the absorption detected is in the CIV line. The Balnicity Index (Weymann et al 1991) measures the strength of the (CIV) absorption. Compared to the Weymann et al (1991) sample, it appears that the BI of these X-ray selected BAL QSOs is on the low to medium side. This, together with the possible high ionisation of the BAL, might explain why they are detected in X-rays.
7 Outlook
Pending completion of the identification of about 1/3 of the 239 X-ray sources in the XMS, the picture emerging at a source density of is that Broad-Line AGN dominate the content of the X-ray sky. The redshift distribution of these objects is very similar at that depth to that of deeper surveys (Lehmann et al 2001), which probably means that for studies of the bulk of the high-luminosity population of broad-line AGN there is no need to go much deeper. Narrow-line AGN appear only at much lower redshifts in this survey (which is also being found in the deepest surveys), meaning that the combination of XRB synthesis models plus a one-to-one correspondence of AGN X-ray absorption with optical spectral type, does not work. This highlights the need for re-thinking current popular interpretations of X-ray background models.
Acknowledgements.
This paper reports on work carried out in the framework of the XMM-Newton Survey Science Centre. We are grateful to our consortium colleagues and especially to those involved in the AXIS project. Partial financial support for this research was provided by the Spanish Ministry of Science and Technology under projects AYA2000-1690 (XM, FJC, MTC, SM) and PB98-0409-C02-01 (IPF).References
- [1] Barcons, X. et al : 2002, A&A 382, 522
- [2] Comastri, A., Setti, G., Zamorani, G., Hasinger, G.:1995, A&A 296, 1
- [3] Della Ceca, R. et al: 2002, in New visions of the X-ray Universe in the XMM-Newton and Chandra era, Jansen, F.A. ed, in the press.
- [4] Franceschini, A., Braito, V., Fadda, D.: 2002, MNRAS 335, L51
- [5] Gilli, R., Salvati, M., Hasinger, G.: 2001, A&A, 366, 407
- [6] Green, P.J., Mathur, S.: 1996, ApJ 462, 637
- [7] Hasinger, G. et al : 2001, A&A 365, L45
- [8] Lehmann, I. et al.: 2001, A&A 371, 833
- [9] Mateos, S. et al: 2003, AN
- [10] Severgnini, P. et al: 2002, in preparation
- [11] Watson, M.G. et al : 2001, A&A 365, L51
- [12] Weymann, R.J., Morris, S.L., Foltz, C.B., Hewett, P.C., 1991, ApJ 373, 23