Starburst galaxies and the X-ray background
Integrated X-ray spectra of an evolving population of starburst galaxies (SBGs) are determined based on the observed spectra of local SBGs. In addition to emission from hot gas and binary systems, our model SBG spectrum includes a nonthermal component from Compton scattering of relativistic electrons by the intense ambient far-IR and the (steeply evolving) CMB radiation fields. We use these integrated spectra to calculate the levels of contribution of SBGs to the cosmic X-ray background assuming that their density evolves as up to a maximal redshift of 5. We find that at energies keV this contribution is at a level of few percent for , and in the range of for . The Compton component is predicted to be the main SBG emission at high energies, and its relative contribution gets progressively higher for increasing redshift.
Key Words.:
Galaxies: X-ray – Galaxies: spiral – Galaxies: star formation – diffuse radiation1 Introduction
In starburst galaxies (SBGs) enhanced star formation activity (lasting typically yr) drives a chain of coupled stellar and interstellar phenomena that are manifested by intense far-infrared (FIR) emission. The SBG spectrum shows a distinctive large bump of thermal FIR dust emission which is correlated with optical emission (e.g., Silva et al. 1998), a result of the fact that dust emission is reprocessed starlight from a population of hot OB stars. Such stars are short-lived ( years) and end up as supernovae. The subsequent radio emission from synchrotron radiation in supernova remnants (SNRs) is tightly correlated with the IR emission (e.g., Condon 1992). Interest in SBGs stems also from the realization that these resemble young galaxies in the earlier universe. Indeed, a starburst phase was very common then, as a result of both astrophysical processes (baryonic infall and early star formation) and dynamical processes (close encounters and mergers which, in turn, trigger star formation). Consequently, the cosmic star formation rate (SFR) was substantially higher at epochs corresponding to , with the SFR having either a peak at (Madau et al. 1996), or a plateau out to (Thompson et al. 2001).
A primary manifestation of the starburst activity is X-ray emission. Given the greatly enhanced SFR, energetic phenomena related to stellar evolution – OB stars, X-ray binaries, SNRs, galactic winds, and Compton scattering of ambient FIR and CMB photons off relativistic electrons that are accelerated by SN shocks – clearly suggest that SBGs are typically more powerful X-ray emitters than normal galaxies of comparable stellar mass (e.g., Rephaeli et al. 1991; Schmitt et al. 1997). The mean X-ray spectrum of SBGs reflects the diverse nature of high energy activity in these galaxies (Persic & Rephaeli 2002; Rephaeli et al. 1991, 1995).
The link between SBGs and the cosmic X-ray background (CXB) was made early on (Bookbinder et al. 1980; Stewart et al. 1982; Weedman 1987; Griffiths & Padovani 1990; Rephaeli et al. 1991, 1995; David et al. 1982; Ricker & Meszaros 1993; Moran et al. 1999). Most previous estimates of the SBG contribution to the CXB were essentially based on the SBG emission at 2 keV, with either no source evolution (Weedman 1987), or with some assumed degree of evolution (Griffiths & Padovani 1990; Ricker & Meszaros 1993). Clearly, the use of the 2 keV emission as baseline is unjustified given the wide spectral range (3-100 keV) over which the CXB seems to have been well determined (e.g., Gruber et al. 1999). The SBG contribution was also evaluated based on the emission over a wider spectral range, either in the context of an assumed spectral model (Ricker & Meszaros 1993), or from a statistically deduced mean spectrum (determined from the HEAO-1 A2+A4 datasets: Rephaeli et al. 1991, 1995).
In this paper we compute the contribution of SBGs to the CXB incorporating recent results in the study of SBGs. In particular, we use the knowledge of SBG spectral properties gained from direct ASCA, BeppoSAX, and RXTE observations of local galaxies. This, complemented with an assumed form for the cosmic evolution of the SBG X-ray luminosity density, enables us to compute the component of the CXB spectrum which originates in SBGs. We first (section 2) review the spectral properties of (local) SBGs, and proceed to discuss the local SBG luminosity density and its cosmic evolution in sections 3 and 4. The predicted CXB spectrum is then calculated in section 5, followed by a discussion (section 6), and a summary (section 7). Our calculations are carried out in the context of the Einstein-de Sitter (, ; hereafter EdS) and (currently favoured) flat (, ) cosmological models, with km s-1 Mpc-1.
2 X-ray spectral properties of SBGs
Local SBGs have been repeatedly observed in X-rays (see Fabbiano 1989; Rephaeli et al. 1995; Dahlem et al. 1998; Persic & Rephaeli 2002; and references therein). In most of these () galaxies the 0.5-10 keV spectra can be well fit by a combination of thermal, low temperature keV emission, and photoelectrically self-absorbed emission that can be represented by an exponentially cutoff power law (CPL) of the form , where is the energy in the source frame, is the photon index and is the cutoff energy 111 Earlier spectral studies, in which simple thermal and PL models were fitted to the main emission component, concluded that 5 keV thermal or PL fits were similarly successful for all analyzed objects (NGC253, M82: Ptak et al. 1997, Cappi et al. 1999; M83: Okada et al. 1997; NGC1569: Della Ceca et al. 1996; NGC2146: Della Ceca et al. 1999; NGC2903: Mizuno et al. 1998; NGC3256: Moran et al. 1999; NGC3310, NGC3690: Zezas et al. 1998), and hence they were unable to reach definitive conclusions on the nature of the main component. (Persic & Rephaeli 2002, Persic et al. 2002; see Fig.1).
The low-temperature and CPL components can be interpreted as due to emission from galactic winds and X-ray binaries, respectively. From a detailed discussion of a synthetic X-ray spectrum of SBGs, based on an evolutionary model of galactic stellar populations and on the X-ray spectra of the relevant emission processes, Persic & Rephaeli (2002) have suggested that X-ray binaries contribute most of the 2-15 keV emission. Both types of X-ray binaries, high- and low-mass systems, have spectra that can be described as variously cutoff power laws (White et al. 1983; Christian & Swank 1997). In general, the population-averaged spectrum emitted by a realistic mix of X-ray binaries (high- and low-mass systems of various luminosities in Galactic proportions) can be described as a CPL with and keV (Persic & Rephaeli 2002).
The enhanced SFR activity in SBGs results in a high SN rate and consequently – among other effects – in a higher rate of electron acceleration to relativistic energies. This prospect, coupled with the higher energy density in the enhanced FIR radiation field, almost certainly implies that Compton scattering of the electrons by both the FIR and CMB fields yields a substantially higher level of nonthermal X-ray emission than in normal galaxies (Schaaf et al. 1989; Rephaeli et al. 1991). A quantitative assessment of this process in NGC253 was given by Goldshmidt & Rephaeli (1995). Substantial PL X-ray emission may also be produced in the galactic nucleus, especially if the SB-driven turbulence of the gas increases the mass inflow rate onto a central black hole (e.g., Veilleux 2001). Such spectral components can be described as with the photon index in the range over a broad energy range (e.g., Goldshmidt & Rephaeli 1995; Rothschild et al. 1983).
The spectral similarity shown by the local SBGs (see also Roberts et al. 2001) provides a reasonably good basis for a first approximation at modelling the population as a whole. We therefore assume that a typical starburst spectrum consists of a 0.8 keV thermal component [i.e., a bremsstrahlung spectrum, with the Gaunt factor numerically calculated as prescribed by Itoh et al. (2000)], plus a CPL with photon spectral index and cutoff energy keV. This second component is photoelectrically absorbed in situ through a HI gas of column density . The two components are normalized such that the thermal-to-CPL energy flux ratio in the 2-10 keV band is 0.03.
In addition to the wind and binary emission, we include also two emission components originating from Compton scattering of relativistic electrons by the FIR and CMB radiation fields. While the full calculation of the respective fluxes requires a detailed, self-consistent solution of the kinetic equation for the electrons (taking into account their varius energy loss mechanisms and their propagation mode in the disk and halo – see, e.g., Rephaeli 1979), we greatly simplify the treatment by keeping only the most salient features pertinent to our discussion here. Assuming the typical value of for the radio (spectral energy) index of the radio synchrotron flux in the disk, and estimating typical energy loss times of the electrons by synchrotron emission and Compton scattering off the FIR and CMB radiation fields, we can roughly represent the latter two Compton components as follows: A primarily inner-disk FIR-scattered component with a (photon) flux that is , and a (primarily) outer-disk and halo CMB-scattered component due to electrons from the higher-energy region of the (electron) spectrum that is steepened by radiative losses.
The relative contribution of the Compton fluxes is substantially uncertain since this emission has not yet been unequivocally detected in SBGs (see, e.g., Goldshmidt & Rephaeli 1995 and Rephaeli & Gruber 2002). However, the expectation that Compton scattering of the enhanced relativistic electron population by the intense ambient FIR radiation field provides strong motivation for inclusion of this emission in our modelling of SBG X-ray emission. Our modelling of the Compton fluxes is based on the radio properties of the nearby SBGs M82 and NGC253, and well known Compton-synchrotron relations (e.g., Tucker 1975) between the radio luminosity and deduced mean magnetic field in the disk (typically, G, but with appreciable uncertainty) and the predicted X-ray flux from Compton scattering of the radio producing electrons by the FIR and CMB fields. The relative strength of these two radiation fields largely determines (under typical conditions in local SBGs) the normalization between their respective fluxes. The energy density of the FIR radiation field, , was estimated by Goldshmidt & Rephaeli (1995) in the context of a quantitative model for the emission from warm dust. We adopt their result, where is the energy density in the CMB, as roughly typical in the inner region of a SBG disk. Doing so, and using the usual Compton-synchrotron relations, we obtain that in local SBGs we might expect that the FIR and CMB Compton contributions to the overall 2-10 keV (energy) flux are roughly at a level of and , respectively. We do not yet have unequivocal evidence for nonthermal Compton X-ray emission in SBGs. Power-law fits to both ASCA and RXTE data on M82 & NGC253 were found to be formally acceptable (e.g.: Matsumoto & Tsuru 1999; Rephaeli & Gruber 2002), but a closer assessment of the residuals of such fits over the wider energy range afforded by RXTE leads only to what are essentially upper limits to nonthermal contribution. With the higher spatial resolution of the Chandra satellite it was clearly established that some of the 2-10 keV emission in M82 is diffuse, emanating from a central elliptical region, 0.8 kpc 0.8 kpc, that is coplanar and coaligned with the galactic disk (Griffith et al. 2000). According to these authors the spectral fits to these measurements make a Compton origin of most of the emission quite likely. The luminosity of the extended emission region is erg s-1 (for an assumed distance Mpc); this value constitutes of the total 2-10 keV luminosity ( erg s-1) measured by BeppoSAX (Persic & Rephaeli 2002). Given that some or most of this diffuse hard component in M82 is thermal as suggested by the presence of a substantial 6.7 keV Fe-K emission, the figure of is actually a strong upper limit on the Compton contribution in M82. 222Also for NGC 3256 (the brightest among local SBGs), Compton scattering has been argued to contribute appreciably to the 2-10 keV flux (Moran et al. 1999).
Finally, let be the spectral profile (in the source frame), normalized in the band relative to which the surface brightness is being computed. In accord with our discussion above, the X-ray spectral profile of a SBG is a superposition of components that can be written as
where is the energy (in keV) in the source frame (and is the redshift; is the energy in the observer’s frame), is the cross section for photoelectric absorption per unit hydrogen column density within the source [in the calculations we have adopted the analytic expression for given by Morrison & McCammon (1983); is taken at a nominal level of cm-2], and , , and are constants of normalization that are estimated as described above. Note that the CMB scattered flux is -dependent, an important fact that will be elaborated upon in Section 5.


3 Local luminosity density
In order to calculate the contribution of SBGs to the CXB we need to model the population at all , beginning – of course – with the local source density which can be deduced from the FIR luminosity function. This has been determined from the 60m flux-limited IRAS samples (Saunders et al. 1990),
Sources in the IRAS Point Source Catalog with fluxes measured in all four IRAS bands and with individual, identifiable galaxy types inhabit distinct and well-defined areas in color-color diagrams (Rowan-Robinson & Crawford 1989). Each one of these distinct components of the IRAS point-source population largely produces most of the emission at specific wavelengths, and is characterized by a specific set of parameters for eq.(2). For the warm-source component that peaks at 60m which is thought to be attributable to a dusty SBG population, the parameters in eq.(2) take the values:
for luminosities in the range . Pearson & Rowan-Robinson (1996) modeled the (sub-mm, IR, optical) number-flux relation for extragalactic sources by including a SBG population described by a local luminosity function as in eq.(2). The local 60m luminosity density implied by eq.(2) is:
For a sample of local SBGs observed with ASCA, the ratio of 2-10 keV flux to 60m flux 333 The objects are: M82, NGC253, NGC2903, NGC3690. The 60m fluxes are calculated using the prescription , where is the nominal flux densities listed in the IRAS catalog (Lonsdale et al. 1985; see also Shapley et al. 2001). The 2-10 keV fluxes are from Ptak et al. 1997 (M82, NGC253), Mizuno et al. 1998 (NGC2903), Zezas et al. 1998 (NGC3690). is . Assuming this to be the mean value for the whole SBG population, we have for the 2-10 keV luminosity density
Note that in our previous estimates of the SBG contribution to the CXB (Rephaeli et al. 1991, 1995) we did consider only the high end () of the FIR luminosity function as representative of the SBG population. Adopting the current more inclusive luminosity function (Pearson & Rowan-Robinson 1996) allows a more realistic estimate that accounts also for the emission from fainter SBGs. By integrating the FIR luminosity function over the above (logarithmic) range ([6, 12.5]), we compute a density of Mpc-3 for galaxies that are identified here as members of the broader SBG population. (Obviously, this value of the density is much higher than that of the more luminous galaxies, but this difference is largely compensated for by the much lower mean FIR luminosity, , of the SBGs that we include in this work.)
4 Cosmic evolution
Galactic evolution may generally be reflected in density and luminosity variations over cosmic time due to the continued formation, interaction and merging, and through intrinsic changes of the luminosity due to dynamical and thermal evolution of stars and interstellar gas. The evolution of SBGs is likely to be particularly pronounced as the SB phase is thought to be triggered by galactic interactions and is relatively short lived. These imply that SBGs were more abundant at earlier times than would be expected based solely on pure density evolution of sources in an expanding background ().
Observationally, the evolution of SBGs is inferred from radio, IR, and optical measurements. At radio frequencies, two distinct populations are identified at 1.4 GHz (Benn et al. 1993): radio-loud, and radio-faint, the first consisting of giant ellipticals and QSOs, and the second mainly of spirals (SBGs and radio-quiet QSOs). This latter faint population is responsible for the low-flux upturn in the differential counts, and is indistinguishable from the SBG-dominated 60m population (e.g., Danese et al. 1987; Franceschini et al. 1988), which can be fit by a model using pure luminosity evolution of the form with (Rowan-Robinson et al. 1993). At IR wavelengths, Lonsdale et al. (1990) concluded that the dominant population in the faint 60m counts from the IRAS Faint Source Survey consists of strongly evolving SBGs. 444In ultra-luminous IR galaxies (ULIRGs), which are the high- tail of the ’warm’ 60m-selected IRAS population, the star-formation activity (Kim & Sanders 1998a) is very strong; these undergo cosmic evolution (Kim & Sanders 1998b) similar to the one derived for the whole 60m-selected SBG sample. In addition, a preliminary XMM-Newton study of a sample of ULIRG spectra (Franceschini et al. 2002) suggests properties fairly similar to those of SBG spectra: i.e., the ‘starburst signature’ discussed in section 2, plus sometimes a hard PL component (interpretetd as SB-obscured AGNs). ULIRGs are then implicitly included in the calculations reported in this paper. Thus, it appears that from 60m to radio wavelengths what is mainly sampled is starburst activity. SBG evolution, either of the pure luminosity type (Lilly et al. 1995; Ellis et al.1996; Fried et al. 2001), or of the pure density type (Lin et al. 1999), is deduced also from optical surveys.

The luminosity density of SBGs evolves mainly as result of their steeply varying density, and – to a smaller extent, as discussed below – the changes in the relative strength of the spectral components. Density evolution is represented by the factor , with after the process of galaxy formation began in ernest at some early redshift, . Since we do not know when exactly galaxies began forming, the modelling the starburst phase of early galaxies necessitates viewing both and as essentially free parameters. 555 As an example, we derive an evolution function of the type in eq.(5) within a toy model of galaxy evolution. The comoving number density of galaxies undergoing a starbursting phase at any given epoch , , is closely related to the total galaxy density at that time, . If so, we expect the comoving SBG fraction to increase steeply with . The interaction rate between galaxies is (with constant interaction cross section), where is the galaxy density, and is the rms pairwise velocity dispersion of interacting galaxies. Because of the strong dependence we can ignore the relatively weak dependence on . This implies that in a flat universe the volume density of SBGs at any given time is . We factor out the dominant redshift dependence of the luminosity density:
with all the spectral dependence on collected in the function ; this function will be specified below. The evolution of SBGs is then largely gauged by the index 666 Evidence for evolution of the galaxy luminosity density has been found also in other bands. Based on , B- and UV-selected galaxies, the deduced evolution rate has for an EdS cosmology and for a flat model (Wilson et al. 2002). Earlier work, based on , I-band selected galaxies, claimed (Lilly et al. 1996).; an estimate for is given in eq.(4).


5 SBG Emission as a Background
The surface brightness due to a population of unresolved sources is given by (e.g., Boldt 1987)
where is the comoving volume emissivity, and d is the line element. Since d is related to the look-back time and the redshift by d, we obtain
The ensuing spectral density is then given by
where is the energy measured in the observer frame and the energy measured in source rest frame.
The look-back time is related to the cosmic time by (with the present age of the universe), and is related to the redshift by
where , , , and are the current density parameters for radiation, matter, , and their sum, respectively. In the matter dominated era,
The SBG photon spectrum we have used in our calculations is given in eq.(1). Whereas the first two spectral components in eq.(1) have been adequately discussed in many previous works, the Compton CMB component needs to be further elaborated upon here because of its enhanced role in early SBGs. Most of the X-ray emission from a SBG is triggered by stellar activity and involves the internal properties of the galaxy during a starburst phase of its evolution. As such, the emission is largely independent of redshift, if the main characteristics of this phase have not changed over cosmic time. The Compton component of the emission has evolved significantly, however, due to the much higher energy density of the CMB at . As we have noted in section 2, in a local SBG the FIR energy density is typically much higher than that of the CMB, by as much as a factor of (Goldshmidt & Rephaeli 1995), so the Compton CMB component begins to dominate already at . This, and the fast evolving SBG density, result in a very steep combined spectral and density evolution of the emission from SBGs at high X-ray energies where Compton scattering is the main emission component in SBGs. Due to the steep dependence of the CMB energy density, has an explicit dependence on in addition to the implicit dependence through .
With , where is given in eq.(5) and is the SBG energy spectrum (source frame) normalized by the 2-10 keV flux, we have for the total intensity at an observed energy due to a population of SBGs undergoing cosmic evolution according to eq.(5) out to a maximal redshift
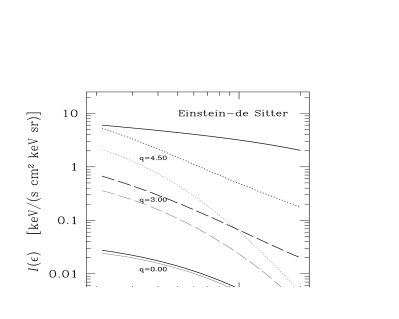
The integrated intensity from SBGs was calculated at (the source frame) energies = 2-120 keV, for values of the evolutionary index in the range , and adopting . In Fig.3 we show the integrated background light arising from an evolving population of SBGs as a function of the (observed) energy, . To determine the fractional contribution of SBGs to the CXB intensity in the 2-20 keV band, for the latter we use the analytic fit:
with measured in and measured in keV, given by Gruber et al. (1999) in the 3-60 keV band (based on HEAO-1/A2+A4 all-sky data: dominated by A2 proportional-counter data for keV, and by A4 scintillator-experiment data for keV) and shown by Gendreau et al. (1995) and Chen et al. (1997) to hold down to 1 keV (from ASCA data, based on a composite sample of the sky corresponding to less than a square degree and therefore limited by by sky surface brightness fluctuations). 777Although the spectral shape of the CXB is very well established, there is some question about the normalization, especially at keV. Under the assumption that Gruber et al.’s (1999) composite multi-experiment fit [which in the 3-50 keV band is very close to the spectrum implied by the HEAO-1/A2 data alone (Marshall et al. 1980; Boldt 1987)] is valid down to 1 keV, we note that the HEAO-1 spectrum is uniformly lower, by , than the PL fit to the ASCA/SIS spectrum, keV/(cm2 s keV sr) (Gendreau et al. 1995). Actually, the discrepancy could be even worse, were the HEAO-1/A2 result to be renormalized downwards to account for the fact that it includes relatively bright unresolved sources that would have been resolved by ASCA. In addition, the ROSAT observed CXB (at keV), though limited by surface brightness fluctuations estimated at (Miyaji et al. 1998), suggests a CXB normalization higher than that obtained from the HEAO-1/A2 result. Given this state of affairs, we assume that a smooth extrapolation of Gruber et al.’s (1999) HEAO-1-based formula down to 2 keV is safe enough for our current purposes. In Fig.4 we plot the SBG fractional contribution to the CXB as a function of (observed) energy.
Looking at Fig.3 we see that for energies keV the shape of the SBG background light gets progressively steeper than that of the CXB, for the range of values of considered here. (The steep rise of the Comptonized CMB contribution moderates the decline somewhat.) From Fig.4 it is seen that for no cosmic evolution () the contribution of SBGs to the CXB is at all energies; while for an evolution as steep as the maximum permitted by IR data () the contribution is at 5 keV, at 10 keV, at 15 keV, and vanishing at higher energies. This is so for the EdS model; the corresponding results are even lower for the flat model.
Also of interest is to determine the dependence of the superposed SBG emission (at a given energy) in order to assess when the contribution is maximal. This can be readily found from the integrand of the -integrated spectral intensity in eq. (10). Representing the main part of the spectral energy flux of a SBG as , with in the 1-200 keV band (see Fig.2), we see that in the EdS model the integrand in eq. (10) is . Thus, in evolving models the relative contribution of SBGs increases with if , and decreases if . While the critical value of for which this transition occurs is different in the flat- model, the behavior is qualitatively similar. Note that, as emphasized already, the contribution of the Compton component of the flux grows much more steeply due to the fact that the CMB energy density is .
6 Discussion
The starting point in our treatment and previous similar works is the identification of SBGs based on their spectral properties at 60m, particularly the use of the same estimate for the local 60m luminosity density, . However, most previous studies were limited to the consideration of only the low-energy (2 keV) contribution of SBGs to the CXB. Weedman (1987), Griffiths & Padovani (1990), and Ricker & Meszaros (1993), having based their estimates on Einstein data, evaluated the SBG contribution at 2 keV. More recently, Moran et al. (1999) estimated the SBG contribution to the 5 keV CXB from ASCA data, based on the assumption that the 5 GHz radio emission from galaxies lacking a radio-loud AGN can serve as a gauge of star-formation activity, and that the value measured in NGC 3256 for the 5 keV to 5 GHz flux ratio is universal. They used the 5 GHz number-count–flux relation, log-log, in the sub-mJy regime, and estimated that SBGs contribute of the 5 keV CXB. A less limited assessment of the SBG contribution was implemented (Rephaeli et al. 1991, 1995) by considering the SBG emission in the 2-30 keV band. However, due to lack of observational data, our previous works were based on a very preliminary statistical analysis of stacked (low-exposure HEAO-1 A2+A4) data. Here, on the other hand, we have estimated the 2-10 keV luminosity density using the detailed 60m and 2-10 keV luminosities measured for essentially the same sample of local SBGs whose X-ray spectra have been adequately measured (though not yet at the desired level of precision).
Inclusion of nonthermal emission due to Compton scattering of relativistic electrons by the FIR and CMB fields is an important new ingredient in the modeling of the high energy emission in an evolving population of SBGs. Although the level of this emission is still unknown, our explicit accounting for this emission and its expected rapid rise with redshift (which makes its relative contribution very significant at ) provide further motivation for a more detailed description then given here. [The occurrence of low-luminosity AGNs in the nuclei of SBGs is a controversial issue (e.g., Veilleux 2001), so we chose not to include such a component in the current treatment.]
Our main result that the evolving population of SBGs contributes appreciably to the CXB in the 2-10 keV band is quite consistent with our previous estimates (Rephaeli et al. 1991, 1995), and a similar result by Griffiths & Padovani (1990). It was argued in the latter paper that since the spectrum of X-ray binaries is quite hard and comparable in shape to that of the residual CXB in the 2-30 keV range, evolving SBGs in the redshift range could make an important contribution to the 2-10 keV CXB. In the use of a quantitative spectral form and evolutionary function, our treatment is similar in spirit to that of Ricker & Meszaros (1993, hereafter RM93). The main improvement with respect to the work of RM93 is the use of spectral results from individual SBGs observed with ASCA and BeppoSAX and the inclusion of the two Compton components, in contrast to their use of essentially an assumed theoretical model. [We have included also the observed warm ( keV) component, but its contribution to the emission at keV is relatively minor.]
In order to check the stability of our results vs. the characteristics of the FIR-selected SBG population, we have repeated the calculation using the SBG population parameters of Franceschini et al. (2001), who fitted the 12m number counts invoking the presence of a starbursting population whose volume emissivity increases steeply out to , and remains constant at higher [in a flat (, ) cosmological model]. The contribution of Franceschini et al.’s SBG population 888 The local 2-10 luminosity density of the starbursting population of Franceschini et al. (2001) is erg s-1 Mpc -1. This value is deduced from the 12m local luminosity function of this population (see their Fig.9), which can be described as with , , , and , and the average 2-10 keV to 12m luminosity ratio of , derived for the same sample of local SBGs mentioned in footnote 3 (the 12m data are from Shapley et al. 2001). The evolution is for and for , with . turns out to be only marginally higher than that computed for the SBG population of Pearson & Rowan-Robinson (1996) used in our main calculation and described by eqs.(2)-(5) (with ). On the whole, then, the results of this variant calculation are qualitatively consistent with our main results (see Fig.5, where the ’wind+binaries’ spectral model is used).
Recent results from the Chandra deep surveys provide direct estimates of the SBG contribution to the CXB. Using the 1 Ms Chandra Deep Field North (Brandt et al. 2001a) and 15 ISOCAM Hubble Deep Field North (Aussel et al. 1999) surveys, Alexander et al. (2002) found a tight correlation between the population of strongly evolving SBGs at discovered in faint 15 ISOCAM surveys (e.g., Aussel et al. 1999; Elbaz et al. 1999, 2002) – whose space density is an order of magnitude higher than that of local SBGs – and the apparently normal galaxies detected at faint fluxes in X-ray surveys (Giacconi et al. 2001; Hornschemeier et al. 2001; Brandt et al. 2001b). The characteristics (, , 2-10 keV spectral slope) of the population of the X-ray detected galaxies, whose redshifts are in the range (based mainly on Keck data; see Alexander et al. 2002 and references therein), are consistent with those expected for SBGs resembling local objects such as M82 and NGC 3256. In particular, their stacked average 2-10 keV spectral slope, , is steep enough to suggest a low fraction of obscured AGN activity within the population. The contribution of this population to the 0.5-8 keV CXB, estimated to be (Alexander et al. 2002), marginally agrees (on the low side) with our result for (see Fig.4). A contribution to the CXB will also come from the 1 Ms Chandra Deep Field North sources identified as Lyman-break galaxies at : these star-forming sources have rest-frame 2-8 keV luminosities and X-ray/-band luminosity ratios that are comparable to those of local SBGs (Brandt et al. 2001c). Based on the above, there is no evidence for a substantial change in the keV luminosity and spectral slope of these X-ray-selected, star-forming galaxies. On the other hand, their IR (15 ISOCAM) counterparts do show a strong density evolution with redshift (e.g., Aussel et al. 1999; Elbaz et al. 1999, 2002). All this clearly supports our adopted scheme of cosmic evolution, which is essentially of the density type (see sect.4).
Finally, it is commonly thought that AGNs are the prime sources of the CXB (e.g.: Comastri et al. 1995; Setti & Woltjer 1989; Boldt & Leiter 1981 and Leiter & Boldt 1982), and that additional contributions from other sources are typically estimated to be in the 2-10 keV range (Giacconi et al. 2001; Tozzi et al. 2001; Mushotzky et al. 2000). Based on our results, SBGs may possibly be the second most important contributors to the CXB. (Clusters of galaxies also contribute a few percent: e.g., Piccinotti et al. 1982.) The importance of determining the level of the SBG contribution to the 2-10 keV CXB lies not only in the implications for the evolution of SBGs themselves, but also in the ramifications for galaxy evolution in general, and as an additional input on the evolution of the AGN phenomenon in particular (e.g.: Fabian et al. 1998; Gilli et al. 1999).


Acknowledgements.
We are glad to thank Elihu Boldt for enlightening exchanges on the CXB normalization. We also thank an anonymous referee for useful suggestions. M.P. acknowledges financial support from the Italian Space Agency (ASI) through grant No. ASI RS 99 I/R/098/00, as well as the warm and stimulating environment of the Center for Astrophysics and Space Sciences (CASS) of the University of California at San Diego (UCSD), where part of this work was carried out. Y.R. acknowledges NASA for supporting his work at UCSD. This research has made use of the NASA/IPAC Extragalactic Database (NED) which is operated by the Jet Propulsion Laboratory, California Institute of Technology, under contract with NASA.References
Alexander, D.M., Aussel, H., Bauer, F.E., Brandt, W.N., Hornschemeier, A.E., Vignali, C., Garmire, G.P., & Schneider, D.P. 2002, ApJ, 568, L85
Aussel, H., Cesarsky, C.J., Ebaz, D., & Starck, J.L. 1999, A&A, 342, 313
Benn, C.R., Rowan-Robinson, M., McMahon, R.G., Broadhurst, T.J., & Lawrence, A. 1993, MNRAS, 263, 98
Boldt, E. 1987, Phys. Rep., 146, 215
Boldt, E., & Leiter, D. 1981, Nature, 290, 483
Bookbinder, J., Cowie, L.L., Krolik, J.H., & Rees, M. 1980, ApJ, 237, 647
Brandt, W.N., Alexander, D.M., Hornschemeier, A.E., Garmire, G.P., Schneider, D.P., Barger, A.J., Bauer, F.E., Broos, P.S., Cowie, L.L., Townsley, L.K., Burrows, D.N., Chartas, D., Feigelson, E.D., Griffiths, R.E., Nousek, J.A., & Sargent, W.L.W. 2001a, AJ, 122, 2810
Brandt, W.N., Hornschemeier, A.E., Alexander, D.M., Garmire, G.P., Schneider, D.P., Broos, P.S., Townsley, L.K., Bautz, M.W., Feigelson, E.D., & Griffiths, R.E. 2001b, AJ, 122, 1
Brandt, W.N., Hornschemeier, A.E., Schneider, D.P., Alexander, D.M., Bauer, F.E., Garmire, G.P., & Vignali, C. 2001c, ApJ, 558, L5
Cappi, M., Persic, M., Bassani, L., Franceschini, A., Hunt, L.K., Molendi, S., Palazzi, E., Palumbo, G.G.C., Rephaeli, Y., & Salucci, P. 1999, A&A, 350, 777
Chen, L.-W., Fabian, A.C., & Gendreau, K.C. 1997, MNRAS, 285, 449
Christian, D.J, & Swank, J.H. 1997, ApJS, 109, 177
Comastri, A., Setti, G., Zamorani, G., & Hasinger, G. 1995, A&A, 296, 1
Condon, J.J. 1992, ARAA, 30, 575
Dahlem, M., Weaver, K.A., & Heckman, T.M. 1998, ApJS, 118, 401
Danese, L., De Zotti, G., Franceschini, A., & Toffolatti, L. 1987, ApJ, 318, L15
David, L.P., Jones, C., & Forman, W. 1992, ApJ, 338, 82
Della Ceca, R., Griffiths, R.E., Heckman, T.M., Lehnert, M.D., & Weaver, K.A. 1999, ApJ, 514, 772
Della Ceca, R., Griffiths, R.E., Heckman, T.M., & MacKenty, J.W. 1996, ApJ, 469, 662
Elbaz, D., Cesarsky, C.J., Chanial, P., Aussel, H., Franceschini, A., Fadda, D., & Chary, R.R. 2002, A&A, 384, 848
Elbaz, D., Cesarsky, C.J., Fadda, D., Aussel, H., Desert, F.X., Franceschini, A., Flores, H., Harwit, M., Puget, J.L., Starck, J.L., Clements, D.L., Danese, L., Koo, D.C., & Mandolesi, R. 1999, A&A, 351, L37
Ellis, R.S., Colless, M., Broadhurst, T., Heyl, J., & Glazebrook, K. 1996, MNRAS, 280, 235
Fabbiano, G. 1989, ARAA, ApJ, 330, 672
Fabian, A.C., Barcons, X., Almaini, O., & Iwasawa, K. 1998, MNRAS, 297, L11
Franceschini, A., Aussel, H., Cesarsky, C.J., Elbaz, D., & Fadda, D., 2001, A&A, 378, 1
Franceschini, A., Danese, L., De Zotti, G., & Xu, C. 1988, MNRAS, 233, 175
Franceschini, A., Braito, V., Persic, M., Della Ceca, R., Bassani, L. Cappi, M., Malaguti, P., Palumbo, G.G.C., Risaliti, G., Salvati, M., & Severgnini, P. 2002, MNRAS, submitted
Fried, J.W., von Kuhlmann, B., Meisenheimer, K., Rix, H.-W., Wolf, C., Hippelein, H.H., Kümmel, M., Phleps, S., Röser, H.J., Thierring, I., & Maier, C. 2001, A&A, 367, 788
Gendreau, K.C., Mushotzky, R., Fabian, A.C., Holt, S.S., Kii, T., Serlemitsos, P.J., Ogasaka, Y., Tanaka, Y., Bautz, M.W., Fukazawa, Y., Ishisaki, Y., Kohmura, Y., Makishima, K., Tashiro, M., Tsusaka, Y., Kunieda, H., Ricker, G.R., & Vanderspek, R.K. 1995, PASJ, 47, L5
Giacconi, R., Rosati, P., Tozzi, P., Nonino, M., Hasinger, G., Norman, C., Bergeron, J., Borgani, S., Gilli, R., Gilmozzi, R., & Zheng, W. 2001, ApJ, 551, 624
Gilli, R., Risaliti, G., & Salvati, M. 1999, A&A, 347, 424
Goldshmidt, O., & Rephaeli, Y. 1995, ApJ, 444, 113
Griffiths, R., & Padovani, P. 1990, ApJ, 360, 483
Griffiths, R.E., Ptak, A., Feigelson, E.D., Garmire, G., Townsley, L., Brandt, W.N., Sambruna, R., & Bregman, J.N. 2000, Science, 290, 1325
Gruber, D.E., Matteson, J.L., Peterson, L.E., & Jung, G.V. 1999, ApJ, 520, 124
Hornschemeier, A.E., Brandt, W.N., Garmire, G.P., Schneider, D.P., Barger, A.J., Broos, P.S., Cowie, L.L., Townsley, L.K., Bautz, M.W., Burrows, D.N., Chartas, G., Feigelson, E.D., Griffiths, R.E., Lumb, D., Nousek, J.A., Ramsey, L.W., & Sargent, W.L.W. 2001, ApJ, 554, 742
Itoh, N., Sakamoto, T., Kusano, S., Nozawa, S., & Koyama, Y. 2000, ApJS, 128, 125
Kim, D.-C., & Sanders, D.B. 1998a, ApJ, 508, 627
Kim, D.-C., & Sanders, D.B. 1998b, ApJS, 119, 41
Leiter, D., & Boldt, E. 1982, ApJ, 260, 1
Lilly, S.J., Le Fevre, O., Hammer, F., & Crampton, D. 1996, ApJ, 460, L1
Lilly, S.J., Tresse, L., Hammer, F., Crampton, D., & Le Fevre, O. 1995, ApJ, 455, 108
Lin, H., Yee, H.K.C., Carlberg, R.G., et al. 1999, ApJ, 518, 523
Lonsdale, C.J., Hacking, P.B., Conrow, T.P., & Rowan-Robinson, M. 1990, ApJ, 358, 60
Lonsdale, C.J., Helou, G., Good, J.C., & Rice, W. 1985, ’Cataloged Galaxies and Quasars Observed in the IRAS Survey’ (JPL, Pasadena, CA)
Madau, P., Ferguson, H.C., Dickinson, M.E., Giavalisco, M., Steidel, C.C., & Fruchter, A. 1996, MNRAS, 283, 1388
Marshall, F.E., Boldt, E.A., Holt, S.S., Miller, R.B., Mushotzky, R.F., Rose, L.A., Rothschild, R.E., & Serlemitsos, P.J. 1980, ApJ, 235, 4
Matsumoto, H., & Tsuru, T.G. 1999, PASJ, 51, 321
Miyaji, T., Ishisaki, Y., Ogasaka, Y., Ueda, Y., Freyberg, M.J., Hasinger, G., & Tanaka, Y. 1998, A&A, 334, L13
Mizuno, T., Ohbayashi, H., Iyomoto, N., & Makishima, K. 1998, in ’The Hot Universe’, ed. K.Koyama et al., IAU Symp. 188, 284
Moran, E.C., Lehnert, M.D., & Helfand, D.J. 1999, ApJ, 526, 649
Morrison, R., & McCammon, D. 1983, ApJ, 270, 119
Mushotzky, R.F., Cowie, L.L., Barger, A.J., & Arnaud, K.A. 2000, Nature, 404, 459
Okada, K., Mitsuda, K., & Dotani, T. 1997, PASJ, 49, 653
Pearson, C., & Rowan-Robinson, M. 1996, MNRAS, 283, 174
Persic, M., Gruber, D.E., & Rephaeli, Y. 2002, in preparation
Persic, M., & Rephaeli, Y. 2002, A&A, 382, 843
Piccinotti, G., Mushotzky, R.F., Boldt, E.A., Holt, S.S., Marshall, F.E., Serlemitsos, P.J., & Shafer, R.A. 1982, ApJ, 253, 485
Ptak, A., Serlemitsos, P.J., Yaqoob, T., Mushotzky, R., & Tsuru, T. 1997, AJ, 113, 1286
Rephaeli, Y. 1979, ApJ, 227, 364
Rephaeli, Y., & Gruber, D. 2002, A&A, 389, 752
Rephaeli, Y., Gruber, D., & Persic, M. 1995, A&A, 300, 91
Rephaeli, Y., Gruber, D., Persic, M., & McDonald, D. 1991, ApJ, 380, L59
Ricker, P.M., & Meszaros, P. 1993, ApJ, 418, 49
Roberts, T.P., Schurch, N.J., & Warwick, R.S. 2001, MNRAS, 324, 737
Rothschild, R.E., Baity, W.A., Gruber, D.E., Matteson, J.L., Peterson, L.E., & Mushotzky, R.F. 1983, ApJ, 269, 423
Rowan-Robinson, M., & Crawford, J. 1989, MNRAS, 238, 523
Rowan-Robinson, M., Benn, C.R., Lawrence, A., McMahon, R.G., & Broadhurst, T.J. 1993, MNRAS, 263, 123
Saunders, W., Rowan-Robinson, M., Lawrence, A., Efstathiou, G., Kaiser, N., Ellis, R.S., & Frenk, C.S. 1990, MNRAS, 242, 318
Schaaf, R., Pietsch, W., Biermann, P.L., Kronberg, P.P., & Schmutzler, T. 1989, ApJ, 336, 722
Schmitt, H.R., Kinney, A.L., Calzetti, D., & Storchi Bergmann, T. 1997, AJ, 114, 592
Setti, G., & Woltjer, L. 1989, A&A, 224, L21
Shapley, A., Fabbiano, G., & Eskridge, P.B. 2001, ApJS, 137, 139
Silva, L., Granato, G.L., Bressan, A., & Danese, L. 1998, ApJ, 509, 103
Stewart, G.C., Fabian, A.C., Terlevich, R.J., & Hazard, C. 1982, MNRAS, 200, 61P
Thompson, R.I., Weymann, R.J., & Storrie-Lombardi, L.J. 2001, ApJ, 546, 694
Tozzi, P., Rosati, P., Nonino, M., Bergeron, J., Borgani, S., Gilli, R., Gilmozzi, R., Hasinger, G., Grogin, N., Keweley, L., Koekemoer, A., Norman, C., Schreier, E., Szokoly, G., Wang, G.X., Zheng, W., Zirm, A., & Giacconi, R. 2001, ApJ, 562, 42
Tucker, W.A. 1975, Radiation Processes in Astrophysics (Cambridge: MIT Press), 169
Veilleux, S. 2001, in ’Starburst Galaxies: Near and Far’, ed. L.Tacconi & D.Lutz (Heidelberg: Springer-Verlag), 88
Weedman, D.W. 1987, in ’Star Formation in Galaxies’, ed. C.J.Lonsdale (NASA CP-2466), 351
White, N.E., Swank, J.H., & Holt, S.S. 1983, ApJ, 270, 711
Wilson, G., Cowie, L., Barger, A.J., & Burke, D.J. 2002, AJ, 124, 1258
Zezas, A.L., Georgantopoulos, I., & Ward, M.J. 1998, MNRAS, 301, 915