Detection of X-ray Emission from the Eastern Radio Lobe of PICTOR A
Abstract
The XMM-Newton satellite has revealed extended X-ray emission from the eastern radio lobe of the Fanaroff-Riley II Radio Galaxy Pictor A . The X-ray spectrum, accumulated on a region covering about half the entire radio lobe, is well described by both a thermal ( keV) model and a power law with an energy index . The X-ray emission could be thermal and produced by circum-galactic gas shocked by the expanding radio lobe or, alternatively, by Inverse Compton (IC) of cosmic microwave background photons by relativistic electrons in the lobe. The latter possibility seems to be supported by the good agreement between the lobe-average synchrotron radio index (=0.8) and the X-ray energy slope . However, if this is the case, the magnetic field ( G), as deduced from the comparison of the IC X-ray and radio fluxes, is more than a factor 2 below the equipartition value estimated in the same X-ray region.
1 Introduction
The recent opportunity offered by Chandra and XMM-Newton to perform spatially resolved studies of radio loud AGN have focused attention on X-ray processes occurring at pc-kpc distance from the nucleus (Kraft et al. 2000, Sambruna et al. 2000, Wilson et al. 2000, Tavecchio et al. 2001, Harris & Krawczynski, 2002, Hardcastle et al. 2002). This is an interesting new perspective, as the past X-ray studies were almost completely dedicated to the investigation of the nuclear emission.
In the environment of radio loud AGN there are several structures which emit X-ray photons: jets, hot gaseous media, hot spots and extended radio lobes. Among these, radio lobe counterparts, are the less bright and therefore the most difficult regions to be detected. This is a frustrating condition, as the X-ray detection of radio extended structures could provide, in principle, important physical information. It is thought that radio-emitting electrons can upscatter local cosmic microwave background (CMB) and/or nuclear AGN photons, producing X-rays (Feigelson et al. 1995, Kaneda et al. 1995, Brunetti et al. 1999, 2001a, 2001b, Hardcastle et al 2002). Measures of Inverse Compton (IC) radiation provide a formidable instrument to probe the energetics of the radio lobes, i.e. the integrated energy channelled by the active nucleus in the jet during its lifetime. In particular, if observed, X-ray photons allow a direct estimate of the average magnetic field along the line of sight and the energy densities of the particles in the lobe. However this is not an easy task. The corresponding X-ray fluxes are expected to be weak and easily overwhelmed by thermal emission surrounding many radio galaxies. In addition, external gas compressed by the radio lobes during their expansion through the environment could also contribute to the X-ray emission. Disentangling thermal and non-thermal radiation is then more complicated.
In spite of the difficulty, some X-ray detections of extended synchrotron radio regions have been already realized (Feigelson et al. 1995, Kaneda et al. 1995, Tahiro et al. 1998, 2001, Brunetti et al. 1999, Brunetti et al. 2001a, Brunetti et al. 2001b, Hardcastle et al. 2002) and for the most part the more plausible mechanism for the X-ray production seems to be Inverse Compton.
Here we present a XMM-Newton detection of X-ray photons from the east radio lobe of Pictor A . Pictor A is a nearby (z=0.035) radio galaxy optically classified as Broad Line Radio Galaxy. It is an isolated source. As reported by Miller et al. (1999), who performed an accurate X-ray optical study of the environment around nearby radio galaxies, there is no indication of galaxy clustering around this source. Pictor A is a double lobed radio source with a Fanaroff Riley II (FRII) morphology. VLA observations of Perley et al. (1997; PRM) show two nearly circular radio lobes with hot spots. The western lobe has a flatter radio spectrum and a much brighter hot spot. The spectrum indices are however fairly uniform throughout each lobe , although a flattening is observed near the hot spots. A faint radio jet connects the nucleus to the western hot spot.
Recently, Chandra has produced X-ray spectra of the jet and of the western hot spot and detected faint extended emission from the east lobe (Wilson et al. 2001). XMM-Newton , collecting a larger number of photons, has allowed us not only to detect the extended emission from the lobe, but also to obtain a spectrum between 0.2-12 keV. We think that this exciting result has been possible thanks to the combination of four important factors: i) the very large effective area of XMM-Newton , which allows to reveal X-ray structures of low surface brightness; ii) the spatial resolution of XMM-Newton which can resolve kpc structures in sources with moderately low redshifts; iii) the high brightness of the radio lobes of Pictor A ; iv) the lack of a dense hot intracluster medium, which can mystify the X-ray measures.
Here we will essentially focus on the emission of the eastern lobe. The other X-ray components and in particular the nucleus will be treated in a following paper (Grandi et al. in preparation).
2 Data Analysis and Results
The field containing Pictor A was observed by XMM-Newton (Jansen et al. 2001) on March 17, 2001.
The EPIC/p-n cameras (0.1-15 keV; Strüder et al. 2001) operated in Full Frame Mode, with the Thin optical filter. The EPIC/MOS cameras (0.25-10 keV; Turner et al. 2001) operated in Small Window Mode. In this mode only a 1.8’1.8’ square of the field of view is active in order to avoid pile up problems with the nucleus. The spectral analysis of the environment of Pictor A is therefore based on the p-n instrument alone.
Data reduction was performed using the software package SAS version 5.1. A Calibration Index File appropriate for the date of the observation and the data analysis (July 2001) was produced. We employed the widest pattern selection (PATTERN=0-4 : singles and doubles events), for which the response matrices are available. Different choices of the pattern selection did not substantially affect the following results. The observation was affected by flaring background. The inspection of the p-n light curve showed an irregular activity, concentrated in the central part and towards the end of the observation. We verified that the spectral fit results were not substantially affected by the inclusion of the high-background intervals. As the signal-to-noise ratio substantially increases if the whole p-n data set is used, we did not apply any time screening to the p-n data, beyond those automatically applied by the data reduction pipeline. After screening, the total exposure time was 15.7 ks.
2.1 X-ray Image
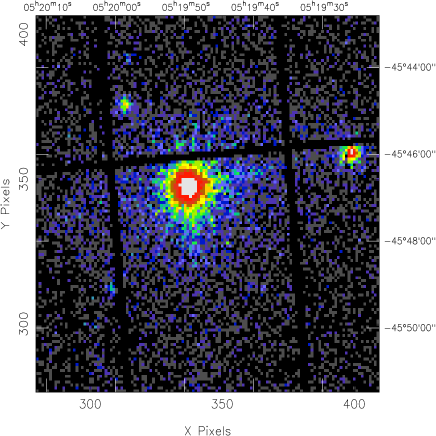
Figure 1 (upper panel) shows the 0.2-12 keV image of Pictor A . Several components can be revealed by a simple inspection of the XMM-Newton field: the bright nucleus, the western hot spot, the jet pointing towards the hot spot and a faint asymmetric diffuse emission around the nucleus. The point-like sources at about 3 arcmin NE from the nucleus and at the lower extremity of the east lobe are foreground objects.
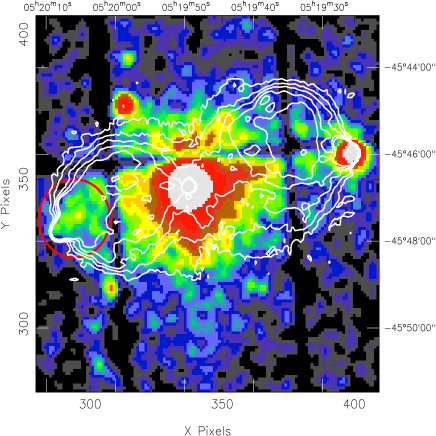
In Figure 1 (lower panel), the 20 cm (1.4 GHz) radio contours is overimposed on the XMM-Newton image smoothed with a gaussian with . The faint nebulosity becomes more evident showing an asymmetric and elongated shape. The spatial coincidence of the eastward structure and the radio lobe is impressive. On the contrary, the X-ray counterpart of the west lobe is less clear. The presence of a strong hot spot and a jet emission probably reduces the contrast between the faint extended emission and the background. In addition, we have lost most of the western X-ray lobe because of the gaps among the CCD cameras.
We exclude the possibility that unresolved point-sources produce the eastwards diffuse X-ray emission. The high spatial resolution of Chandra has revealed four faint compact objects in the eastern lobe. We retrieved the Chandra /ACIS public data and estimated an average flux of F erg cm-2 sec-1 for each source, assuming a power law model () and Galactic absorption. Then, about 20 point-like sources would be necessary to reproduce the (Galactic absorbed) X-ray enhancement observed by XMM-Newton (F erg cm-2 sec-1).
2.2 X-ray Spectrum
We accumulated a X-ray spectrum of the east lobe on a circular region of radius 54” (26 kpc1111” corresponds to 483 pc for H km sec-1 Mpc-1 located at a distance of 172” (83 kpc) from the nucleus (red circle in Figure 1-lower panel). This corresponds to the lobe area characterized by intense X-ray and radio emission. The background was extracted from a circle of the same dimension in the same chip. Before performing the fits, the spectrum was binned in order to ensure the applicability of the statistic and an adequate sampling of the spectral resolution of each instrument. All the fits were performed with XSPEC11.
In the 0.2-12 keV band, the net count rate in the X-ray lobe area, after the removal of the background, was with a 1- uncertainty of . The signal to noise ratio larger than 11 excludes the possibility that the measured X-ray excess was a background fluctuation.

The X-ray spectrum was well reproduced either by a power law or by a thermal model in the 0.2-12 keV. In both cases, the acceptable range of NH was consistent with the Galactic line of sight value NH = cm-2. Then, we fixed the column density to the Galactic value in order to reduce the uncertainties of the parameters. The results are listed in Table 1. The reported uncertainties are at 90 confidence level for one parameter of interest ().
It is worth noting that the spectral energy index () of the power law is in very good agreement with the average synchrotron radio index of the lobes (). This is an intriguing result that suggests a common non-thermal origin of radio and X-ray photons. However, as discussed later, this is not the only possibility.
| Power Law | Thermal Emission | |||
| 1.56 | kT [keV] | |||
| Na | 2.5 | |||
| Ac | ||||
| (dof) | 59(58) | (dof) | 60(57) | |
| Fluxd (0.2-2 keV) | Fluxd (0.2-2 keV) | |||
| Fluxd (2-10 keV) | Fluxd (2-10 keV) | |||
3 Discussion
In this paper we report a XMM-Newton spectral analysis of an extended radio structure. This is the first time that XMM-Newton detects and produces a spectrum of a radio lobe in an isolated powerful FRII radio galaxy. The fit result is not univocal: both a non-thermal and a thermal model are acceptable from a statistical point of view. In the following we investigate both these possibilities.
Thermal emission - Although Chandra (Wilson et al. 2001) and XMM-Newton (paper in preparation) have revealed a gaseous atmosphere of about 1’ of radius around the nucleus, we exclude that the X-ray lobe emission is part of this circumgalactic medium. The studied region is located far away from the nucleus, at about 2’ and, in addition, its temperature is much harder than the gas surrounding the nucleus (kT keV; paper in preparation).
It is also improbable that the lobe is completely filled by gas gathered from the nuclear environment. Recent Chandra images of clusters show very low density regions in correspondence to the radio lobes of the central galaxies (Fabian et al. 2001, Finoguenov and Jones 2001, McNamara et al. 2000). It is evident that radio lobes escaves cavities during their expansion in the surrounding medium. Moreover, the Rotation Measure (RM= 43222RM=, where is the electronic density (cm-3), (gauss) is the Magnetic Field along the line of sight and L is the path length (in parsec)) reported by PRM seems to be inconsistent with the idea that synchrotron and thermal plasma (causing Faraday rotation) coexist within the east lobe. As deduced by the emission measure in Table 1, the gas, if uniformly distributed in the X-ray region, should have a density of cm-3. Assuming an equipartition magnetic field of BG (see later), the observed measure of rotation requires a thermal plasma density smaller by at least a factor 10.
Nevertheless the thermal hypothesis can not be rejected. The X-ray radiation could be actually produced by shocked gas surrounding the radio lobe. (This could also explain the strong radio depolarization observed in the eastern lobe at 90 cm (PRM)). Although Chandra images show cool rims rather than strong shocks around the radio lobes in clusters (Fabian et al. 2000, McNamara, Blanton et al. 2001), theoretical arguments support this view. Hydrodynamic simulations show that, in the early life of a powerful source, jet materials inflate overpressured cocoons which compress the surrounding ambient material. At a later time, the shocks become weaker and eventually, when the jet activity ceases, the old cocoon material can rise under the action of buoyancy forces, gather cold gas from the from the surrounding ambient and lift them up into the galaxy/cluster atmosphere (Reynolds et al. 2002). Then, the observed cool rims surrounding the radio cavities in clusters could then be remnants of old cocoons. On the contrary, Pictor A could be in an early stage. Its cocoons are still supersonic and able to drive a bow shock into the circumgalactic gas. Zanni et al. (2002) have recently studied the evolution of an expanding cocoon as a function of the jet physical properties and shown that high Mach number jets with high densities (with respect to the environment) are strongly overpressured for a long fraction of their life.
Non-Thermal emission - The good agreement between the lobe-average synchrotron radio index (=0.8, PRM) and the power law slope () surely favours the idea that radio and X-ray photons are produced by the same relativistic population of electrons. At first, we checked whether the synchrotron process, responsible for the radio emission, could also produce X-rays. In order to verify that, we produced a radio-X-ray spectrum of the east lobe. We directly estimated the flux of the X-ray region from the 20 cm radio map (PRM). The contribution of the (double) hot spot was removed and the resultant radio flux ( Jy ) compared to that from the entire lobe. Successively, the radio fluxes at 74, 327 and 4995 MHz, listed in Table 3 of RMP, were rescaled by the same factor (). As shown in the upper panel of Figure 3, our X-ray data do not lie on the extrapolation of the radio spectrum. Moreover they can not be connected to the radio invoking radiative losses of the relativistic electrons, because the XMM-Newton spectral slope is hard and consistent with the radio one. Synchrotron process is implausible.


Thus, the Inverse Compton remains the more likely emission process. The seed photons scattered off by the lobe electrons can have different origins. They can be the same synchrotron photons produced in the lobe (SSC model), photons coming from the AGN in the Pictor A nucleus (IC/AGN) and cosmic microwave background photons (IC/CMB). In order to discriminate among them, it is necessary to estimate the relative energy densities. Extrapolating the radio spectrum in Figure 3 (upper panel) from Hz to 1012 Hz, we inferred a synchrotron photon density of erg cm-3 (in the X-ray region). In comparison, the CMB energy density at the Pictor A redshift is erg cm-3, about 2 order of magnitude larger.
Analogously we estimated the AGN energy density at a distance of 83 kpc, where the extracted X-ray region is located, utilizing the spectral energy distribution (SED) of the nucleus of Pictor A . The nuclear SED, shown in Figure 3 (lower panel), is the combination of the UV fluxes and the X-ray fluxes measured with this XMM observation (Grandi et al. in preparation) and radio and infrared data from literature (PRM, Golombek et al. 1988, Glass 1981).
Even assuming the implausible case in which all the radio-UV nuclear photons are IC seed photons, the energy density is erg cm-3, again significantly smaller than the CMB radiation.
Thus, the Inverse Compton of the cosmic microwave background photons by the relativistic electrons in the east lobe is the more probable non-thermal mechanism responsible for the observed X-ray flux.
As an immediate consequence, we can directly estimate the magnetic field () in the analyzed lobe region, following the prescription of Harris Grindley (1979). Assuming F Jy, F erg cm-2 sec-1 and , we obtain a magnetic field of G. This value is smaller by about a factor 2.5 than the equipartition field (B G) inferred by the standard formula reported by Miley (1980). Our input parameters were: F Jy and (as before), , s=52.18 kpc, k=1, =1, , where is the X-ray diameter region, s is the path length, k is the ratio of the energy in heavy particles to the energy in electrons, is the volume filling factor and is the angle between the uniform magnetic field and the line of sight. (Note that we obtained a similar value of Beq considering the entire lobe and the total radio flux). If we consider a harder slope of the electron energy distribution () in agreement with the X-ray energy index (, p), the estimated magnetic field is only G and the violation of the equipartition condition becomes more serious.
Then, if the X-ray emission is due to scattering of the microwave background radiation, the radio lobe could be far from the equipartition condition. This results is not surprising. Recently Hardcastle et al. (2002) found that the X-ray emission from radio lobes of three radio sources (two quasars and one radio galaxy), if due to IC/CMB, needed IC magnetic fields typically a factor 2 below the equipartition values.
However, we would like to stress that the equipartition and IC methods used to determinate the magnetic field are not accurate. In addition, our radio and X-ray measurements are affected by uncertainties. One of these is the X-ray contribute of the radio hot spots, that we can not quantize (if present) with the current XMM-Newton image.
4 Conclusion
XMM-Newton has revealed extended X-ray emission coincident with the east radio lobe of Pictor A , an isolated powerful FRII radio galaxy.
The X-ray radiation could be produced by material of the circum-galactic halo which is swept and heated by a bow shock in front of the radio lobe. In disfavour of this interpretation there are some recent high resolution images of Chandra which show no strong shocks around the radio lobes (i.e. the empty cavities) in clusters. However, as supported by hydrodynamic simulations, Pictor A could be in an early phase of its evolution characterized by still overpressured cocoons. On the contrary, the radio galaxies in clusters could be at a final stage with the old (decelerated) cocoons under the only action of buoyancy forces.
Alternatively, the X-ray emission could due to a non-thermal mechanism. The good agreement between the X-ray energy spectral index () and the average value of the synchrotron radio slope seems to support this possibility. The more likely non-thermal process is Inverse Compton scattering of the local CMB photons by relativistic electrons in the lobe. However, if this is the case, the IC magnetic field, estimated in the X-ray region, turns out to be a factor 2.5 or more below the equipartition value.
References
- (1) Blanton, E., Sarazin, C. L., McNamara, B. R., et al. 2001, ApJ, 558, L15
- (2) Brunetti, G., Cappi, M., Setti G., Feretti, L., Harris, D. E., 2001a, 372, 755
- (3) Brunetti G., Bondi, M., Comastri, A., Setti, G., 2001b, ApJ, 561, 15
- (4) Brunetti G., Comastri A., Setti G. and Feretti L., 1998 342,57
- (5) Churazov, E., Bruggen, M., Kaiser, C. R., B hringer, H., Forman, W., 2001, ApJ, 554, 216
- (6) Fabian A.C., Sanders, J. S., Ettori, S. et al. 2000, MNRAS, 318, L65
- (7) Feigelson E.D., Laurent-Muehleisen S.A., Kollgaard R.I. and Fomalont E.B. 1995 ApJ 453 L13
- (8) Finoguenov, A., Jones, C., 2001, ApJL, 547, L107
- (9) Glass, I. S., 1981, MNRAS, 197, 1067
- (10) Golombek D. Miley G.K. 1988 95, 26
- (11) Hardcastle, M. J., Birkinshaw, M., Cameron, R. A.et al. 2002 ApJ in press (astro-ph/0208204)
- (12) Harris D.E. Grindley J.E. 1979 MNRAS 188, 25
- (13) Harris D.E., Krawczynski H, 2002, ApJ, 565, 244
- (14) Jansen F., et al., A&A, 2001, 365, L1
- (15) Kaneda, H., Tashiro, M., Ikebe, Y., Ishisaki, Y., Kubo, H., Makshima, K., Ohashi, T., Saito, Y., Tabara, H., Takahashi, T., 1995, ApJ, 453, L31
- (16) Kraft R.P., Forman, W., Jones, C., et al. 2000 ApJ 531, L9
- (17) Miley, G., 1980 ARAA, 18, 165
- (18) Miller N. A., Owen, F. N., Burns, J. o., Led low M., J., and Vogues, W., 1999, AJ, 118, 1988
- (19) McNamara, B., et al. 2000, ApJ 534, 135
- (20) Perley R.A., Roser H.J. Meisenheimer K. 1997 328, 12 (PRM)
- (21) Reynolds, C.S., Heinz, S., Begelman, M. C. 2001, ApJ, 569, 163
- (22) Sambruna R.M., Urry C.M., Tavecchio F., Maraschi L., Scarpe R., Chartas G. & Muxlow T., 2001 ApJ 549, L161
- (23) Strüder L., et al., A&A, 2001, 365, L18
- (24) Tashiro M., Kaneda, H., Makishima, K., Iyomoto, N., Idesawa, E., Ishisaki, Y., Kotani, T., Takahashi, T., Yamashita, A., 1998, ApJ, 499, 713
- (25) Tashiro M., Makishima, K., Iyomoto, N., Isobe, N., Kaneda, H., 2001, ApJ, 546, L19
- (26) Tavecchio F., Maraschi L., Sambruna R.M. and Urry C.M. 2000 ApJ 544, L23
- (27) Turner M.J.L., Abbey A., Arnaud M., 2001 AA 365, 27
- (28) Wilson A.S., Young A.J. Shopbell P.L., 2001 ApJ 544, L27
- (29) Zanni C., Bodo, G., Rossi P., Massaglia, S., Durbala, A. and Ferari, A. 2002 sumbitted