Detection of diffuse TeV gamma-ray emission from the nearby starburst galaxy NGC 253
We report the TeV gamma-ray observations of the nearby normal spiral galaxy NGC 253. At a distance of 2.5 Mpc, NGC 253 is one of the nearest starburst galaxies. This relative closeness, coupled with the high star formation rate in the galaxy, make it a good candidate TeV gamma-ray source. Observations were carried out in 2000 and 2001 with the CANGAROO-II 10 m imaging atmospheric Cerenkov telescope. TeV gamma-ray emission is detected at the level with a flux of at energies 0.5 TeV. The data indicate that the emission region is broader than the point spread function of our telescope.
Key Words.:
Gamma rays: observation — Galaxies: individual: NGC 253 — Galaxies: starburst — cosmic rays1 Introduction
NGC 253 is a nearby (2.5 Mpc) (Vaucouleurs vau78 (1978)) starburst galaxy, in which a high cosmic-ray density and non-thermal emissions are expected (Voelk et al. voe96 (1996)). The large-scale radio continuum structure of NGC 253 was studied by Hummel et al. (hum84 (1984)). Carilli et al. (car92 (1992)) found a large, bright synchrotron-emitting halo extending to more than 10 kpc from the galaxy centre. Diffuse X-ray emission from the halo has also been detected (Cappi et al. cap99 (1999); Strickland et al. str02 (2002)). The OSSE instrument on the Compton Gamma-Ray Observatory (CGRO) detected sub-MeV gamma-rays (Bhattacharya et al. bha94 (1994)) which were attributed to far-infrared photons scattered by the high energy, synchrotron emitting, electrons (Goldshmidt & Raphaeli gol95 (1995)). The EGRET detector, however, gave only upper limits on gamma-ray emission in GeV energies (Blom et al. blo99 (1999)).
We have observed NGC 253 with the CANGAROO-II telescope between October 3 and November 18, 2000, and September 20 to November 15, 2001. While the detection of diffuse TeV emission from our galaxy is very difficult (e.g., Aharonian et al. aha02 (2002)), observations of NGC 253 provide the opportunity to study the distribution of cosmic rays in galaxies like our own.
2 Observation and Analysis
Very high-energy gamma-rays (with energy greater than several hundred GeV) interact in the upper atmosphere and produce cascades of secondary photons and particles. Secondary electrons and positrons with energy greater than the (altitude dependent) Cerenkov threshold emit optical photons in directions approximately the same as that of the incident gamma-ray. The CANGAROO-II telescope (Kawachi et al. kaw01 (2001)) was constructed near Woomera, South Australia (136∘47’E, 31∘04’S) to detect the several nano-second duration flashes of Cerenkov light. The telescope consists of a 10 m reflector and a camera of 552 pixels, each a 0.115∘ square photo-multiplier (PMT). From the detected Cerenkov light images, the directions and energies of the incident gamma-rays can be reconstructed.
A total of 75 hours of observations of NGC 253 (“ON”) were made, with a similar amount of background (“OFF”) observations. Each ON-source run tracked the center of NGC 253 through its highest elevations, with OFF-source observations offset in right ascension made in order to estimate the background. An edge-on galaxy, NGC 253 appears optically (based on red Digitized Sky Survey [DSS2] data; http://skyview.gsfc.nasa.gov/), as a disc 0.4∘ by 0.1∘ in size. This is larger than our angular resolution, but much smaller than the telescope’s field of view (FOV) of 1.84∘ 1.84∘. After selecting data taken at high elevation angles () in good weather conditions, a total of 2959 min. ON-source and 2417 min. OFF-source data remained for further analysis.
First, “cleaning” cuts were applied to the camera images, requiring pixel pulse-heights of greater than 3.3 photoelectrons, Cerenkov photon arrival times within 40 nsec, and clusters of at least four adjacent triggered pixels in each event. After these pre-selections, we carried out a shower image analysis using the standard set of image parameters, distance, length, width, and (Hillas hil85 (1985)), combining length and width (after an initial distance cut) to assign likelihoods to each event (Enomoto et al. 2002a ; 2002b ). The likelihood for both a gamma-ray origin and cosmic-ray proton origin were calculated. The cut to reject background events was based on the ratio of these two likelihoods. After these cuts, the image orientation angle () was plotted. A gamma-ray signal appears as an excess at low after the normalized OFF-source distribution is subtracted from the ON-source distribution. As shown in Fig. 1a, an excess of events with is clearly observed for NGC 253.

The number of gamma-ray-like events is 1652149 (11.1), corresponding to 0.56 gamma-rays per min.
The energy scale (the conversion factor from ADC value to number of photoelectrons) was determined by adjusting the cosmic ray event rate and the relation between the total ADC counts and the total number of hit pixels. This estimation also agreed with the calculated single trigger rate for pixel due to the Night Sky Background (NSB). We obtained the threshold energy for the gamma-ray detection to be 500 GeV for a spectrum and 400 GeV for a spectrum, after pre-selection cuts and also the same values after image parameter cut. These values were obtained from the peak positions of the effective area multiplied by power law energy dependences.
The same analysis procedure was applied to Crab nebula data from observations in November and December 2000 as a check. Approximately 10 hours of good data were obtained. The resulting plot, shown in Fig. 1b, has an excess of 39359 events (6.7). The solid histograms are the Monte Carlo predictions for the distribution in the case of a point source. Note that the Crab observation was carried out at large zenith angles, around 56∘. At such large zenith angles, the distribution deteriorates due to the shrinkage of Cerenkov images. In order to compensate for this, we applied tighter cuts in the Crab analysis. As a result, the distribution for Crab is slightly wider than that for NGC 253 (which is observed near the zenith). The experimental result, however, agrees with the Monte Carlo prediction in case of the Crab observation. For NGC 253, the distribution is broader than the point spread function (PSF) by a factor of two. Our Monte Carlo simulations predicted that 73% of events from a point source would have , whereas in fact 56% of events were contained within this range.
3 Results
The spatial distribution of the gamma-rays from NGC 253 was studied using the so-called significance map. The thick solid contours in Fig. 2 are our results.

The 65% confidence level contour, which is roughly one standard deviation of our angular resolution, is shown and compared with an optical image from DSS2, which is shown by the solid thin contours. The size of the TeV emission region is of the same order as the optical image, or larger. The dotted contour is the 65%-contour obtained by the Crab observation. It is consistent with the Monte Carlo prediction of . That of the near-zenith observations was estimated to be . In order to estimate the telescope pointing accuracy, we analyzed bright stars (optical magnitude from 5 to 4) in other observations at various elevation angles, as the stars in the NGC 253 field of view are fainter than our detection limit. We conclude that the pointing uncertainty was within , which is less than the pixel size. The center of gamma-ray emission from the Crab observation agreed within this accuracy. The gamma-ray acceptance of the telescope gradually decreases beyond from the center of the field of view (dropping to half at ), and so we are unable to make a more detailed morphological study. It is clear, however, that the observed gamma-rays distribution from NGC 253 is inconsistent with emission from a point source.
In order to derive the flux level, we estimated the acceptances (effective areas) using Monte Carlo simulations (Enomoto et al. 2002a ). We compared our effective area with that of Whipple (Fig. 6 in Mohanty et al. moh98 (1998)), which are these after clustering and distance cut, i.e., before image parameter cut. Our effective area agreed with Whipple including the energy dependences. According to Fegan (feg96 (1996)), the threshold of Whipple telescope was the same as ours. The sensitivity for the CANGAROO telescope was represented by that for Crab-type source, i.e., a point source with Crab intensity at zenith. We calculated its acceptance and assumed the same background level, with the cut of degrees. It corresponds to 8 detection per hour, slightly higher than that of Whipple (Reynolds et al. rey93 (1993)). A difference appeared after the shape parameter cut, i.e., likelihood analysis. Our acceptance for the likelihood cut was as high as 86%. On the other hands, the “supercut” reduces it to 50% level (Fegan feg96 (1996): Table II). The both background levels are the same. Note that our background level depends on NSB, artificial light background and etc., because we used the experimental OFF sample as the background sample for Probability Density Functions.
The systematic uncertainty was calculated on a bin-by-bin basis by changing the cut values on the likelihood from 0.1 to 0.6 in steps of 0.1. The uncertainties are typically 30%. The energy scale uncertainties due to the mirror reflectivity, mirror segment distortions, and Mie scatterings were estimated to be 15% (point to point) and 20% (overall). The energy resolution was estimated to be 35% on an event by event basis. The energy resolution is bad because we could not assume source point event by event basis, i.e., we could not correct it using core distance. The spill over effect, therefore, is considered to be large for such soft energy spectrum. In order to derive the spectrum of NGC 253 self-consistently, we adopted the iteration method. At first we used an acceptance calculated by the simulation with a spectrum and we obtained the index of 3.70.3. We then iteratively used this fitted value in the simulations to re-derive the spectrum. This process rapidly converged at an index of 3.750.27. The same iteration procedure was carried out using a function with cutoff. It also showed a good convergence. The differential fluxes obtained in 2000 and 2001 agreed within these errors. A check was made using Crab nebula data (with an energy threshold of 2 TeV) and the derived flux agreed with previous measurements within the statistical errors () (Tanimori et al. tan98 (1998); Aharonian et al. aha00 (2000)). Also, the cosmic ray flux calculated from the background event rate was checked and found to match the expected rate within 10%. A more detailed description of the analysis will be presented elsewhere (Itoh et al. 2002a ). The differential fluxes are plotted in the spectral energy distribution (SED) shown in Fig. 3, together with measurements from other energy bands (Carilli et al. car92 (1992); Hummel et al. hum84 (1984); Cappi et al. cap99 (1999); Strickland et al. str02 (2002); Bhattacharya et al. bha94 (1994); Blom et al. blo99 (1999)).
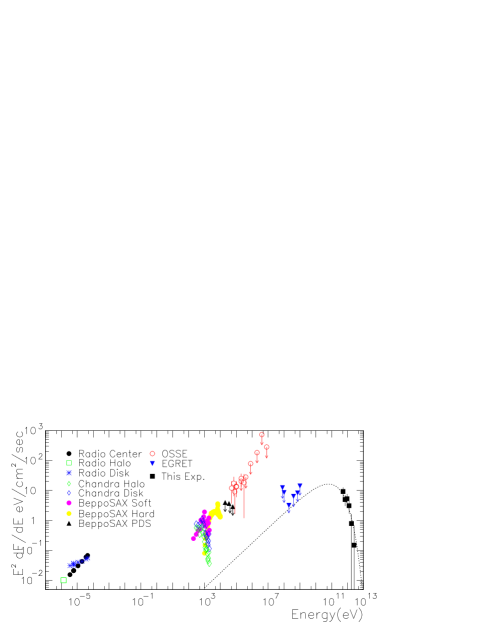
A simple power-law fit to the TeV spectrum of NGC 253 deviates greatly from the EGRET measurements at GeV energies (Blom et al. blo99 (1999)): a turn-over below the TeV region clearly exists. We fitted a power law with an exponential cut off, fixing the power-law index to 1.5, i.e., an inverse Compton–like spectrum (where the exponential term is exp, with a free parameter). The resulting improved fits are shown by the dotted curve in Fig. 3. The minimum power-law index providing an acceptable fit (based on the value) was 1.8 (2 limit). If the observed gamma-rays are produced by inverse Compton scattering of cosmic microwave background (CMB) photons, then the fitted spectrum suggests that the maximum energy of the parent electrons is around several TeV. The integral flux is estimated to be at energies greater than 0.52 TeV.
4 Discussions
The observations reported here are the first detection of TeV gamma-rays from a normal spiral galaxy (other than our own), and reveal the emission to be spatially extended and temporally steady. NGC 253 has been observed over a range of photon energies, as depicted in Fig. 3, however the SED is more difficult to interpret. The emission of 50–200 keV photons observed by OSSE (Bhattacharya et al. bha94 (1994)) was interpreted as being inverse Compton scattering of far-infrared photons from dust in the central region (Goldshmidt & Raphaeli gol95 (1995)). A simple extrapolation to higher energies exceeds the EGRET 2 upper limit (Blom et al. blo99 (1999)). Clearly, it is not possible to explain the OSSE and CANGAROO-II observations and the EGRET upper limits by invoking inverse Compton emission from a single population of electrons. The very large radio halo, extending over 10 kpc (Hummel et al. hum84 (1984); Carilli et al. car92 (1992)) and up to X-ray energies (Cappi et al. cap99 (1999)), suggests the existence of a population of very high-energy cosmic rays which may be responsible for the inverse Compton production of TeV gamma-rays (Itoh et al. 2002b ), quite separate from sources concentrated near the centre of the galaxy which emit the majority of the photons observed by OSSE.
NGC 253 is the first of a new class of object to be detected at TeV energies. The extended and steady nature of the emission makes it clear that the TeV gamma-rays are produced in a different environment than that of previously reported extragalactic sources of the active galactic nucleus class. Studies of NGC 253 will, like those of the LMC at GeV energies (Sreekumar et al. sre92 (1992)), provide the opportunity to learn more about the cosmic ray environment in galaxies like our own.
Acknowledgements.
We thank Prof. T. G. Tsuru for suggestions.References
- (1) Aharonian, F.A., Akhperjanian, A.G., Barrio, J.A., et al. 2000, ApJ, 539, 317
- (2) Aharonian, F.A., Akhperjanian, A.G., Barrio, J.A., et al. 2002, Astropart. Phys., 17, 459
- (3) Bhattacharya, D., The, L.-S., Kurfess, J.D., et al. 1994, ApJ, 437, 173
- (4) Blom, J.J., Paglione, T.A.D, & Carramiñana, A. 1999, ApJ, 516, 744
- (5) Carilli, C.L., Holdaway, M.A., Ho, P.T.P., & de Pree, C.G. 1992, ApJ, 399, L59
- (6) Cappi, M., Persic, M. Bassani, L., et al. 1999, A&A, 350, 777
- (7) Enomoto, R., Hara, S., Asahara, A., et al. 2002a, Astropart. Phys., 16, 235
- (8) Enomoto, R., Tanimori, T., Naito, T., et al. 2002b, Nature, 416, 823
- (9) Fegan, D. J. 1996, Space Sci. Rev. 75, 137
- (10) Goldshmidt, O. & Rephaeli, Y. 1995, ApJ, 444, 113
- (11) Hillas, A.M. 1985, Proc. 19th ICRC (La Jolla), 3, 445
- (12) Hummel, E., Smith, P., & van der Hulst, J.M. 1984, A&A, 137, 138
- (13) Itoh, C. Enomoto, R., Yanagita, S., Yoshida, T., et al. 2002a, in preparation.
- (14) Itoh, C., Enomoto, R., Yanagita, Y., Yoshida, T., & Tsuru, T.G. 2002b, in preparation.
- (15) Kawachi, A., Hayami, Y., Jimbo, J., et al. 2001, Astropart. Phys. 14, 261
- (16) Mohanty, G., Biller, S., Carter-Lewis, D. A., et al. 1998, AstroPart. Phys. 9, 15
- (17) Reynolds, P. T., Akerlof, C. W., Cawley, M. F., et al. 1993, ApJ 404, 206
- (18) Sreekumar, P., Bertsch, D.L., Dingus, B.L., et al. 1992, ApJ, 400, L67
- (19) Strickland, D.K., Heckman, T.M., Weaver, K.A., Hoopes, C.G., & Dahlem, M. 2002, ApJ, 568, 689
- (20) Tanimori, T., Sakurazawa, K., Dazeley, S.A., et al. 1998, ApJ, 492, L33
- (21) Vaucouleurs, G. de 1978, ApJ, 224, 710
- (22) Voelk, H.J., Aharonian, F.A., & Breitschwerdt, D. 1996, Space Sci. Rev., 75, 279