Chromospheric Dynamics of Betelgeuse from STIS Spectra1
Abstract
We present a high-resolution spectral analysis of Betelgeuse (M2 Iab). Between 1998 January and 1999 March four spatially resolved raster scans have been obtained with the STIS on the Hubble Space Telescope. The near-UV echelle spectra reveal double-peaked permitted emission lines of neutral and singly ionized metals, with self-absorbed line cores. We observe reversals in the intensity of both emission line components when scanning across the UV disk, for four unsaturated lines of Si i, Fe ii, Al ii], and Fe ii. We model the Si i 2516 resonance line with detailed non-LTE radiative transport calculations in spherical geometry, and constrain the mean velocity structure in the projected aperture area, for each scan position on the chromospheric disk. We infer the spatial velocity structure of Betelgeuse’s extended chromosphere, which reveals localized upflows in the western front hemisphere in 1998 September, that expand further toward the eastern hemisphere in 1999 March. The spatial scans exhibit simultaneous up- and downflows across the lower chromosphere with mean velocities of 2 . We infer non-radial (or non-coherent) mass movements during certain phases of the stellar variability cycle from these subsonic flows. We present a discussion of constructing semi-empiric models for the chromosphere of this cool supergiant, and of its temporal variability.
Harvard-Smithsonian Center for Astrophysics
1. Introduction: STIS and FOC Observations
We have observed Betelgeuse’s chromospheric disk four times with high spectral (E230M; R30,000) and spatial resolution between 1998 January and 1999 March with the -STIS. This period of 15 months spans the photometric variability period of 400420 d. observed for this cool supergiant. The wavelength range of these echelle spectra spans from 2275 Å to 3120 Å. The spatial raster scans are obtained in steps of 25 mas across the UV-disk, providing S/N-values ranging from 40 at intensity peakup (Target Position ‘TP’ 0.0) to 20 near the disk edge.
Figure 1 shows the STIS aperture (25 by 100 mas) scan positions with respect to near-UV continuum images, simultaneously obtained with the Faint Object Camera (FOC) through a passband of 300 Å centered at 2550 Å. Betelgeuse’s UV continuum chromosphere extends over ca. 120 mas, which is at least twice larger than its optical diameter, inferred from interferometric observations. These images of the chromosphere consist of four co-aligned dithered observations obtained for pointing offsets of about half a pixel size (1 pixel = 14.35 mas). The image intensities are normalized to the maximum pixel to improve and to compare the contrast of brighter (somewhat irregular) intensity patterns, mainly observed near the disk center. The variable fluxes suggest small changes in the thermodynamic conditions of the lower chromosphere where the near-UV continuum forms. They can result from small opacity changes caused by dynamic (and thermal) perturbations, originating from the deeper pulsating photosphere of this cool supergiant (for a discussion see Lobel & Dupree 2000). We find that the detailed distributions of these brightness patterns remain currently unresolved with the spatial resolution of the FOC.
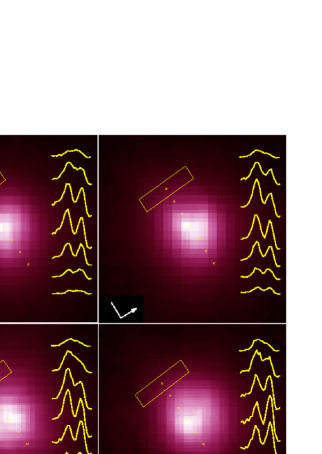
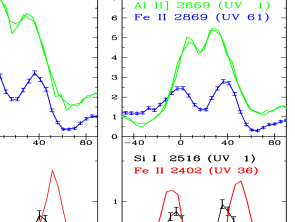
Figure 1 shows the emergent intensity distribution of the 2869 Fe ii line. The profile of this chromospheric emission line is double-peaked due to a central scattering core. The asymmetries observed in these self-absorbed profiles of unsaturated (and unblended) lines serve as accurate indicators of the velocity structure in their mean chromospheric line formation region. In 1998 September (lower left panel) we observe a significant inversion in the intensity ratio of both emission line components when scanning from TP 0.0 to 0.025 for Si i 2516, Fe ii 2869, Fe ii 2402 and Al ii] 2669, which we discuss in Section 4.
2. Atmospheric Model and Spectral Synthesis
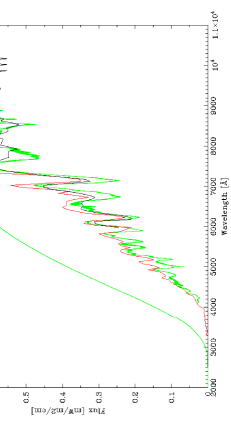
Figure 2 shows a comparison of low-resolution spectro-photometry (25 Å), observed in the optical (red and black lines) with a detailed synthesis of the optical spectral energy distribution. The synthetic spectrum (bold green line) is computed with a photospheric model (Kurucz 1996) of =3500 K, log()=0.5, =2 , and has been broadened to a very low resolution. The local optical continuum level is considerably below the stellar continuum level (thin green line), mainly due to enhanced opacity of TiO in this M2 star. The photospheric parameters have been determined by Lobel & Dupree (2000a) based on unblended metal absorption lines in the near-IR, where TiO opacity strongly diminishes. We do not detect the He i 10830 Å line in Ori.
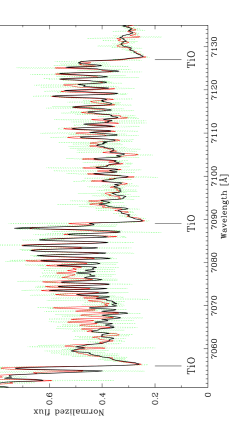
In Fig. 3 we compare a portion of the observed optical spectrum (black line) with the high-resolution synthetic spectrum (red line) computed in LTE. The model correctly reproduces the relative intensities of prominent TiO band-heads, and requires a (Gaussian) macrobroadening velocity of 12 to fit the observed shape of the spectral features. The green lines show the unbroadened spectrum. We obtain the same broadening value from unblended lines in the near-IR, indicating supersonic large-scale mass movements in the deeper and higher layers of the photosphere. The best fits (red lines) to these photospheric lines, observed with NOT-Sofin (black lines), are shown in the upper panels of Fig. 4. The lower panel shows the best fit (red line) to the TiO bandhead at 6782 Å, observed with WHT-UES between 1993-98. The band becomes too intense for the model with =3600 K (short-dashed line) because the higher temperature enhances its contrast with respect to the overall TiO background, which becomes weaker. The model with =3200 K (dash-dotted line) yields a V i line around 6785.4 Å that is too weak (after broadening) compared to the observed spectra.
3. Detailed NLTE Line Profile Modeling
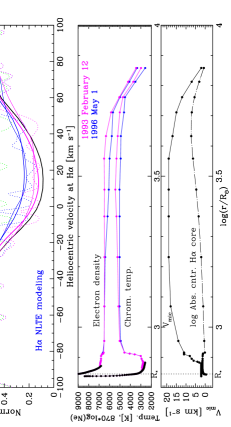
The upper panel of Fig. 5 shows best fits to the H line core (boldly drawn lines). The profiles are computed (thin drawn lines) in spherical geometry with the S-MULTI code (Harper 1992). The statistical equilibrium and rate equations are solved for a multi-level atom in a dynamic (1D) model of the atmosphere. This model incorporates the thermodynamic model for the warmer chromosphere, which we semi-empirically determine from these detailed NLTE fits to the H line depth and shape. H forms entirely in the chromosphere, which extends to 7 above the photosphere, for =700 . Our best fits yield temperatures not in excess of 5500 K, and =17 . Note how the H line core is distorted and appears asymmetric because of a hyperfine splitting band of photospheric Co i lines in its red wing. The chromospheric temperature and electron density structure are shown in the middle panel of Fig. 5, determined for 1993 Feb. and 1996 May. Without a chromosphere the H line core would remain invisible in the TiO background (green dotted line). The detailed fits to the shape and equivalent width of H also require supersonic microturbulence values, ranging up to 19 , in the mean chromospheric formation region (bottom panel of Fig. 5). These values are in stark contrast with the small microturbulent velocity of only 21 determined from the photospheric lines. We constrain the chromospheric temperature minimum of 2700 K from detailed fits to the depth of the sharp TiO bandhead at 8860 Å. We find clear observational evidence for intensity changes in the line depth of H, which correlate with constrast changes of the bandhead at 6782 Å, observed between 1993-98 (Fig. 4). This indicates important long-term correlations between the thermal conditions of the extended chromosphere and of the upper photospheric layers near the temperature minimum, where the TiO bands form. On the other hand, we could not detect significant changes in the depth and shape of the deep line cores of Fe i near 8868 Å and 8870 Å, observed with UES on 1993 January 13 and February 12.
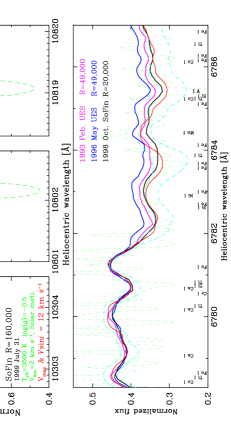
Figure 6 shows the detailed NLTE modeling of the Mg ii resonance doublet. We compute that the blue emission component of the line is blended with a strongly self-absorbed resonance line of Mn i 2794.8. This narrow chromospheric scattering core (together with a blend of Fe i) strongly contributes to the asymmetry of the emission components observed in the and lines of Betelgeuse with STIS (black line) and GHRS (blue line). Another self-reversed emission line of Mn i blends with the blue emission component of the line. We compute that the Mg ii lines are strongly opacity sensitive which results from the large chromospheric column density. The strong variability observed in the red wing of their broad and saturated self-absorption cores indicates long-term changes in the global chromospheric dynamics, which can be linked with the long-term changes of the chromospheric conditions we infer from H.
The lower panel of Fig. 6 compares observations of the Ca ii K line core (black and blue lines) with the detailed NLTE modeling of the line profile with complete frequency redistribution (CRD, magenta line), and with partial frequency redistribution (PRD, red line) in a hydrostatic atmosphere. We find that the PRD calculation yields a better match to the observed line width of the central K emission core. However, we also find that the differences between CRD and PRD calculations remain limited for the much broader Mg ii resonance lines. These prominent emission lines reveal important effects caused by radiative transfer in spherical geometry compared to calculations in plane parallel geometry. In spherical geometry light rays that escape under high position angles travel a shorter distance through the chromosphere than through a flat slab of gas. This adds less thermal and turbulent broadening to the rays, which yields narrower line wings. In Betelgeuse it outweighs the Doppler diffusion into the line wings of Mg ii. For the weak Ca ii emission wings, which form closer to the chromospheric temperature increase, the turbulent broadening remains small, and PRD effects become appreciable for the line width.
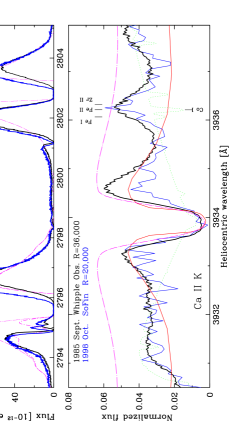
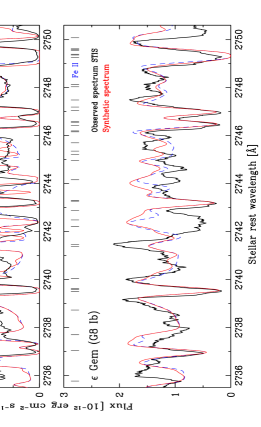
Figure 7 shows a portion of Ori’s near-UV spectrum observed with STIS at TP 0.0 in 1998 September (black line). The synthetic spectrum is computed with the mean thermodynamic model of Lobel & Dupree (2000a). The majority of the strong absorption troughs in the spectrum are self-absorption cores of many blended Fe i and Fe ii lines (dashed lines). Our detailed (LTE) synthesis with all the atomic species also identifies a number weaker Cr ii lines (red line in upper panel). The line list and the atomic line data are from Kurucz (1998), which includes semi-empirical calculations of the oscillator strengths. The synthesis correctly reproduces the overall appearance of the spectrum, although it also yields unobserved strong iron emission lines (i.e. Fe i 2737.6 and Fe ii 2744.9). The log()-values of these lines are small and are computed to be too strong. We do not detect emission lines of ions higher than the first ionization stage in the STIS spectra of Ori. The lower panel of Fig. 7 shows the synthetic spectrum of the hotter supergiant Gem (G8 Ib). Its chromospheric model requires a maximum kinetic temperature of 7050 K (compared to 5500 K for Ori), with a temperature minimum above 3100 K, to match the relative intensities of self-absorption cores with respect to the overall near-UV continuum. These cores are substantially deeper for Ori due to the larger geometric extension (i.e. column density) of the chromosphere (7 ), whereas for Gem the chromospheric extension does not exceed 1 (with 140 ). Our modeling also requires a macrobroadening velocity of 91 to match the chromospheric spectrum of Ori, but which is larger for Gem, with =21 . These highly supersonic velocities reveal important large-scale mass movements in the chromospheres of cool supergiants, which cannot be attributed to fast stellar rotation (or large sin values) for these evolved stars. Best fits to the near-UV spectra of earlier G-type supergiants as Dra (G2), and hybrid supergiants (as Aqr and Aqr), also reveal supersonic macroturbulent velocities for their thinner chromospheres (Lobel & Dupree 2000b).
4. Chromospheric Kinematics
Figure 8 shows an overview of the emergent intensity distributions across the chromospheric disk (in scan offsets of 25 mas from intensity peakup TP 0.0) for 3 prominent emission lines of Si i 2516 (black line), Fe ii 2869 (blue line), and Al ii ] 2669 (green line). For the four dates we observe that the stellar continuum emission reduces almost linearly from TP 0.025 to 0.075, about halving at each subsequent scan position. When scanning toward the limb this flux dimming for the bright emission lines, is however less than for the stellar continuum level. The red dashed lines show the (scaled) profiles of the Fe ii line obtained with the STIS high-resolution grating (R=114,000) on 1998 April 1. This spectrum is obtained with the larger 63 by 200 mas aperture, for 2 pointing offsets of 63 and 126 mas (but shown here at 0.05 and 0.075 mas). The comparison to the line shapes obtained with medium resolution (R30,000) reveals that the asymmetry and width of the profiles are not influenced by the spectral dispersion, and these medium resolution spectra are useful to infer the detailed chromospheric kinematics (i.e. its temporal and spatial variability).
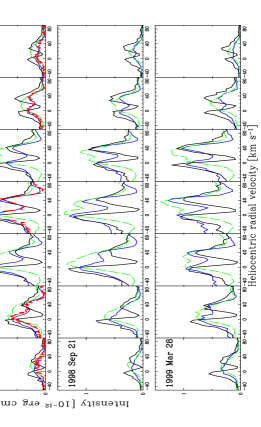
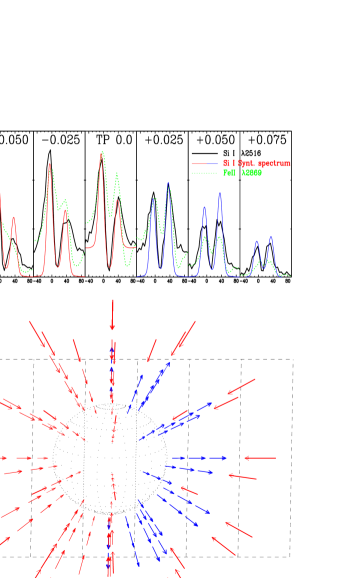
The raster scans of 1998 January and April display profiles of prominently self-reversed emission lines with stronger short-wavelength emission maxima compared to their long-wavelength maxima. These optically thick emission lines reveal global downflows in the line formation region across the chromosphere. The corresponding Doppler shifts by scattering material in front of the disk enhance the opacity in the red wing of the self-reversal, thereby suppressing the intensity of the red emission line component. In 1998 September we observe a remarkable reversal of the emission line asymmetry, scanning from TP 0.0 to TP 0.025. This prominent reversal is observed in four unblended emission lines shown in Fig. 9. These emission component intensity changes exceed the error bars of the line fluxes provided by the STIS calibration pipeline. In 1999 March we observe a further increase of the red emission component at TP 0.0, and the dimming of blue emission maxima for the negative TPs. It reveals systematic changes from a mean downflow into upflow over the line formation region of the central scattering cores. These simultaneous up- and downflows indicate global asymmetric (or nonradial) oscillations of Betelgeuse’s extended chromosphere.
5. Detailed Dynamic Spectral Modeling
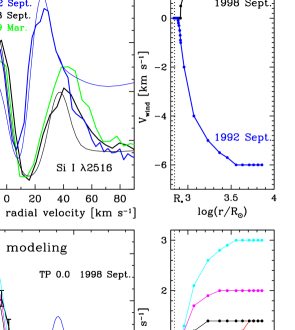
The Si i 2516 line also displays strong temporal changes besides the spatial variations shown in Fig. 8. In the upper left panel of Fig. 10 the (GHRS) disk-integrated self-absorption core of 1992 September reveals a blue-shift of 10 (bold blue line). The red emission component strongly exceeds the blue one, while the latter becomes stronger in 1998 September (bold black line). We determine the chromospheric velocity structure by means of detailed radiative transfer fits. We solve the statistical equilibrium for a Si i multi-level model atom, and compute emergent line profiles with our model atmosphere in spherical geometry. The best profile fit is obtained (thin blue line) for a chromospheric velocity structure accelerating outwards to 6 in 1992 (upper panel right). Carpenter & Robinson (1997) directly sampled this accelerating region. They detected in the scattering cores of 24 Fe ii lines a trend of increasing blueshift with increasing opacity or height. Our detailed modeling shows that the line shape of 1998 September is best fit (thin black line) with a collapsing velocity structure of 1.4 , which decelerates toward the photosphere. In 1999 September the scattering core shifts again blueward by 4 , enhancing the red emission component (bold green line).
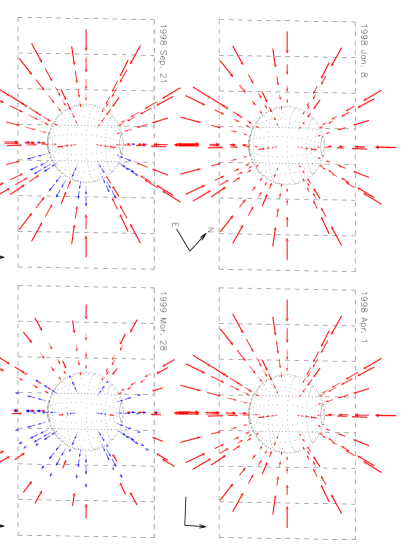
We model the spatially resolved observations of Fig. 8 by means of spatially resolved radiative transfer calculations. Light rays which traverse the chromospheric model are integrated along the width and height of the slit area, for each aperture position on the UV disk. The profile at TP 0.0 in the lower left panel of Fig. 10 (bold black line) is best fit (thin black line) for the velocity structure shown in the lower right-hand panel (black line). However, the blue emission component becomes too weak for a slowly decelerating velocity structure (red lines), whereas higher inflow velocities (magenta and cyan lines) suppress the long-wavelength emission line component too strongly. We determine that the reversal of component asymmetry in 1998 September between TP 0.0 and TP 0.025 of Fig. 9 corresponds to an outflow velocity in the lower chromosphere of 0.5 (blue lines in lower panels of Fig. 10). Hence, we find that the chromosphere assumes an inherently nonradial velocity structure in 1998 September. The lower panel of Fig. 11 shows a schematic 3D-representation of the chromospheric kinematics, which collapses on average, but in which upflow occurs from the deeper layers at TP 0.025. We observe that this outflow extends farther toward the eastern (left) front hemisphere in the raster scan of 1999 March (see Lobel & Dupree 2001). Notice how the line component asymmetry reduces near the limb due to the geometric projection of the chromospheric velocity field. This is also reproduced with our spatial radiative transfer modeling. We measure a constant (Gaussian) macrobroadening of 9 across the UV-disk, which is also observed in 1998 January when the scan axis was tilted by with respect to the east-west direction. This spatial invariance indicates that the marcobroadening is not determined by large rotation velocities (sin values). This macrobroadening is rather linked with an isotropic and uniform chromospheric velocity field which cannot be interpreted as due to the spatial inhomogeneity of a large-scale granular field that consists of a few convection cells.
6. Chromospheric Nonradial Oscillation
Our monitoring of the optical radial velocity curve of Betelgeuse at the Oak Ridge Observatory (CfA) indicates semiregular pulsations of the photosphere over quasi-periods of 400420 d. Optical long-term radial velocity curves provide amplitudes ranging to 6 (see Smith et al. 1989 for an overview). We observe a redshift of 45 during the monitoring with STIS. An average collapse of the photosphere in the line of sight during this period is consistent with the mean downflow we observe for the larger chromospheric envelope. The localized upflow we detect in the deeper chromospheric layers can result from photospheric internal gravity waves that drive or interfere with the chromospheric kinematics. Other observational indications for local nonradial pulsation of Ori have been provided by Hayes (1981). Long-term monitoring of linear polarization changes do not conform with a single global pulsation mode. However, local nonradial pulsations provide a means of producing asymmetries that distort the star’s spherical shape, and which can account for the changes of net polarization. De Jager & Eriksson (1992) computed that a 440 day pulsation period can be interpreted as the period of internal gravity waves (-modes) with a wavelength between /3 and /30. These low-order gravity waves (1) propagate nearly horizontally through the outer atmosphere. They may arise above the convective layers by overshoot motions. When triggered in the very upper photospheric layers they can propagate randomly into the lower chromosphere and cause the local upflow movements we detect from the spatially resolved STIS spectra.
7. Conclusions
We find evidence for the presence of complex velocity fields in Betelgeuse’s extended chromosphere. Our finding is based on spatially resolved spectra obtained with the STIS with high spectral resolution between 1998 January and 1999 March. We observe in the raster scan of 1998 September a prominent reversal in the intensity maxima of four self-absorbed chromospheric emission lines near the disk center. Detailed (NLTE) radiative transport modeling of these optically thick emission lines reveals mean subsonic flows, streaming in opposite directions through the deeper chromosphere. The temporal behavior of the near-UV emission lines indicates a chromospheric oscillation phase with global downflow between 1998 January and September. For the latter observation date, local upflow commenced in the lower chromosphere of the western front hemisphere, which extended farther toward the eastern hemisphere in 1999 March. We propose that the chromospheric kinematics is caused by nonradial or non-coherent oscillations during certain phases of the chromospheric variability cycle. Our detailed modeling reveals an increase of hydrodynamic velocities with the decrease of their length scales in Betelgeuse’s chromosphere. The very large chromospheric oscillations are subsonic and nonradial. The large-scale macroturbulence is isotropic, with a velocity around the isothermal sound speed in the chromosphere (with =5500 K). The small-scale microturbulent velocities are subsonic in the the photosphere and become highly supersonic in the chromosphere.
Acknowledgments.
I thank Drs. A. K. Dupree, R. Kurucz, E. Avrett, and H. Uitenbroek for useful discussions. Dr. R. Gilliland is thanked for assistance with the HST proposal 7347 of the STIS observations. This research is supported in part by an STScI grant GO-5409.02-93A to the Smithsonian Astrophysical Observatory.
References
Carpenter, K. G., & Robinson R. D. 1997, ApJ, 479, 970
de Jager, C., & Eriksson, K. 1992, in Instabilities in Evolved Super- and Hypergiants, ed. C. de Jager & H. Nieuwenhuijzen (Proc. Royal Netherlands Academy of Arts and Sciences, Sect. Physics, First Series, Part 36), 117
Harper, G. 1994, MNRAS, 268, 894
Hayes, D. P. 1981, PASP, 93, 752
Kurucz, R. L. 1996, in ASP Conf. Proc. 108, Model Atmospheres and Spectrum Synthesis, ed. S. Adelman, F. Kupka, & W. Weiss (San Francisco: ASP), 160
Kurucz, R. L. 1998, in ASOS6, Abstracts of the 6th Atomic Spectroscopy and Oscillator Strengths Meeting (Victoria: Univ. Victoria), 89
Lobel, A., & Dupree, A. K. 2000a, ApJ, 545, 454
Lobel, A., & Dupree, A. K. 2000b, BAAS, 197, #44.15
Lobel, A., & Dupree, A. K. 2001, ApJ, 558, 815
Smith, M. S., Patten, B. M., & Goldberg, L. 1989, AJ, 98, 2233