Sensitive Limits on the Water Abundance in Cold Low Mass Molecular Cores
Abstract
We present SWAS observations of water vapor in two cold star-less clouds, B68 and Core D in Ophiuchus. Sensitive non-detections of the transition of o-H2O are reported for each source. Both molecular cores have been previously examined by detailed observations that have characterized the physical structure. Using these rather well defined physical properties and a Monte-Carlo radiation transfer model we have removed one of the largest uncertainties from the abundance calculation and set the lowest water abundance limit to date in cold low-mass molecular cores. These limits are (o-H2O) (relative to H2) and (o-H2O) in B68 and Oph D, respectively. Such low abundances confirm the general lack of ortho-water vapor in cold (T K) cores. Provided that the ortho/para ratio of water is not near zero, these limits are well below theoretical predictions and appear to support the suggestion that most of the water in dense low-mass cores is frozen onto the surfaces of cold dust grains.
1 Introduction
Water is an important molecule in the interstellar medium (ISM) because it links chemistry in the ISM to comets and planetary systems and provides crucial aid in constraining the chemistry of astrophysical systems (Bergin et al., 2000). Recently NASA’s Submillimeter Wave Astronomy Satellite (SWAS) and ESA’s Infrared Space Observatory (ISO) have provided the first unambiguous glimpse of water in the ISM. Because the SWAS instrument is pre-tuned to the ground state rotational transition of ortho-H2O, it is sensitive primarily to water in the quiescent or coldest regions of molecular clouds. In contrast, ISO sampled higher energy transitions that consequently probed warm gas found in shocks or in close proximity to young embedded stars. One of the surprises from the analysis of SWAS results is that the derived water abundance is unexpectedly low, with values (o-H2O) (relative to H2) found in a variety of regions (Snell et al. 2000a,b,c). These abundances conflicted with theoretical expectations and several suggestions have been provided to account for the discrepancy, with the principal solution for cold gas being the freeze-out of water onto grain surfaces (Bergin et al., 2000; Spaans & van Dishoeck, 2001; Viti et al., 2001; Charnley, Rodgers, & Ehrenfreund, 2001). Moreover, ISO and SWAS detections of water vapor in absorption produced results in disagreement with the emission line analysis. Absorption lines are more straightforward to analyze and provide water abundances of (o-H2O) , in agreement with theory (Cernicharo et al., 1997; Neufeld et al., 2000; Moneti, Cernicharo, & Pardo, 2001). These differences can be reconciled provided that the freeze-out of water is greater in denser regions, which are seen in emission, as opposed to the low density gas, with correspondingly longer depletion timescales, seen in absorption (Bergin et al., 2000).
Nonetheless there are some well discussed uncertainties in the analysis of water emission lines detected by SWAS (Snell et al. 2000a,b,c,). These arise primarily from the fact that only a small column of water is required to produce optically thick emission. The situation is slightly simplified, because the critical density for the transition ( cm-3) is higher than typical densities found in molecular cores. Under this condition every photon that is collisionally created eventually escapes and the water emission, although optically thick, is effectively thin (Wannier et al., 1991; Snell et al., 2000a). This fact aids in constraining the abundance, but crucial assumptions must be made regarding the source physical structure. Assuming that the emission arises predominantly from high density gas, simple single component models were constructed (i.e. single density and temperature along the line of sight), resulting in the above abundance estimates (Snell et al. 2000a,b,c). However, uncertainties in the density are directly reflected in the abundance, and a single density characterizing the entire line of sight is itself an approximation.
More realistic physical structures were examined for a few molecular cores using a Monte-Carlo radiative transfer code (Ashby et al., 2000a). This analysis supported the simple single component results. However, there are complications. For instance in S140, a separate analysis argues that a clumpy cloud model is more appropriate, although the resulting abundance estimates are similar (Spaans & van Dishoeck, 2001). Sources that offer the most promise to set good limits or determinations of the water abundance are therefore ones that are largely isolated, and have well established physical properties. In general, giant molecular cloud cores, such as S140, do not fit this criteria as they have been suggested to have clumpy physical structures which are difficult to model definitively. On the other hand, advances in the resolution and sensitivity of infrared (IR) and submillimeter continuum arrays have begun to provide a wealth of information on the physical structure of low mass cores. Studies using these instruments effectively apply similar techniques in which azimuthally averaged dust column density profiles are combined with assumptions regarding the geometry and a gas-to-dust ratio to determine the H2 density profile.
We present here SWAS observations of two molecular cores, B68 and Oph D, that have been subject to these techniques and thus have rather reliable estimates of the source physical structure. Using these physical models and SWAS observations we have set the lowest limit to date on the water abundance in cold low mass cores. The limits are below pure gas-phase chemical predictions and support the assertion that most of the water is likely frozen onto grain surfaces in cold dense cores of molecular clouds.
2 Observations and Results
Between Feb. 25, 2001 to Mar. 8, 2001 SWAS observed B68 in the transition of o-H2O at 556.936 GHz for a total of 28 hours of on-source integration. Similarly during Sept. 7-10, 2001 SWAS observed Oph D for a total of 24.6 hrs (on-source). System temperatures were typically 2500 K with minimal scatter around that value. The spacecraft was used in nod mode, involving alternately nodding the spacecraft to an off-source position free of emission. For B68 the elliptical 33 45 beam was centered on 17:22:38.2, 23:49:34 (J2000) and towards Oph D, 16:28:30.4, 24:18:29 (J2000). All data were reduced with the standard SWAS pipeline described by Melnick et al. (2000). Towards both cores, along with o-H2O, SWAS simultaneously observed transitions of [C I] (3P1 3P0), 13CO (J = 5 4), and O2 (). In this work we primarily use the o-H2O and 13CO data, with a velocity resolution of 1.0 km s-1, and a sampling of 0.6 km s-1. All data are presented here on the T scale and for subsequent analysis are scaled by the main beam efficiency of 90% (Melnick et al., 2000).
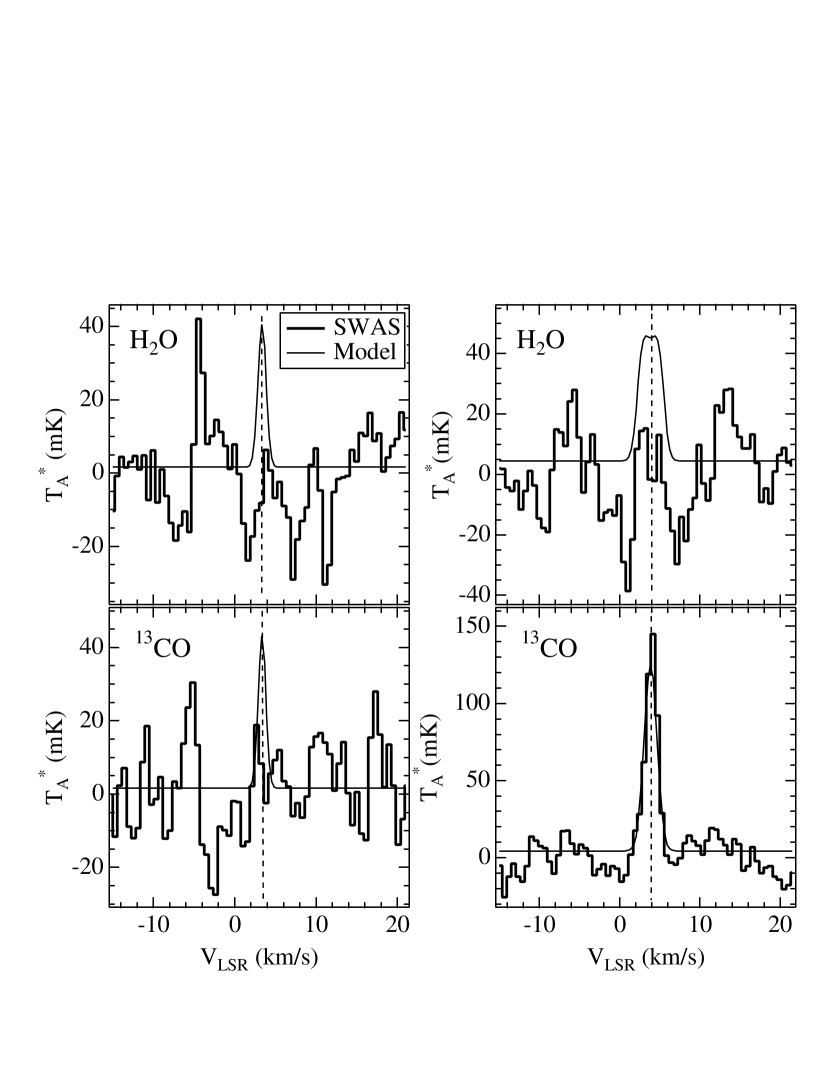
Figure 1 shows spectra of the transition of o-H2O and 13CO J taken towards B68 and Oph D. It is apparent that there are no water detections toward either source. In B68 the 3 upper limit is T 36 mK and in Oph D the limit is 45 mK. The J transition of 13CO was not detected towards B68 with a similar limit as o-H2O, confirming the cold (T 10) nature of this source. 13CO J is detected towards Oph D with an integrated intensity of 0.30 K km s-1, a peak antenna temperature of T 150 mK, and v km s-1.
3 Monte-Carlo Models of Water Emission
To estimate the water abundance we draw upon previous determinations of the density structure derived from observations of dust in emission or absorption (Motte, Andre, & Neri, 1998; Alves, Lada, & Lada, 2001; Bacmann et al., 2000). Towards both clouds, the SWAS beam encompasses the entire area seen in transitions of molecules such as C18O, CS, and N2H+. Higher spatial resolution observations of molecular cores in these other tracers are able to determine the extent of emission, which along with the radial density profile with radius, permits a more accurate analysis of abundances (Jessop & Ward-Thompson, 2001; Tafalla et al., 2002; Bergin et al., 2002; Hotzel et al., 2002). Because of the large beamsize our initial procedure is to assume a simple model with an abundance of o-H2O that is constant with cloud depth. However, chemical models of centrally condensed objects predict that lower abundances should exist in the dense central regions where molecules freeze onto grain surfaces more frequently (Rawlings, Hartquist, Menten, & Williams, 1992). To account for this possibility we have also examined whether a water abundance profile predicted by theory is in conflict with our observations. This model is applied to B68 which has a large amount of additional observational constraints.
The water abundance profile, along with the adopted density, temperature, and velocity width profiles, is used as input into the spherical one-dimensional Monte-Carlo radiative transfer code discussed by Ashby et al. (2000b).111Rates of excitation of water with ortho-H2 are often an order of magnitude greater than rates for lower energy para-H2 (Phillips, Maluendes, & Green, 1996). For our calculations of cold clouds we have assumed an ortho/para-H2 ratio of 0.1 and extrapolated the rates down to 10 K. If the ratio is lower our results will be essentially unchanged; a higher ratio would result in lower abundance limits. The adopted physical profiles for each source are motivated below, but in each case we have assumed a static cloud. The radiative transfer model determines the expected emission spectra, which is compared to the observed 3 upper limit on the antenna temperature. The water abundance is then iterated until the predicted emission matches the limit. To account for oversampling in the SWAS spectrometer, we have convolved the model data with a Gaussian that has a width of 1.45 MHz. Because of the weak IR continuum radiation field in both cores the effects of infrared pumping are negligible.
3.1 B68
The B68 globule is located at a distance of 125 pc (de Geus, de Zeeuw, & Lub, 1989). Alves, Lada, & Lada (2001) examined this isolated pre-stellar core using near-infrared extinction techniques. The resulting extinction map was used to constrain the radial density profile, which is well fit by a pressure confined, self-gravitating cloud near equilibrium (Bonnor-Ebert sphere). Recently, Bergin et al. (2002, hereafter BAHL02) and Hotzel et al. (2002) have examined this cloud in the low-J mm-wave transitions of various molecules. Both found that in the dense core center, C18O molecules are systematically depleted onto grain surfaces.
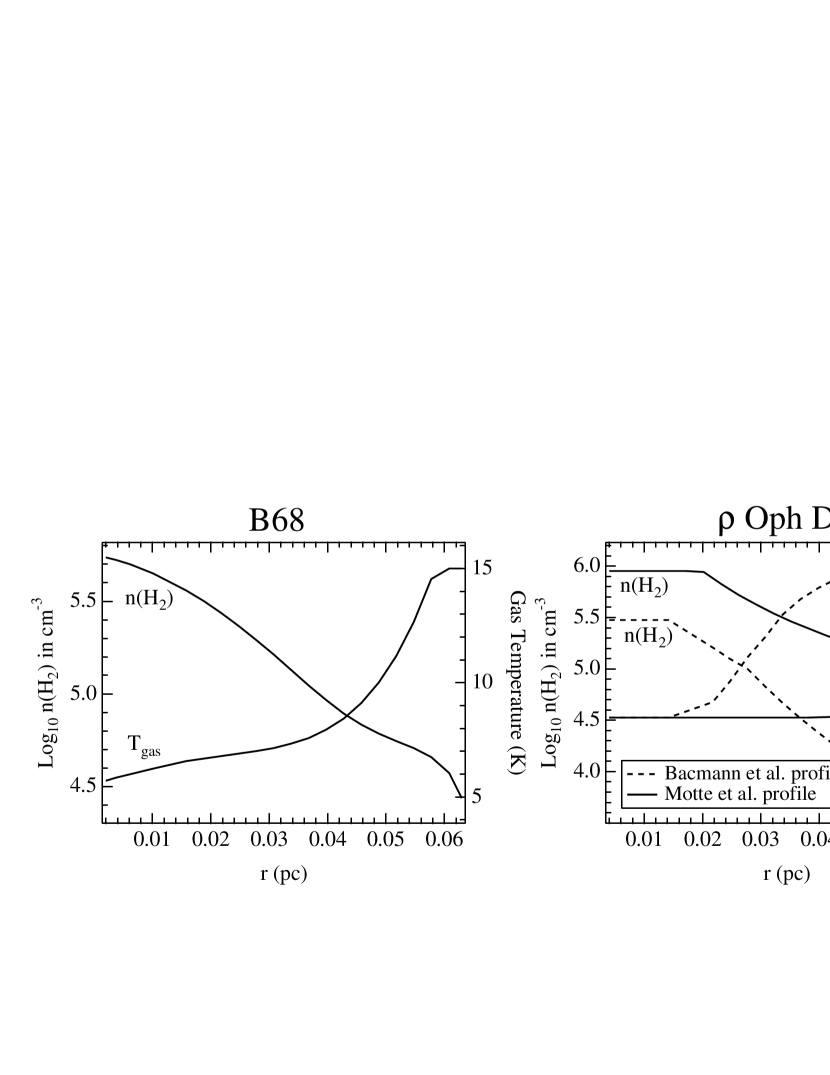
We use the model described by BAHL02 to estimate the water abundance. In this model the column density is constrained by the visual extinction data and the line width by C18O emission (BAHL02). The assumed density profile is that derived from near-IR extinction measurements, while the temperature structure is that for dust in a Bonnor-Ebert sphere derived by Zucconi, Walmsley, & Galli (2001).222However, for the temperature, a uniform reduction of 2 K was required to match the multi-transitional N2H+ observations of BAHL02. The density and temperature structure are provided in Figure 2. This model assumes a static cloud, but includes contributions from thermal and turbulent line widths with the latter increasing as a function of radius.
As a check on the assumptions regarding the cloud physical structure we first examine the non-detection of 13CO J . To model this emission we use the depleted C18O abundance profile given by BAHL02 scaled by a factor of 7.8 (accounting for 12C/13C = 75; 16O/18O = 500). Placing this into the radiative transfer code produces a peak temperature of T mK, which is close to the observed limit of 36 mK. Since the 13CO analysis does not significantly conflict with current limits, we then use the iterative procedure outlined previously to estimate the 3 limit on the water abundance in B68, which is (o-H2O) . The resulting emission spectra from the radiative transfer model are shown in Figure 1.333If the core radius is allowed to extend beyond 0.06 pc, as estimated by the near-IR analysis, then the abundance limit will be reduced.
BAHL02 linked a radiative transfer code to a chemical model including the effects of molecular depletion to set limits on the freeze-out of C18O molecules. Water is more tightly bound to grain surfaces when compared to CO (Sandford & Allamandola, 1988). Therefore it is more difficult to remove and can be expected to be significantly depleted in the center, perhaps with larger depletions than CO. To see if current chemical theory is in in conflict with our observational results we compare the predictions of a gas-grain chemical model to the observations.
To this end we use the gas-grain chemical model discussed in BAHL02. The only difference in the chemistry is the additional inclusion of the grain surface formation of water via hydrogenation of oxygen as required by previous studies (Bergin et al., 2000; Viti et al., 2001; Charnley, Rodgers, & Ehrenfreund, 2001). This model incorporates the cloud density and temperature profile shown in Figure 2. We also include the observed cloud extinction profile which increases to AV = 17m at the core center. The chemical model predicts the profile of water abundance with cloud radius which, along with the same physical profile, are placed as inputs to the radiative transfer calculations. Due to the inclusion of gas-grain interactions the chemical model does not reach a steady state and the predicted abundance profile strongly varies with time. Fortunately BAHL02 find that the observed C18O and N2H+ emission in B68 can be simultaneously reproduced by the model at t yr (later times predict increasing depletion and, in consequence, less C18O emission than observed). We therefore adopt this time in our analysis to examine whether the H2O abundance profile predicted by the same model is in conflict with SWAS observations.
In Figure 3 we provide the predicted water vapor and ice abundances as a function of depth. Also shown are the abundance of atomic oxygen and the best fit constant abundance. The chemical model predicts that the water vapor abundance sharply declines at the cloud edge due to photodissociation, rises to a peak at A, and then uniformly declines towards higher depths. As seen in Figure 3, nearly all of the water and oxygen (in the form of H2O) is frozen onto dust grains. Placing the results of this model into the radiation transfer code we predict a peak temperature in the o-H2O 557 GHz line of T = 18 mK below the 3 upper limit. As long as the age is yr our observations are consistent with this model. Thus current predictions of water abundance profiles by chemical models are not in conflict with observations. Given the potential of B68 as a template for testing chemical models it will be useful in the future to re-examine these results in light of additional molecular observations.
3.2 Oph D
The Oph D molecular core is a star-less object located in the Ophiuchus complex at a distance of 160 pc. The core was detected in absorption against the galactic mid-IR background using ISOCAM (Bacmann et al., 2000) and in 1.3 mm continuum emission (Motte, Andre, & Neri, 1998). These studies have provided good constraints on the core density profile, although there are differences in the details. Both agree that the density declines as beyond AU; within this radius the density is found to be constant, ranging from cm-3 (Bacmann et al. 2000) to cm-3 (Motte et al. 1998). Both studies derive a core radius of 13,000 AU (0.063 pc). However Motte, Andre, & Neri (1998) find a sharp edge to the South-West but, in the East-West direction, the dust emission merges with the ambient cloud. With these differences core mass estimates range from 2 – 5 M⊙. In the following we examine both density distributions.
Unlike B68, where a detailed model exists, there is no information regarding the radial dependence of the velocity field or temperature in Oph D. For temperature, the sub-millimeter dust continuum survey of Ophiuchus by Johnstone et al. (2000) did not include core D, but for numerous other cores in the cloud they find Tdust K, which may be considered the expected range. Given the lack of detailed information, we adopt the expression for the equilibrium dust temperature given by Burton, Hollenbach, & Tielens (1990), further assuming that T Tgas. This expression provides an estimate of the dust temperature depending on the extinction and of the local enhancement of the ultra-violet radiation field, G0. For the A profile we integrate the observed density profile with radius in a pencil beam along the line of sight. Because of the presence of early type stars the local radiation field is enhanced throughout the Oph cloud and detailed modeling of the far-infrared emission by Liseau et al. (1999) finds G towards core D.
The procedure is to first examine how well the physical model(s) reproduce the SWAS 13CO J emission and then apply the “best” model to the water emission. If we use the Bacmann et al. (2000) density profile, the above temperature structure, and a constant turbulent width of 1.5 km s-1 we can match the observed 13CO emission provided (13CO) . This abundance is higher than the expected range for undepleted gas.444Using the C18O abundance derived in the extended Ophiuchus cloud by Frerking, Langer, & Wilson (1982) with plausible isotope ratios (16O/18O = 500; 12C/13C = 45 – 90) the 13CO abundance is expected to be 1 – 2 . Since this source is a cold pre-stellar object we expect to see some evidence for 13CO depletion. For instance in B68, and several other similar pre-stellar objects, large depletions are observed (Bergin et al., 2002; Jessop & Ward-Thompson, 2001; Tafalla et al., 2002).
Adopting the denser profile of Motte, Andre, & Neri (1998) we can reproduce observed 13CO emission at a lower abundance of 4 . The predicted emission spectra from this model is shown superposed on the observational data in Figure 1. For reproducing the water emission, the Motte, Andre, & Neri (1998) model is favored due to the anticipation of CO depletion. Adopting this model for the observations we derive (o-H2O) , relative to H2(3). The model that matches the 3 limit is also provided in Figure 1. If we use the Bacmann model the abundance limit is (o-H2O) .
4 Conclusions
We have derived upper limits to the water abundance in two clouds with well described physical properties. These abundance limits are, (o-H2O) for core D in Oph and (o-H2O) in B68. These limits are below those previously set for a cold star-less object by Snell et al. (2000c) (TMC-1: (o-H2O) ). In this Letter two cores have been subject to a more detailed and careful study which essentially confirms the general lack of ortho-water vapor in cold (T K) molecular cores. Provided the ortho/para ratio of water is 0.03 then these results are in agreement with the assertion that the water abundance in low mass objects is well below the predictions of pure gas phase chemistry. In the case of B68, these observations are compared to theoretical predictions of a gas-grain chemical model, which have been directly placed into the radiative transfer calculations. We find that these model predictions are not in conflict with observations. However, due to the large SWAS beam, which encompasses the entire extent of the observed molecular emission seen in other tracers, we cannot discriminate between simple constant abundance models and those with complex abundance structure constrained by theory. Given the wide-spread molecular depletion found in B68 and similar cores (Bergin et al., 2002; Hotzel et al., 2002; Tafalla et al., 2002), it is likely that most of the water in low mass dense cores is frozen on the surfaces of cold dust grains.
References
- Alves, Lada, & Lada (2001) Alves, J. ;., Lada, C. J., & Lada, E. A. 2001, Nature, 409, 159 (ALL01)
- Ashby et al. (2000b) Ashby, M. L. N. et al. 2000b, ApJ, 539, L115.
- Ashby et al. (2000a) Ashby, M. L. N. et al. 2000a, ApJ, 539, L119.
- Bacmann et al. (2000) Bacmann, A., André, P., Puget, J.-L., Abergel, A., Bontemps, S., & Ward-Thompson, D. 2000, A&A, 361, 555.
- Bergin et al. (2002) Bergin, E.A., Alves, J., Huard, T.L., & Lada, C.J. (2002), ApJ, 570, L101 (BAHL02)
- Bergin et al. (2000) Bergin, E. A. et al. 2000, ApJ, 539, L129.
- Burton, Hollenbach, & Tielens (1990) Burton, M. G., Hollenbach, D. J., & Tielens, A. G. G. M. 1990, ApJ, 365, 620.
- Cernicharo et al. (1997) Cernicharo, J. et al. 1997, A&A, 323, L25.
- Charnley, Rodgers, & Ehrenfreund (2001) Charnley, S. B., Rodgers, S. D., & Ehrenfreund, P. 2001, A&A, 378, 1024.
- de Geus, de Zeeuw, & Lub (1989) de Geus, E. J., de Zeeuw, P. T., & Lub, J. 1989, A&A, 216, 44.
- Frerking, Langer, & Wilson (1982) Frerking, M. A., Langer, W. D., & Wilson, R. W. 1982, ApJ, 262, 590.
- Hotzel et al. (2002) Hotzel, S., Harju, J., Juvela, M., Mattila, K., & Haikala, L.K. 2002, A&A, submitted
- Jessop & Ward-Thompson (2001) Jessop, N. E. & Ward-Thompson, D. 2001, MNRAS, 323, 1025
- Johnstone et al. (2000) Johnstone, D., Wilson, C. D., Moriarty-Schieven, G., Joncas, G., Smith, G., Gregersen, E., & Fich, M. 2000, ApJ, 545, 327.
- Liseau et al. (1999) Liseau, R. et al. 1999, A&A, 344, 342
- Melnick et al. (2000) Melnick, G. J. et al. 2000, ApJ, 539, L77
- Moneti, Cernicharo, & Pardo (2001) Moneti, A., Cernicharo, J. ;, & Pardo, J. R. ;. 2001, ApJ, 549, L203.
- Motte, Andre, & Neri (1998) Motte, F., Andre, P., & Neri, R. 1998, A&A, 336, 150
- Neufeld et al. (2000) Neufeld, D. A. et al. 2000, ApJ, 539, L111
- Phillips, Maluendes, & Green (1996) Phillips, T. R., Maluendes, S., & Green, S. 1996, ApJS, 107, 467
- Rawlings, Hartquist, Menten, & Williams (1992) Rawlings, J. M. C., Hartquist, T. W., Menten, K. M., & Williams, D. A. 1992, MNRAS, 255, 471
- Sandford & Allamandola (1988) Sandford, S. A. & Allamandola, L. J. 1988, Icarus, 76, 201
- Snell et al. (2000a) Snell, R. L. et al. 2000a, ApJ, 539, L93.
- Snell et al. (2000b) Snell, R. L. et al. 2000b, ApJ, 539, L97.
- Snell et al. (2000c) Snell, R. L. et al. 2000c, ApJ, 539, L101.
- Spaans & van Dishoeck (2001) Spaans, M. & van Dishoeck, E. F. 2001, ApJ, 548, L217.
- Tafalla et al. (2002) Tafalla, M., Myers, P.C., Caselli, P., Walmsley, C.M., & Comito, C. 2002, ApJ, 569, 815
- Viti et al. (2001) Viti, S., Roueff, E., Hartquist, T. W., Pineau des Forêts, G., & Williams, D. A. 2001, A&A, 370, 557.
- Wannier et al. (1991) Wannier, P. G. et al. 1991, ApJ, 377, 171.
- Zucconi, Walmsley, & Galli (2001) Zucconi, A., Walmsley, C. M., & Galli, D. 2001, A&A, 376, 650