The Dynamical State of Barnard 68:
A Thermally Supported, Pulsating Dark Cloud.
Abstract
We report sensitive, high resolution molecular-line observations of the dark cloud Barnard 68 obtained with the IRAM 30-m telescope. We analyze spectral-line observations of C18O (1–0), C32S(2–1), C34S (2–1), and N2H+ (1–0) in order to investigate the kinematics and dynamical state of the cloud. We find extremely narrow linewidths in the central regions of the cloud, km s-1and km s-1for C18O and C34S , respectively. These narrow lines are consistent with thermally broadened profiles for the measured gas temperature of 10.5 K. We determine the thermal pressure to be a factor 4 – 5 times greater than the non-thermal (turbulent) pressure in the central regions of the cloud, indicating that thermal pressure is the primary source of support against gravity in this cloud. This confirms the inference of a thermally supported cloud drawn previously from deep infrared extinction measurements (Alves, Lada & Lada, 2001). We also find the molecular linewidths to systematically increase in the outer regions of the cloud, where we calculate the thermal pressure to be between 1 – 2 times greater than the turbulent pressure. We find the distribution of line-center radial velocities for both C18O and N2H+ to be characterized by systematic and well-defined linear gradients across the face of the cloud. The rotational kinetic energy is found to be only a few percent of the gravitational potential energy, indicating that the contribution of rotation to the overall stability of the cloud is insignificant. However, the C18O and N2H+ velocity gradients differ from each other in both magnitude and direction, suggesting that the cloud is differentially rotating, with the inner regions rotating slightly more slowly than the outer regions. Finally, our observations show that C32S line is optically thick and self-reversed across nearly the entire projected surface of the cloud. The shapes of the self-reversed profiles are asymmetric and are found to vary across the cloud in such a manner that the presence of both inward and outward motions are observed within the cloud. Moreover, these motions appear to be globally organized in a clear and systematic alternating spatial pattern which is suggestive of a small amplitude, non-radial oscillation or pulsation of the outer layers of the cloud about an equilibrium configuration.
1 Introduction
Barnard 68 is a fine example of a small round and optically opaque dark molecular cloud known as Bok Globule. Recently Alves, Lada & Lada (2001, hereafter ALL01,) used deep near-infrared extinction measurements to map the structure of this globule in a detail previously unsurpassed for any molecular cloud. In particular, they were able to construct a highly resolved radial density profile of the cloud, spanning its entire 100 arc sec (104AU) extent with 5 arc sec (500 AU) angular resolution. They found the measured radial density distribution of the globule to be in impressive agreement with the theoretical predictions for a Bonnor-Ebert sphere, that is, a truncated isothermal sphere bounded by a fixed external pressure.
The extremely close agreement between observation and theory for this cloud implies a number of interesting observable consequences (or predictions) for its physical state. In particular, thermal pressure is likely to be an important, if not dominant, source of support for the cloud against gravitational collapse. In this sense, the physical state of B68 would not be typical, since turbulence is the dominant source of internal bulk motions and support in most molecular clouds. Further evidence in support of the idea that thermal, not turbulent, motions dominate the internal pressure of the cloud followed from a more detailed analysis of the extinction data. Alves, Lada & Lada (2002) found the surface density structure of the cloud to be extremely smooth placing a limit on the magnitude of random fluctuations in the surface density of 5% over angular scales ranging from 3 – 200 arc sec ( 300 – 20,000 AU). Such smooth structure seems incompatible with expectations for turbulent cloud models (Padoan, Jones & Nordlund, 1997; Juvela, 1998). An important observational consequence for a thermally dominated cloud would be the presence of very narrow molecular-line widths. One might also expect that random variations in molecular-line center velocities (of optically thin species) across the cloud would be small compared to the sound speed in the cloud. Both of these aspects of a cloud’s velocity field can be directly investigated with sensitive, high frequency resolution molecular-line observations.
To further examine and better constrain the physical nature of this unusual cloud we have obtained extensive, high angular resolution and high signal-to-noise observations of B68 in a number of interesting molecular species, including C18O, C32S, C34S, and N2H+. These observations were designed, in part, to assess the relative roles of turbulence and thermal pressures for the support of this cloud against gravity. Because B68 was found to be formally unstable and near the critical condition or pivotal point for gravitational collapse (ALL01), we also designed our observational program to measure the cloud’s dynamical state (i.e., is B68 rotating, expanding, collapsing or static?).
2 Telescope, Spectrometer and Receivers
We used the 30m IRAM millimeter-wave telescope located at Pico Valeta in Spain for the observations reported here. Observations were obtained during three periods: 2000 April and August and 2001 April. The dual mixer, dual-channel receiver was tuned to observe the J = 1–0 transition of C18O at 109.78218 GHz, the 1–0 transition of N2H+ at 93.173178 GHz, the J = 2–1 transitions of C32S at 97.980968 GHz and C34S at 96.412982 GHz. Observations of the J= 1–0 transition of C17O and the J = 3–2 transition of N2H+ were also obtained, and reported elsewhere Bergin et al. (2002). The half-power beamwidth provided by the telescope was 22”, 25”, and 26” for CO, CS and N2H+, respectively. System temperatures were typically in the range of 160 – 190 K. Observations of the various molecular transitions were acquired in the frequency-switched mode. The spectrometer was an autocorrelator configured to provide velocity resolutions of 0.053 km s-1for C18O , 0.06 km s-1for C34S , 0.137 km s-1for N2H+, and 0.03 km s-1for C32S observations.
3 Observational Results
3.1 Integrated Intensity Maps
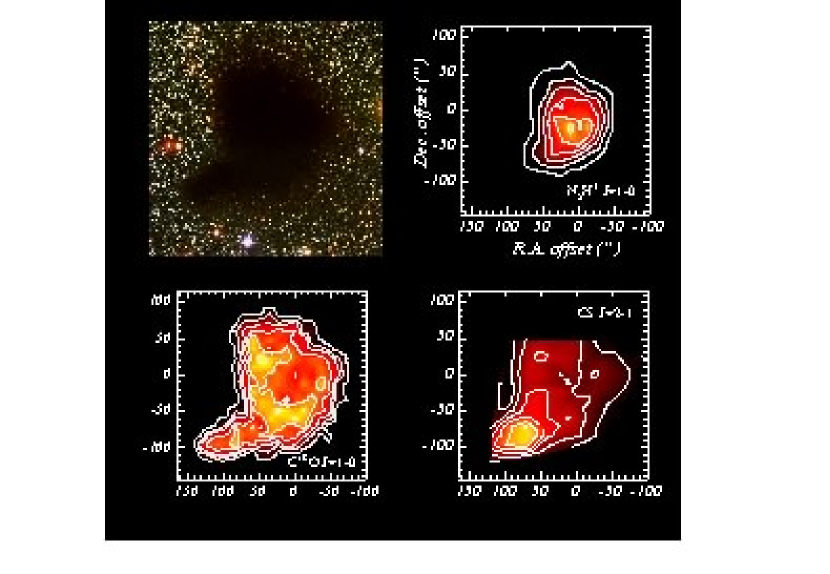
We have made integrated intensity maps of C32S, C18O and N2H+ across the B68 cloud. These maps are displayed in Figure 1. The field that was mapped in CO and CS encompassed a larger area than that mapped in N2H+. The CO observations were sampled at the Nyquist rate. The CS and N2H+ observations were obtained with Nyquist sampling in the inner 50” of B68 and with full beam honeycomb sampling in the outer part of the map. The CO and CS distributions show very different morphology, with the CS emission peaking in the southeast extension or tail of B68. The N2H+ emission has a distribution which most closely traces the column density of dust and presumably therefore H2 (Alves, Lada & Lada, 2001; Bergin et al., 2002). These differences in spatial distributions are most likely due to differential depletion of the respective molecular species as described in detail in our earlier paper (Bergin et al., 2002).
3.2 Velocity Field
Figure 2 shows the individual spectra of C32S, C34S , N2H+ and C18O lines observed at the center of our mapping grid. The C18O and C34S profiles are all single-peaked and characterized by symmetric, Gaussian-like shapes which peak at the same velocity. These lines are characterized by small optical depths (see, Bergin et al., 2002). The N2H+ which has modest opacity ( ) also appears single peaked, but exhibits a slight asymmetry in this high resolution spectrum. This asymmetry in the line profile is unresolved in the lower velocity resolution (0.137 km s-1) observations used to map the emission across the globule. The N2H+ line also appears to be centered at a slightly different velocity than the optically thin CO and CS lines, but this likely reflects the uncertainty of the rest frequency of N2H+. On the other hand, the C32S (hereafter CS) line is double-peaked, suggesting high line center opacity and self-reversed line structure. To probe the velocity field and kinematics of B68 we have mapped the line center velocity and linewidth distributions of both C18O and N2H+, the two single-peaked lines, as well as the velocity distribution of the CS self-reversal across the cloud. The results are described in the following sections.
3.2.1 Linewidth Distribution
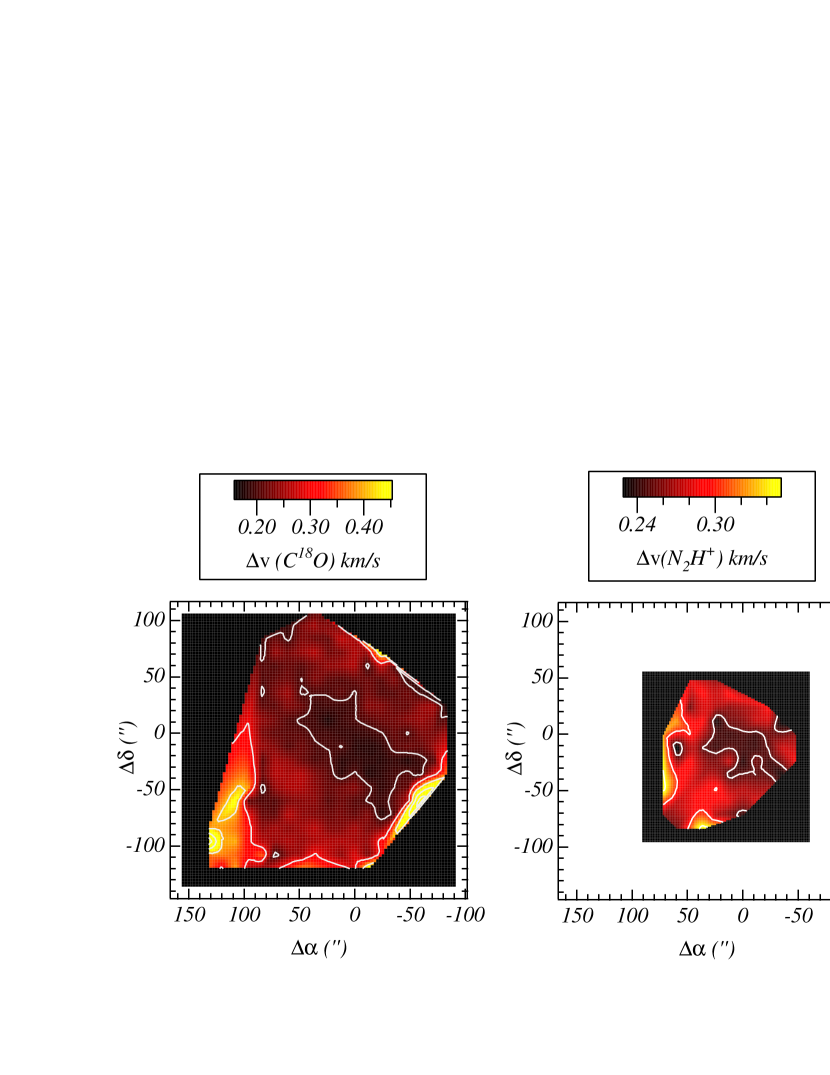
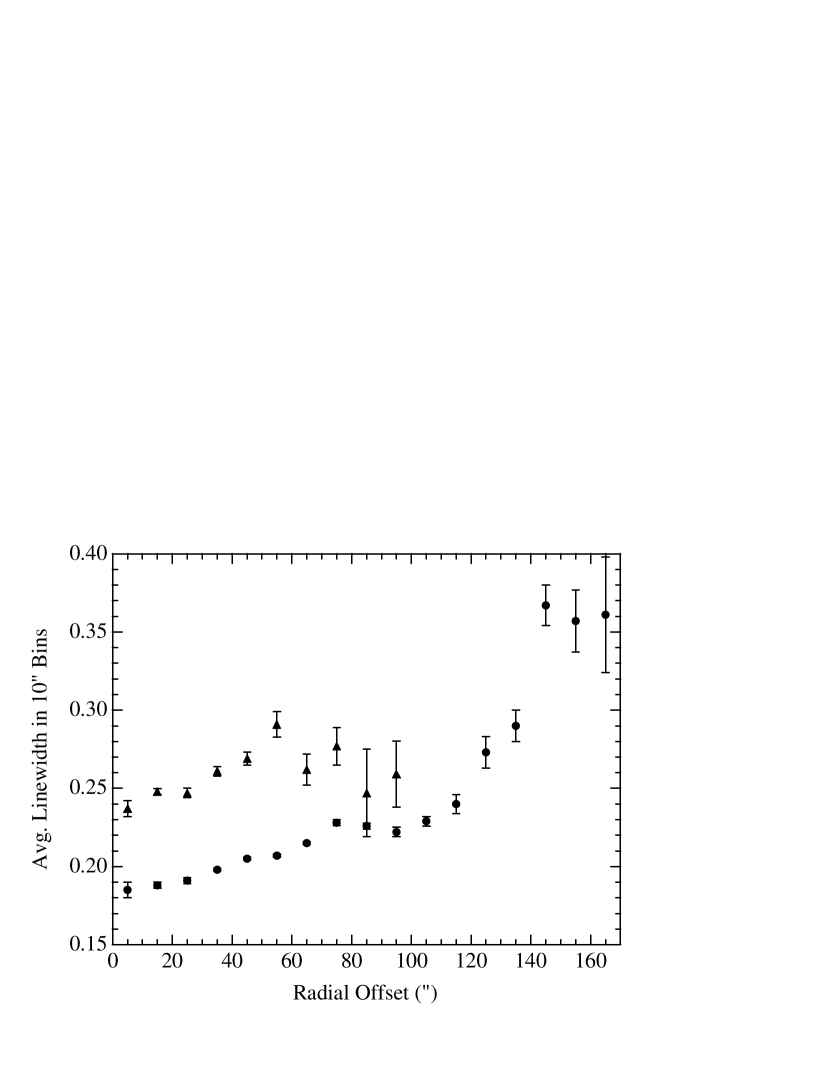
The linewidths of the observed molecular transitions in B68 are generally quite small and the narrowest lines have widths very close to that expected from purely thermal Doppler broadening. Figure 3 shows the spatial distributions of C18O and N2H+ linewidth across the cloud. The linewidths were determined from gaussian fits to the observed profiles. In the case of N2H+ the linewidths were determined from a simultaneous fitting of all the hyperfine components. In both maps there appears to be a systematic increase of linewidth with distance from the map center in the northwest and southeast directions. In both tracers the minimum linewidths are found in an elongated (NE-SW) region passing through the center of each map. We plot in Figure 4 the radially averaged variation of C18O and N2H+ linewidth as a function of radial distance from the center (0,0 position) of the cloud maps. The plots show a slow rise in linewidth with distance in the inner 60 arc sec of the globule. This rise is followed by a relatively flat variation of linewidth with distance until a projected radius of about 100 arc sec, which marks the extent of the main B68 cloud. For larger radii, where only C18O observations exist, the linewidths appear to rapidly increase with radius. These larger distances mostly correspond to the extended tail region of B68, where the brightest CS emission is observed. It is interesting that the N2H+ lines are everywhere wider than the C18O lines since chemical considerations indicate that the two species originate in different cloud volumes with N2H+ interior to C18O (Bergin et al., 2002). Radiative transfer models for the cloud indicate that the higher opacity of the N2H+ lines can account for some, but probably not all, of this difference (Bergin et al 2002).
3.2.2 Radial Velocity Distribution
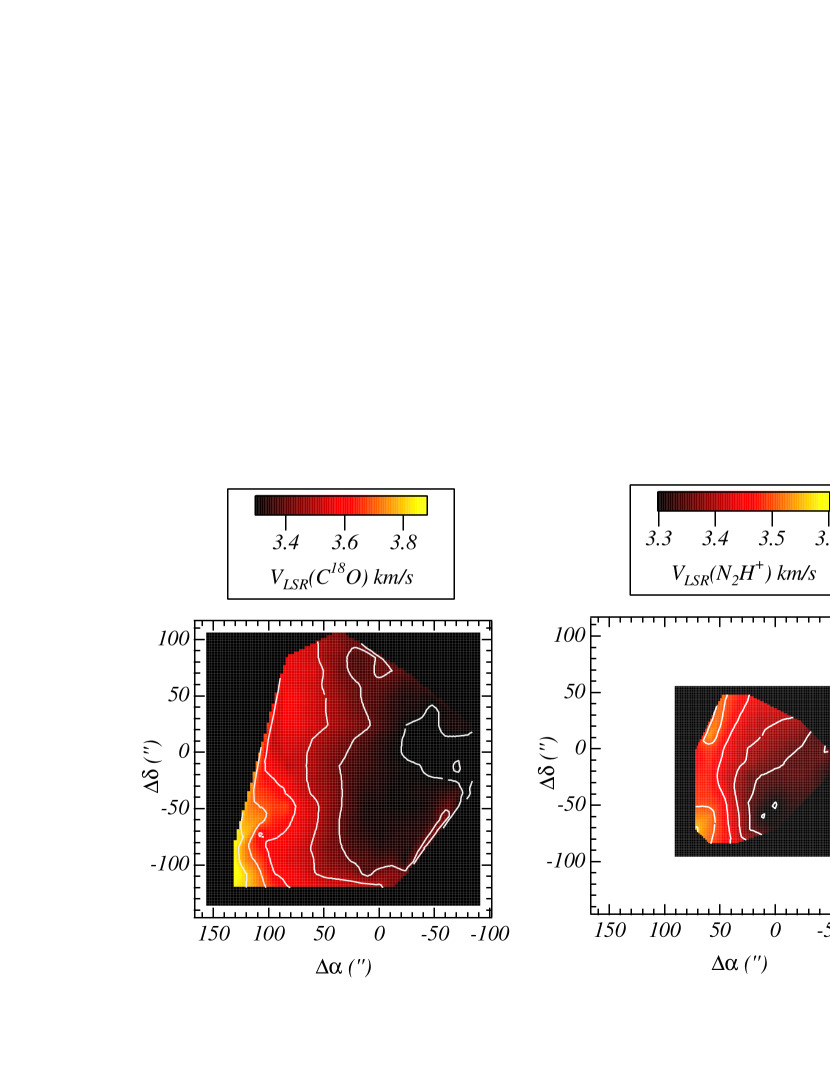
Figure 5 shows the distribution of line center radial velocity for C18O and N2H+ across B68. The line center velocities were derived from Gaussian fits to the observed line profiles. For N2H+ the line center velocities were derived from simultaneous fits to all the hyperfine components. Both maps show what appears to be a systematic, well-behaved velocity gradient across the cloud’s face. In the C18O velocity map, the lines of constant velocity are very nearly parallel to each other and are aligned roughly in a north-south direction. The N2H+ map covers a smaller region and also exhibits an east-west velocity gradient, although of apparently smaller magnitude. Both velocity gradients are consistent with that expected for solid body rotation. Assuming that the velocity gradient is linear when projected on the sky, as would be the case for solid body rotation, the observed velocity at any point on the projected surface of the cloud is related to the velocity gradient and given by:
| (1) |
Here and are the offsets in right ascension and declination expressed in seconds of arc, is the magnitude of the velocity gradient in the plane of the sky, is its direction (as measured from east of north), and is the systemic radial velocity of the cloud. To determine the magnitude of the velocity gradient, its direction on the sky and the cloud’s systemic velocity, we have performed a least squares fit of a two dimensional plane to the observed radial velocity distributions of C18O and N2H+, similar to the procedure described by Goodman et al. (1993). For the C18O map we find the fitted parameters to be: = 2.25 0.024 m s-1 arcsec-1 (4.77 km s-1pc-1 at 100 pc), VLSR = 3.3614 0.0009 km s-1and = 5.5 1.2o. For N2H+ these parameters are found to be: = 1.72 0.09 m s-1 arcsec-1 (3.52 km s-1pc-1 at 100 pc), VLSR = 3.3722 0.0018 km s-1and = 23.5 1.2o. The quoted uncertainties are 3 statistical uncertainties. Both the magnitude and direction of the velocity gradients in the C18O and N2H+ maps differ from each other. Differences in these quantities could perhaps arise due to the opacity difference in the two species. Higher velocity resolution mapping observations of N2H+ would be needed to confidently evaluate this possiblilty. However, the close agreement of the derived cloud systemic velocity from both species suggests that such opacity related differences may be small.
3.2.3 Self-Reversed CS Velocity Field
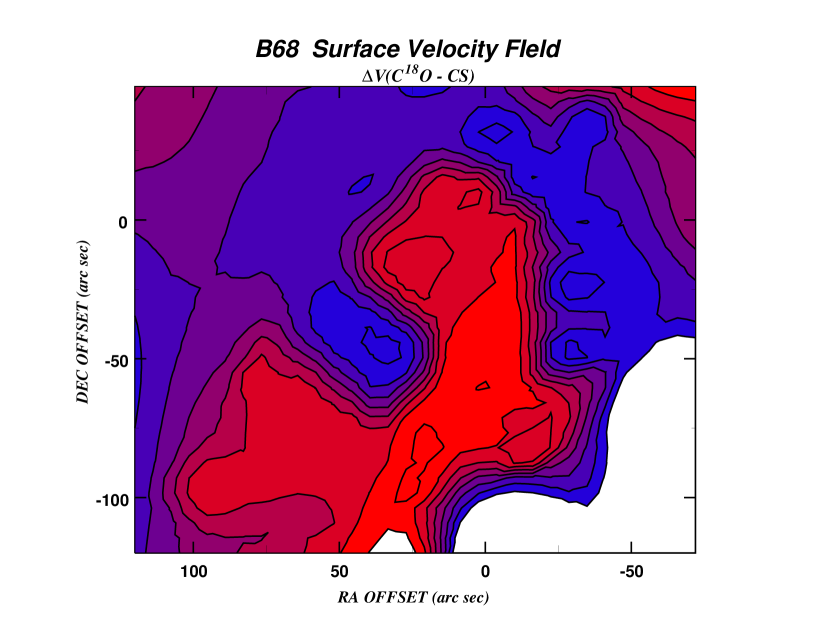
The double-peaked CS line is characteristic of self-reversed optically thick emission. The fact that the C34S line is single peaked and symmetric confirms the optically thick, self-reversed nature of the main CS line. At the center of the map, the CS profile displays the classic red-shifted asymmetry usually associated with infall motions of the outer cloud material (e.g., Walker et al., 1986; Myers et al., 1996). This is likely to be the correct interpretation for the gas motions at the projected center of B68, since the excitation temperature of the lines likely increases inwards as a result of the steep, inward increasing density gradient (ALL01). Self-reversed CS lines are found across nearly the entire extent of the B68 cloud. Figure 6 displays a series of CS spectra along an east-west cut 24 arc sec south of the center of the mapping grid. Although the self-reversal in the CS profiles is clearly spatially extended, the sense of the reversal, or line asymmetry, flips and changes sign both west and east of the map center. In order to better ascertain the nature of the spatial variation in the CS line shapes, we have compared the velocity of the strongest peak in a CS self-reversed line profile with the line center velocity of the optically thin C18O line emission at each position in the CS map of B68. Figure 7 displays a map of the velocity difference, = v(C18O ) – v(CS), that we constructed from gaussian fitting of the CS and C18O line profiles of this cloud. The differences range between roughly -0.16 and +0.12 km s-1. These values are less than the corresponding linewidths at each position and also everywhere subsonic. A positive value of indicates a profile with a stronger blue peak and a red-shifted or infall asymmetry, while a negative value corresponds to a profile with a stronger red peak and a blue-shifted or outflow asymmetry. The most significant feature of the map is the striking spatial segregation of the blue and red shifted asymmetry. The red-shifted inflow asymmetry dominates the central regions of the cloud map but is almost entirely surrounded by a contiguous region dominated by the blue-shifted, outflow asymmetry. This cloud is apparently experiencing simultaneous but spatially coordinated, infall and outflow motions of its outer layers. Such an alternating spatial pattern may be suggestive of global, non-radially symmetric surface oscillations or pulsations of the cloud about an equilibrium configuration as discussed later in this paper.
4 Discussion
4.1 A Thermally Supported Cloud
The striking agreement between the observed density distribution in the B68 cloud and that predicted for a Bonnor-Ebert sphere near critical stability, suggests that thermal pressure is a primary source of support for this cloud against collapse. To evaluate this possibility we obtained deep observations of two optically thin species, C18O and C34S at two locations. One at the center (0E 0W) of our mapping grid, near the projected center of the cloud, and a second at a position 36 arc seconds east and 72 arc seconds north of our grid center (i.e, 36 E 72 N) in the outer regions of the cloud. We find the linewidths at the center position (after correcting for instrumental resolution) to be 0.18 0.01 km s-1and 0.15 0.01 km s-1for C18O and C34S , respectively. At the outer (36 E 72 N) position these widths are 0.28 0.01 and 0.22 0.01 km s-1, respectively. These are extremely narrow linewidths and the fact that the C34S lines are narrower than the C18O lines is suggestive of a purely thermal line broadening mechanism.
The linewidth of an optically thin species (x) is given by:
| (2) |
where is the mass of the molecular species, x, is the contribution to the linewidth due to non-thermal motions, either random (turbulent) or systematic (i.e., contraction, expansion, rotation) and is the kinetic temperature of the gas. In principle, with observations of two species of differing molecular mass one can solve the corresponding set of equations (2) and simultaneously determine and . However, our observations indicate that the CO and CS molecules in B68 suffer significant differential depletion (Bergin et al., 2002). As a result, these lines likely originate from different volumes of the cloud. Given that there is also an observed linewidth gradient in this cloud, comparison of these linewidths to simultaneously derive the cloud temperature and turbulent velocity is probably not a valid procedure.
However, with independent knowledge of the kinetic temperature, Equation 2 can be used to estimate the relative contribution of non-thermal and thermal motions to the observed linewidth for each species individually, with the additional assumption of an isothermal cloud. Early observations of 12CO by Martin & Barrett (1978) suggested a kinetic temperature of 11 K, which was consistent with an independent estimate of 12 K from NH3 (1–1) and (2–2) observations by the same authors. More recent NH3 observations by Bourke et al. (1995) indicated a temperature of 16 K, although this estimate may be too high (Bourke, 2002). Analysis of a 12CO(2–1) spectrum of the central regions of B68, kindly obtained for us by Dr. Frank Bensch (2002) with the Gornergrat telescope in Zermatt Switzerland, indicate a kinetic temperature of Tk = 10.5 1 K, in excellent agreement with the earlier Martin & Barrett (1978) observations and very recent NH3 observations (Hotzel Harju & Juvela, 2002) which came to our attention after the initial submission of the present paper. This is also consistent with the kinetic temperature derived from observations of N2H+ (Bergin et al., 2002). We therefore adopt this as the kinetic temperature of the cloud and from here forward and assume that the cloud is isothermal.
The ratio of thermal to non-thermal (or turbulent) pressure in the cloud is given by:
| (3) |
where is the isothermal sound speed and is the 3-dimensional, rms non-thermal velocity dispersion. For Tk = 10.5 and using Equation 3 we determine = 0.104 km s-1, for the C18O data and = 0.086 km s-1 for the C34S data. Thus we find from these observations, indicating that the central regions of the B68 cloud map are clearly dominated by thermal pressure. In the outer region (36E 72N) of the cloud where the linewidths are larger, and presumably turbulence or systematic motions more important, a similar analysis yields , from the observed C18O and C34S linewidths. Even in the outer regions, thermal motions are a significant, if not dominant, source of pressure for the cloud. These considerations demonstrate that B68 is a thermally dominated cloud and confirms the inference to this effect drawn from the analysis of the extinction derived, column density profile of the cloud (ALL01).
Finally, additional support for a predominately thermal velocity field is also provided by examination of the cloud’s radial velocity distribution. As mentioned earlier, there is a systematic, global variation in the spatial distribution of line center velocities of the optically thin, single-peaked C18O and N2H+ lines. Both these species show well behaved radial velocity gradients across the cloud. In Section 3.2 we used a fitting procedure to fit a 2-dimensional plane to each velocity field and derive the magnitudes and directions of their velocity gradients. If we remove the derived 2-dimensional radial velocity gradient from the data, the residual line center velocities at neighboring positions can be compared and used to measure the magnitude of any relative random bulk motion of the molecular gas along a given line-of-sight across the cloud. For example, for a purely thermal cloud we would expect the difference in residual velocities to be small, while for a turbulent cloud these differences would to some extent reflect the magnitude of the turbulent velocity dispersion.
After removing the derived 2-dimensional velocity gradient from the observed C18O velocity field, we computed the velocity difference () between the nearest neighbor locations in the map. We found the average velocity difference between nearest neighbors to be
for observations separated by 12 arc sec and 15.01 0.19 m s-1 for points separated by 24 arc sec. These velocity differences are considerably smaller than either the typical one-dimensional rms turbulent velocity dispersion ( = 60 - 100 m s-1), or the C18O linewidths ( 180 - 208 m s-1), or the expected sound speed in the cloud ( 200 m s-1), which themselves are of comparable magnitude. We obtain similar values of 7.34 0.61 m s-1 and 15.2 0.63 m s-1 for N2H+ at 12 and 24 arc sec spacings, respectively. The small values of these nearest neighbor residual velocities are clearly consistent with and suggest a thermally dominated velocity field for this cloud.
4.2 Radial Velocity Distribution
Examination of the distribution of the line center velocities of two molecules, C18O and N2H+, which are single-peaked reveal clear, well behaved and systematic velocity gradients across the cloud. In both maps the iso-velocity contours are largely parallel to each other and so suggest solid body rotation of the cloud around a north-south axis. The ratio of rotational kinetic energy to gravitational energy, , is often used to quantify the dynamical importance of rotation for cloud stability and is given by (Goodman et al., 1993):
Here, and are the cloud mass and radius, respectively, and p and q are defined so that the moment of intertia and the gravitational potential energy are given by , and , respectively. For a stable spheroid the virial theorem suggests that . For the parameters of B68, = 1.6 M⊙, = 1.5 1017 cm, and , where is the inclination of the cloud to the line-of-sight, we find for the measured C18O rotation rate. The ratio p/q is likely to have a value somewhat less than 1, for example, for a sphere with an r-2 density profile, = 0.22, while for a constant density sphere, = 0.67. Because the lines of constant radial velocity are so nearly parallel across the face of the cloud, must be much closer to 90o than to 0o. Assuming and = 0.22 we estimate = 0.04. Thus, the rotational kinetic energy is only a few percent of the gravitational potential energy and the contribution of rotation to the overall dynamical stability of the B68 cloud is not very significant. This value of is typical of that estimated for numerous other molecular cloud cores by Goodman et al. (1993). This value is also consistent with the Bonnor-Ebert fit to the cloud density distribution which suggests that the cloud is primarily supported by thermal pressure (Alves, Lada & Lada, 2001).
Because C18O and N2H+ emission lines are formed in different volumes of the cloud due to differential depletion (Bergin et al., 2002), their velocity fields also must characterize the gas in different cloud volumes. In particular, N2H+ probes more interior regions than C18O . In this respect, it is interesting that the rotational velocity gradients derived from the two tracers appear to differ. If the cloud were rotating like a solid body, both tracers should exhibit the same projected radial velocity gradient. Both the magnitude of the rotational velocity gradient and its projected direction on the sky differ more than the quoted errors in these quantities. The magnitude of the rotational gradient derived from the C18O data is a factor of 1.3 greater than that derived from the N2H+ data. This appears to indicate that the cloud is experiencing differential rotation, with the inner regions rotating somewhat more slowly than the outer regions. Although higher velocity resolution mapping obsevations of N2H+ would be required to confirm this interpretation of the data. Nontheless, the radial profile of angular velocity for this cloud differs from the inward spin up one would expect for the more Keplerian-like motion of an isothermal sphere in near hydrostatic equilibrium (Kiguchi et al., 1987; Tassoul, 1978) and the angular velocity profile predicted for an evolving magnetized protostellar core (Basu & Mouschovias 1995a, b). However, in the absence of significant ambipolar diffusion in the cloud core, one might expect magnetic breaking to force co-rotation between the inner and outer parts of the cloud. This would require the existence of a magnetic field which permeates the cloud and is coupled to the gas. The lack of a significant non-thermal component to the observed line widths in the central regions would seem to preclude a significant turbulent magnetic field. Although a rigid, static field could be present, it might be relatively weak, given the close balance between gravitation and thermal pressure required by the agreement of the cloud’s density profile and the predictions of a near critical thermally supported Bonnor-Ebert sphere (Alves, Lada & Lada, 2001). Thus, it is presently unclear whether or not magnetic breaking or some other cause is responsible for the lack of increased rotation in the central regions of the cloud.
4.3 Self-Reversed Profiles: Non-Radially Symmetric Pulsation?
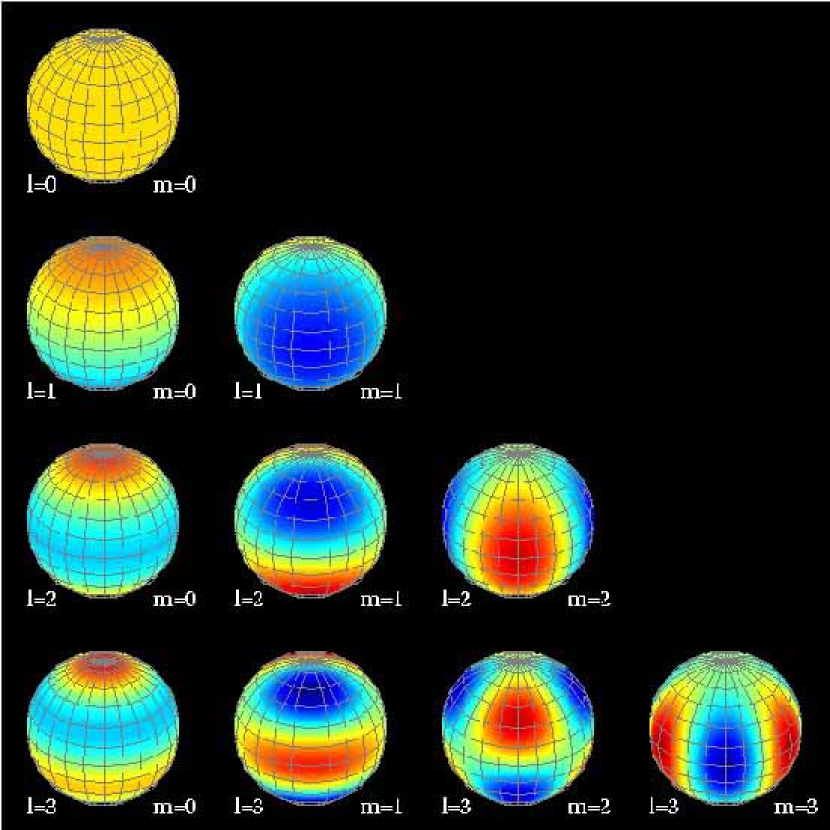
The CS self-reversal traces the motions of gas in the outer layers of the cloud. The systematic spatial segregation of the line profile asymmetry across the B68 cloud is intriguing and is not what is expected from a simple contraction or expansion of the outer cloud layers. Instead the observations appear to indicate that gas in the central regions of the map is contracting while simultaneously the gas in the outer regions of the cloud map is expanding. This description is somewhat of an oversimplification of the true situation since the red-shifted asymmetry extends to the gas in the southeast tail of the cloud, where the CS emission is the strongest. Nonetheless the overall pattern across the main body of the cloud is suggestive of some type of organized or co-ordinated global mass motion. The observed inflow and outflow velocities are subsonic and therefore suggest a small perturbation on the overall dynamical state of the cloud. Indeed, the observed pattern over the main portion of the cloud is similar to that which would be expected from low frequency spatial oscillations of the outer cloud layers around some equilibrium dynamical state. Small amplitude oscillations of a spherical surface can usually be described in terms of spherical harmonic functions (e.g., Tassoul 1978). The real part of the radial component of these functions can produce organized patterns of alternating infalling and outflowing motions across the surface of an oscillating or pulsating sphere, as for example, has been observed on the surface of the sun. In this case the velocity field may be described as:
where is the Legendre function, , a normalization constant, and is the oscillation frequency (e.g., Christensen-Dalsgaard 1998). The oscillation frequency is likely to be proportional to the cloud density, that is, , with the constant of proportionality depending on the physical nature of the restoring force for the oscillation (e.g., Tassoul 1978). The number of surface sectors which are either infalling or outflowing is related to the modal values, and , of the corresponding Legendre function. This is illustrated in Figure 8 which was kindly provided to us by Clem Pryke of the University of Chicago. This figure displays the real parts of the spherical harmonic functions, , for a series of low order modes. The red and blue colors in Figure 8 can be considered to respectively map the inward and outward moving sectors of an oscillating spherical surface. To an external observer, the corresponding velocity field projected along the line-of-sight (for a fixed inclination of the sphere) would maintain a similar spatial distribution or pattern of red and blue motions, although the magnitude of the observed velocites would decrease towards the edges of the observed disk where tangential motions would be the greatest. The pattern observed on B68, with the central region moving in one direction (inward) and the surrounding regions moving in another (outward) is very similar to that expected for an = 2, = 2 mode of oscillation, with the polar axis of the sphere corresponding to the rotational axis of the cloud. In this case the spherical cloud would be divided into four equal sectors with the sectors on the opposite side of the sphere moving in the same direction. This pattern corresponds to a quadrupole oscillation of the outer layers of the cloud.
From our data it is difficult to determine the extent to which such oscillatory motions penetrate below the cloud’s surface. The relatively long wavelength of the = 2 perturbation suggests that deeper cloud layers may also be in oscillation. It is even possible that radial modes of oscillation are present in the interior of the cloud along with the non-radial surface modes. To assess the depth to which surface oscillations may extend or whether radial modes of oscillation are present requires the ability to measure inflow/outflow motions of gas in regions deeper in the cloud than traced by CS emission. This is a very difficult task since it requires the existence of a tracer which both preferentially traces inner cloud material and simultaneously is optically thick. In this context it is intriguing that the high spectral resolution profile of N2H+ obtained at the center of the cloud map (Figure 2) appears to be asymmetric. As mentioned earlier, the observed N2H+ emission has modest optical depth and thus the asymmetry in the profile shape could be the result of self-absorption. Therefore, because N2H+ is considerably less depleted in the core of the cloud, the asymmetry in its profile may be a useful probe of gas motions interior to those traced by the CS emission. The fact that the N2H+ asymmetry has the opposite sense of the asymmetry present in the corresponding CS line (along the same line-of-sight) suggests that the N2H+ emitting gas in the inner regions is moving in a direction opposite that of the CS emitting gas in the outer regions. This, in turn, may suggest the presence of a radial mode of oscillation with a node located somewhere between the CS envelope and N2H+ core of the cloud. However, this inference of the presence of radial modes of oscillation is not by any means definitive, since it depends on the interpretation of a single high-resolution spectrum of N2H+ obtained at the center of the cloud map. Mapping of the N2H+ asymmetry across the cloud along with more detailed radiative transfer calculations which model individual hyperfine components to better constrain the line opacity would be very useful for confirming the existence of such internal cloud motions.
The Barnard 68 cloud appears to be embedded in the Loop I supernova super bubble (Alves, Lada & Lada, 2001, 2002). Its derived surface pressure is an order of magnitude greater than that of the general ISM but comparable to that derived for the Loop I super bubble from x ray observations (Breitschwerdt, Freyberg & Egger, 2000). Therefore, the cloud likely interacted with the shock of a supernova remnant sometime during the not too distant past. We speculate that this external interaction with the supernova provided the peturbation that set at least the outer layers of the cloud into oscillation. Although the interaction did not de-stablize the cloud, it may have excited other, higher mode oscillations which have since damped out. One possibility is that B 68 was a dense core region of a much more massive cloud complex. In this case it would have been surrounded by a lower density, cold molecular envelope, the weight of which provided a similar confining external pressure to that characterizing the cloud now. This envelope would have been stripped with the passage of the supernova shock, leaving behind the denser core region which then came into a new pressure equilibrium with the hot gas in the supernova shell. The oscillations we now observe might then be the remaining signature of that physical interaction.
5 Summary
We have used the 30-m IRAM millimeter telescope to obtain sensitive, high angular resolution observations of C18O , C32S, C34S and N2H+ in the dark cloud Barnard 68. Our primary results can be summarized as follows:
1) The C18O , C34S and N2H+ lines are characterized by very narrow linewidths in the central regions of the cloud map consistent with nearly pure thermal line broadening. We derive the ratio of thermal to non-thermal pressure to be Rp = 4 – 5 from analysis of the C18O and C34S line profiles at the cloud center. We further demonstrate the rotational energy of the cloud to be only a few % of the gravitational potential energy. B68 appears to be a thermally dominated cloud, where thermal pressure is the dominant source of support against gravity. This confirms inferences to this effect resulting from the close correspondence of the measured density distribution of the cloud with predictions for a critically stable Bonnor-Ebert sphere (Alves, Lada & Lada, 2001, 2002).
2) The linewidths of individual molecular species are found to systematically increase with distance from the projected center of the cloud. In the outermost regions of the cloud we find Rp to decrease to between 1 and 2, indicating an increasing role of non-thermal or turbulent motions to the overall cloud pressure in those regions.
3) The spatial distributions of line center radial velocities of C18O and N2H+ display systematic, linear velocity gradients individually indicative of solid body rotation. However both the direction and magnitude of the gradients observed in the two species differ, suggesting the presence of differential rotation in the cloud. The region traced by N2H+ emission appears to be rotating 1.3 times slower than the region traced by C18O emission. Since the latter species is known to be significantly depleted in the interior regions of the cloud this may suggest that the inner regions are rotating more slowly than the outer regions, contrary to expectations. However, higher velocity resolution spectral observations of N2H+ are required to confirm the presence of such differential rotation.
4) The C32S lines are found to be optically thick, saturated and self-reversed over nearly the entire surface of the B68 cloud. Moreover, the self-reversed profiles are asymmetric with both red-shifted asymmetric (infall) and blue-shifted asymmetric (outflow) profiles found in the cloud. The distribution of line profile asymmetry displays a systematic spatially alternating pattern of inflow and outflow motion of the cold outer cloud material. The central regions of the cloud map are characterized by infall motions, while the surrounding regions are primarily characterized by outflow motions. This global pattern of alternating infall and outflow motion aligned roughly along the cloud rotational axis is suggestive of a small amplitude, low order mode, non-radial pulsation or oscillation of the outer surface layers of the cloud around an equilibrium configuration. In addition, the asymmetry revealed in a high resolution spectrum of N2H+ emission obtained at the center of the cloud map may further suggest the presence of a radial mode of oscillation with a node located between the outer CS emitting and inner N2H+ emitting regions of the cloud. Such oscillations might be the signature of an earlier interaction of the cloud with a passing supernova shock.
References
- Alves, Lada & Lada (2001) Alves, J., Lada, C. J., & Lada, E.A. 2001 Nature, 409, 159.
- Alves, Lada & Lada (2002) Alves, J., Lada, C. J. & Lada, E. A. 2002, in preparation.
- Basu & Mouschovias (1995a) Basu, S. & Mouschovias, T. C. 1995a, ApJ., 452, 386.
- Basu & Mouschovias (1995b) Basu, S. & Mouschovias, T. C. 1995b, ApJ., 453, 271.
- Bergin et al. (2002) Bergin, E. A., Alves, J. A., Huard, T. L. & Lada, C. J. 2002, ApJL, 570, L101.
- Bourke (2002) Bourke, T., 2002, personal communication.
- Bourke et al. (1995) Bourke, T., Hyland, H., Robinson, G, James, S. & Wright, C. 1995, MNRAS, 276, 1067.
- Breitschwerdt et al. (2000) Breitschwerdt, D, Freyberg, M., & Egger, R. 2000, A&A, 3114, 258.
- Christensen-Dalsgaard (1998) Christensen-Dalsgaard, J. 1998, Lecture Notes on Stellar Oscillations, 4th Edition, URL: http//www.obs.aau.dk/jcd/oscilnotes/
- Hotzel Harju & Juvela (2002) Hotzel, S., Harju, J. & Juvela, M. 2002, A&A, in press.
- Goodman et al. (1993) Goodman, A. A., Benson, P. J., Fuller, G. A., & Myers, P. C. 1993, ApJ, 406, 528.
- Juvela (1998) Juvela, M. 1998, A&A, 338, 723.
- Kiguchi et al. (1987) Kiguchi, M., Narita, S., Miyama, S. M., Hayashi, C. 1987, ApJ, 317, 830.
- Martin & Barrett (1978) Martin, R. N., & Barrett, A. H. 1978, ApJS, 221, 124.
- Myers et al. (1996) Myers, P.C., Mardones, D., Tafalla, M., Williams, J.P., & Wilner, D.J. 1996, ApJL, 465, 133.
- Padoan, Jones & Nordlund (1997) Padoan, P., Jones, B.T., & Nordlund, A.P. 1997, ApJ, 474, 730.
- Tassoul (1978) Tassoul, J.-L. 1978, Theory of Rotating Stars (Princeton University Press, Princeton).
- Walker et al. (1986) Walker, C.K., Lada, C.J., Young, E.T., Maloney, P.R., & Wilking, B.A. 1986, ApJL, 309, 47.