Massive Ellipticals at High Redshift: NICMOS11affiliation: Based on observations made with the NASA/ESA Hubble Space Telescope, obtained at the Space Telescope Science Institute, which is operated by the Association of Universities for Research in Astronomy, Inc., under NASA contract NAS 5-26555. These observations are associated with proposal #7454. Imaging of Radio Galaxies
Abstract
We present deep, m, continuum images of eleven high-redshift () 3CR radio galaxies observed with NICMOS on-board the Hubble Space Telescope. Our NICMOS images probe the rest-frame optical light where stars are expected to dominate the galaxy luminosity. The rest-frame ultraviolet light of eight of these galaxies demonstrates the well-known “alignment effect”, with extended and often complex morphologies elongated along an axis close to that of the FRII radio source. As has been previously noted from ground-based near-infrared imaging, most of the radio galaxies have rounder, more symmetric morphologies at rest-frame optical wavelengths. Here we show the most direct evidence that in most cases the stellar hosts are normal elliptical galaxies with law light profiles. For a few galaxies very faint traces (less than 4% of the total -band light) of the UV-bright aligned component are also visible in the infrared images. We derive both the effective radius and surface brightness for nine of eleven sample galaxies by fitting one- and two-dimensional surface-brightness models to them. We compare the high-redshift radio galaxies to lower redshift counterparts. We find their sizes are similar to those of local FRII radio source hosts and are in general larger than other local galaxies. The derived host galaxy luminosities are very high and lie at the bright end of luminosity functions constructed at similar redshifts. This indicates that the high-redshift radio galaxies are likely rare, massive sources. The galaxies in our sample are also brighter than the rest-frame size–surface-brightness locus defined by the low-redshift sources. Passive evolution roughly aligns the galaxies with the low-redshift samples with a slope equal to . This value falls intermediate between the canonical Kormendy relation () and a constant luminosity line (). The optical host is sometimes centered on a local minimum in the rest-frame UV emission, suggesting the presence of substantial dust obscuration. We also see good evidence of nuclear point sources (no brighter than 5% of the total -band light) in three galaxies. Overall, our results are consistent with the hypothesis that these galaxies have already formed the bulk of their stars at redshifts greater than , and that the AGN phenomenon takes place within otherwise normal, perhaps passively evolving, galaxies.
Received 2002 June; Accepted 2002 November
1 Introduction
A variety of techniques have been used to find galaxies at high redshift, but the hosts of powerful radio sources remain uniquely interesting as the most luminous and arguably the most massive galaxies known at . Radio surveys have successfully found many distant galaxies with bright optical or infrared counterparts which, in addition, often have prominent emission-lines. As the number of known radio galaxies (RGs) increased, it was discovered that selection via radio flux was preferentially finding early-type galaxies. At low to intermediate redshift, powerful radio sources are almost exclusively found in giant elliptical (gE) host galaxies, which are often situated in moderately rich groups or clusters (Matthews, Morgan, & Schmidt, 1964; Hill & Lilly, 1991). Several radio galaxies at high-redshift have also been found to inhabit overdense environments; a sign that RGs mark deep potential wells. These facts suggest that high-redshift radio galaxies (HzRGs) are the progenitors of present-day giant galaxies. In addition, the recent discovery of strong correlations between galaxy and central black hole masses (Magorrian et al., 1998; Gebhardt et al., 2000; Ferrarese & Merritt, 2000) implies an evolutionary scenario in which all giant galaxies at all observed redshifts harbor super-massive black-holes which undergo (perhaps recurrent) accretion episodes to the present day. If not prone to strong selection effects, these relatively rare sources make excellent discriminators of structure formation and evolution models. However, the question remains: how might the presence of an AGN (both dynamically and its associated radiation and outflows) affect a host galaxy’s formation and evolution, particularly in the extreme cases such as the 3CR radio sources?
There is evidence that the powerful nuclei of radio galaxies play a major role in the stellar hosts’ evolution. Local radio galaxies frequently show morphological peculiarities such as tidal tails and dust lanes (e.g., Heckman et al., 1986; Smith & Heckman, 1989) which are usually absent in the general galaxy population. While these features do not usually dominate the galaxy light (i.e., they can still be classified as ellipticals), they have been interpreted by some to suggest that radio activity is triggered by galaxy interactions and mergers (e.g., Heckman, Carty, & Bothun, 1985). At higher redshifts, , powerful radio galaxies have strong rest-frame UV line and continuum emission which is often extended on an axis similar to that of the radio source (McCarthy et al., 1987; Chambers, Miley, & van Breugel, 1987). This “alignment effect” has a dominant influence on the measured morphological and photometric properties of high-redshift radio galaxies, at least at ultraviolet wavelengths where the blue, AGN-related continuum emission outshines the stellar light from the presumed extant host galaxy.
Optical observations with HST/WFPC2 have revealed the remarkably peculiar and complex morphologies of this aligned light (Dickinson, Dey, & Spinrad, 1995; Best, Longair, & Röttgering, 1997; McCarthy et al., 1997). The rest-frame UV continuum is often segregated into several discrete clumps which are strung along the radio axis. There are three viable explanations for the alignment effect: scattering of AGN light by dust or electrons, star-formation induced by the passage of the radio jets through the galactic ISM, nebular continuum emission (Dickson et al., 1995) or some combination thereof. It has been established from the high degree of polarization that the spatially extended, aligned, UV continuum emission in many RGs is scattered light (e.g., Jannuzi & Elston, 1991; di Serego Alighieri, Cimatti, & Fosbury, 1994; Dey et al., 1996; Cimatti et al., 1997; Tran et al., 1998). Data on the higher redshift RGs () are more limited, but at least one galaxy shows evidence of young stars contributing to the aligned light (Dey et al., 1997). If alignment by induced star-formation is prevalent at early times, then a large fraction of the stars in the galaxy may have been formed via this process.
On the other hand, near-infrared observations of distant radio galaxies have found a smooth magnitude-redshift relation (-) with remarkably small scatter out to at least (e.g., Lilly & Longair, 1984; Eales et al., 1993; McCarthy, 1993; Jarvis et al., 2001). The relation is well-described by a coeval, passively evolving galaxy population which formed at . Less luminous radio galaxies (Eales et al., 1997) over the same redshift range display a - relation analogous to their powerful 3CR counterparts. In effect the radio selection has chosen a particular class of galaxy from the general population. This is consistent with the local association of radio sources with giant elliptical galaxies.
To explain the alignment effect and - diagram simultaneously, previous authors (Rigler et al., 1992; Best, Longair, & Röttgering, 1998) have adopted a two-component source model. A massive, old, early-type galaxy accounts for the - relation and a bright, but dynamically insignificant, AGN-related contribution (scattered nuclear light and/or jet-induced star formation) dominates the rest-frame UV light. Ground-based infrared observations have supported this view (Rigler et al. 1992; Best, Longair, & Röttgering 1997), but have been limited by the relatively poor angular resolution attainable from the ground. However, two-dimensional fitting of higher angular resolution HST/WFPC2 imaging of several 3CR radio galaxies (McLure & Dunlop, 2000) find elliptical-like host galaxies. Such direct observations of the elliptical component can corroborate this theory and perhaps provide a quantify the biases inherent in using AGN hosts to trace galaxy evolution.
To target the stellar host and its morphology requires three observational capabilities: 1) access to rest-frame optical or longer wavelengths to increase the contrast between stellar light and AGN-related emission, 2) filters which target continuum emission and avoid bright emission-lines, and 3) high angular-resolution to discern morphological features with clarity. HST/NICMOS currently provides the best technology to address these three criteria. We therefore obtained HST/NICMOS imaging of a sample of 11 powerful radio galaxies at . Our targets are a representative subsample of the most powerful radio galaxies at these redshifts. Although these 11 galaxies do not constitute a statistically complete sample of high redshift radio galaxies, they do span the full range of optical and near-infrared (NIR) photometric properties shown by this population as a whole. For example, the strength of the alignment effect in our sample ranges from essentially zero (e.g., 3CR 65) to very well aligned (e.g., 3CR 368 or 3CR 266).
We present both HST/NICMOS and HST/WFPC2 imaging from our own proposals as well as from the HST data archive. In the next section we describe the data acquisition and reduction. In §3 we describe our profile fitting procedures and error analysis. In §4 we present the derived physical parameters and compare them to local galaxy samples, and discuss the implications of our results.
Throughout this paper we assume and . With this cosmology subtends 8.6 kpc at .
2 Observations and Data Reduction
The sample galaxies were chosen from the 3CR radio survey to represent powerful radio galaxies at . Our 11 galaxies cover and exhibit the range of host galaxy properties present in the 3CR as a whole. As with any flux-limited sample, 3CR galaxies show a strong radio-luminosity–redshift correlation. This should not greatly affect most of our conclusions, but should be kept in mind when comparing radio galaxies over different epochs, as we do in §4. Table 1 lists the sample galaxies (Col. 1), their coordinates (Col. 2-5) and redshifts (Col. 6) along with the exposure parameters, including exposure time (Col. 9), filter (Col. 7), number of dithers (Col. 10), rest-frame wavelengths covered (Col. 8), and estimated emission-line contamination (Col. 11).
2.1 Data Acquisition
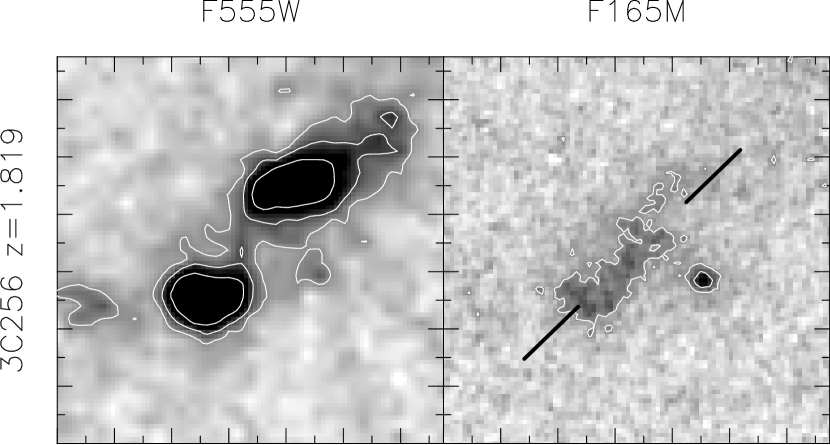
Our NICMOS observations were taken with Camera 2 between December 1997 and July 1998. The NICMOS filters F160W (m) and F165M (m) were used to obtain images in rest-frame wavelengths ranging from approximately 6000 to 9000Å (exact wavelength ranges can be found in Table 1). The alignment effect is especially prominent in the narrow emission line gas (e.g., McCarthy, Spinrad, & van Breugel, 1995). Therefore, to avoid this contamination of the stellar component in terms of both luminosity and morphology, we used the known redshifts of the sources and the composite RG spectrum of McCarthy (1993) to choose the filter with the least line contamination. We attempted to avoid potentially bright emission lines such as H and, for the higher-redshift objects, [OIII] 4959,5007. In the case of 3CR 256 we took exposures in both F160W and F165M to obtain continuum and [OIII] 4959,5007 images. The resulting images show some contamination which has been estimated by using a template spectrum with and without emission lines. We note that these estimates assume a spatially-constant equivalent width, whereas this value is likely to vary over the area of the galaxy. The estimated emission-line contamination is listed in column 11 of Table 1. The telescope was dithered between exposures for all the objects, with 8-13 dither positions per object, to better sample the instrumental PSF, which is already critically sampled at 1.6m, and to aid with the recognition and elimination of data artifacts such as dead pixels or “grot”, hot pixels, the unstable central column of NIC 2, and persistent cosmic-ray afterglow. The exposures themselves were taken using a combination of the MIF512 and MIF1024 NICMOS MULTIACCUM readout sequences, providing exposure times of 512 and 1024 seconds, respectively. In Figure 1 we present the NICMOS images (second panels), the rest-frame UV images from WFPC2 (first panels), which were registered and interpolated to the NICMOS images, and the two-dimensional fit residuals (third panels), which were created by subtracting the best-fit model galaxy from the data as described in §3.1.2.
![[Uncaptioned image]](/html/astro-ph/0211469/assets/x1.png)
![[Uncaptioned image]](/html/astro-ph/0211469/assets/x2.png)
![[Uncaptioned image]](/html/astro-ph/0211469/assets/x3.png)
![[Uncaptioned image]](/html/astro-ph/0211469/assets/x4.png)
![[Uncaptioned image]](/html/astro-ph/0211469/assets/x5.png)
![[Uncaptioned image]](/html/astro-ph/0211469/assets/x6.png)
![[Uncaptioned image]](/html/astro-ph/0211469/assets/x7.png)
![[Uncaptioned image]](/html/astro-ph/0211469/assets/x8.png)
![[Uncaptioned image]](/html/astro-ph/0211469/assets/x9.png)
![[Uncaptioned image]](/html/astro-ph/0211469/assets/x10.png)
2.2 Data Reduction
The individual frames were reduced using a combination of standard IRAF111IRAF is distributed by the National Optical Astronomy Observatories, which are operated by the Association of Universities for Research in Astronomy, Inc., under cooperative agreement with the National Science Foundation./STSDAS pipeline routines (CALNICA) and our own techniques. The most prominent anomalies in our data were: the “pedestal”, a random DC offset which varies by detector quadrant; cosmic-ray persistence, time-decaying charge deposits from cosmic-ray hits during HST’s passage through the South Atlantic Anomaly; and noise associated with the synthetic dark frames in the standard pipeline (Dickinson, 1999). The “pedestal” subtraction was performed using the PEDSKY task now included in STSDAS, but originally written for use with this dataset. It performs an iterative subtraction of both a constant offset per detector quadrant and a “sky” component which is modeled as a constant (over the whole detector) multiplied by the flat-field pattern. The solution minimizes the pixel-to-pixel RMS in each quadrant to converge on the best fits to these parameters.
The synthetic darks now used in CALNICA are “super-darks” generated using many more individual frames than the darks which were available when we reduced these data. Also, it is now possible to generate temperature-dependent dark frames for individual exposures, which help reduce bias gradients in the images (called “shading”). To correct our data for the noise pattern introduced by the original darks, we constructed median frames from the sky and pedestal subtracted images for each filter and readout sequence combination. We combined both our data and those from a similar observing program (M. Giavalisco, private communication) using a median, and subtracted the resulting image from our data. We were able to reduce the amount of pixel-to-pixel noise introduced by the artificial darks by several percent with this method.
Fortunately, cosmic-ray persistence affected only a small minority of our images. The persistent pixels have charge deposited in them from a cosmic-ray hit, which depletes roughly exponentially with time. Occurrence of cosmic-ray persistence is strongly correlated with the HST’s passage through the South Atlantic magnetic anomaly (SAA). Data for one of our targets, 3CR 65, were severely affected by post-SAA persistence, and we have used an experimental method to attempt to correct for this effect. To do so, we “sacrificed” some of the exposures closest in time to the SAA passage, and used these as a model of the persistence pattern. We then scaled and subtracted this persistence model, minimizing the background RMS in a fashion similar to that used by PEDSKY. This worked at the level providing significantly improved noise and cosmetic characteristics. A more robust method using darks automatically scheduled after SAA passages has been implemented for observations with NICMOS in HST Cycle 11.
The individual exposures for each galaxy were combined using the DRIZZLE task (Fruchter & Hook, 2002), with relative shifts determined using image cross-correlation. Input weight maps (inverse per-pixel variance) were generated with a noise model which includes the contributions from the sky, readout amplifier glow, standard dark current and read noise. The DRIZZLE task then generates an output weight map based on the combination of input error maps, transforming the input in exact analogy with the data themselves. These output weight maps were used to calculate our error estimate in the subsequent analysis. DRIZZLE does not account for the correlation of the noise between adjacent pixels when it creates the output weight map. To correct the variance for inter-pixel correlation, we applied a single multiplicative factor (= 1.84) based on the equation derived by Casertano et al. (2000). The effective plate scale after drizzling is one-half the original scale, or 00375 / pixel (the diffraction-limit of HST at m is ). Several original tasks were created for these reductions are now included in the STSDAS reduction package.
The WFPC2 frames included in the present analysis are from GTO proposals (1070 and 6235; PI M. Longair) from the HST archive and several GO proposals (5429, PI W. van Breugel; 5925, PI P. Eisenhardt; 5967, PI M. Dickinson; 5995, PI O. Le Fèvre). Reduction of the WFPC2 images was done using the standard STSDAS pipeline. The WFPC2 thumbnail images presented in this work have been registered with the NICMOS images and interpolated to the scale of the drizzled NICMOS images. Table 2 presents magnitudes derived from the reduced data using aperture (Col. 3-4), total (Col. 5), and point source (Col. 6) photometry. These numbers have relatively little dependence on the model fits described in the next sections.
3 Analysis
3.1 Profile Fitting
To quantitatively compare the morphologies of our galaxies to other samples, we fit analytic surface-brightness models to the data, primarily concentrating on exponential disk and -law (de Vaucouleurs, 1948) profiles. The fits were used to determine characteristic sizes and to differentiate between the spheroidal and disk models. In addition, a Sersic profile (-law; Sersic, 1968) was also fit to discern any deviations from the and disk models. We decided not to fit more complex models (such as the “Nuker” law of Lauer et al. 1995) with more free parameters, because our data are unable to constrain many of the added parameters. For instance, the “break” radius in the “Nuker” law is empirically a parsecs, which is smaller than the physical resolution of our data. We used both one-dimensional (1D) and two-dimensional (2D) fitting algorithms to derive the best-fit profile parameters. For the 1D fits, the initial source position angle (PA) and ellipticity were fixed to measurements using the STSDAS task ELLIPSE. The degree of control provided by ELLIPSE allows easy quantification of the ellipticity and PA. For the 2D method, we performed fits allowing the PA and ellipticity to vary and also fixing them to the values determined from our ELLIPSE measurements. We subsequently used the fit with the lower reduced chi-square () value. As it turned out, all galaxies were better fit using the fixed ellipticity and PA model.
The cases of 3CR 470 () and 3CR 256 () are complicated and warrant separate analyses. Our 3CR 470 images are contaminated by the presence of strong H emission in the bandpass. It is also not clear which of the three sources we detect is the radio source counterpart. 3CR 256 is certainly the most peculiar, as well as the highest redshift, object in this sample. Its peak surface-brightness and total magnitude are much fainter than those of our other sample galaxies (see Table 2). 3CR 256 is also known to lie well-below the - relation formed by other powerful radio galaxies (Chokshi & Eisenhardt, 1991; Simpson et al., 1999). Although we present the imaging data, we have chosen not to include 3CR 470 nor 3CR 256 in the current analysis.
3.1.1 One-dimensional Fits
To fit analytic profiles to the data, we first constructed azimuthally-averaged profiles (i.e., one-dimensional functions of semi-major axis) for both the real data and a set of artificial galaxies. The analytic galaxy templates span a wide range of effective radii (a grid of 200 bins ranging from drizzled pixels, or ′′) and ellipticity (a grid of 5 bins ranging from 0.05 - 0.7). These were convolved in two dimensions with a simulated NICMOS Camera 2 PSF. We used the TinyTim program (Krist, 1995) to generate this PSF on a sub-sampled grid corresponding to our final DRIZZLE pixel scale.
![[Uncaptioned image]](/html/astro-ph/0211469/assets/x12.png)
Azimuthally-averaged intensity versus radius for both the TinyTim model PSF (circles) and a bright star in the field of 3CR 470 (stars). The two curves match one another well at . The discrepancy at larger radii will only affect the photometry of bright point sources, i.e., ones much brighter than those found in our sample.
We then smoothed this PSF with a boxcar filter representing the original pixel scale to emulate the effects of under-sampling due to the finite pixel size. The resulting PSF has approximately the same flux distribution as the final reduced data. Optimally, we would have liked to use an empirical PSF targeted with a similar observing mode. Unfortunately, only a few bright stars exist in our targeted fields and we did not propose for separate PSF exposures. Comparison with a bright star in one field showed that the TinyTim model PSF reproduced the stellar PSF well ( in intensity; see Figure 3.1.1) out to a radius of about 3′′. The final PSF-convolved template library consists of 1000 model galaxies from which azimuthally-averaged profiles have been extracted. Then a subset of 200 are chosen for each galaxy based on its measured ellipticity.
We used a -minimization algorithm (AMOEBA; Press et al., 1992) to derive the sky value, which is an additive normalization, and a multiplicative normalization which gives the best fit to the data. Each image should be completely sky-subtracted by the pedestal removal process (as the small fit sky values confirm); varying the sky value only lengthened the fitting process slightly while maintaining the greatest possible source-to-source consistency. We calculated the input errors for the procedure by measuring the output weight maps from DRIZZLE in the same elliptical isophotes as the galaxy. The best-fit model for each source was determined by comparing the resultant values for each of the 200 templates. The central 05 diameter has been excluded from these fits to reduce the influence of any nuclear point sources and uncertainties associated with the PSF and centering.
3.1.2 Two-Dimensional Fits
Given a set of input parameters, the two-dimensional fitting algorithm generates model images “on-the-fly”. The freedom of the 2D approach allows us to fit for any combination of galaxy centroid, position angle, ellipticity, effective radius, surface-brightness, point-source contribution, and sky value. The method can be easily extended to any analytic profile. We primarily attempted to distinguish between de Vaucouleurs and exponential disk profiles, but also fit a Sersic law to determine whether deviations from the or disk models were prominent. We did not fit more complex profiles with additional free parameters because we felt it was not warranted by the signal-to-noise ratio and physical resolution of our data.
The program extracts a thumbnail image centered on the galaxy from the larger, sky-subtracted mosaic. Initially, this sub-image was 200 drizzled pixels () on a side, with the outer fit radius fixed to half this value (). Trials with an outer fit radius twice as large () did change the fits slightly for several galaxies. The average decrease in effective radius, , was 10%. We chose one of these outer fit radii based on a simple by-eye comparison of the residuals for each source, rather than apply a strict test of values.
The algorithm then refines the galaxy centroid to sub-pixel precision. An initial guess at the fit parameters is passed to a function that generates a model image which is then convolved with the TinyTim PSF (described above). The model is calculated on a sub-sampled pixel grid. Our sub-sampling by a factor of five allows the surface-brightness per pixel to be calculated to higher precision than at the original scale. This also allows centering to be accurate to less than a pixel. The model is then rebinned to the size of the input data thumbnail while conserving intensity.
A is calculated for the model fit using the output weight map derived from the DRIZZLE task and a binary mask generated to remove neighboring objects and to impose inner and outer fit radii. We masked neighboring objects or high surface-brightness aligned light in the following galaxies: 3CR 65 (neighbor), 3CR 184 (neighbors), 3CR 210 (neighbors), 3CR 239 (small neighbors), 3CR 266 (neighbors and aligned light), 3CR 267 (neighbors), 3CR 280 (neighbors and aligned light), and 3CR 368 (cores of neighboring, largely subtracted stars and aligned light). The Levenberg-Marquardt minimization algorithm (Bevington & Robinson, 1992) is used to generate the next guess for model parameters until the fractional difference between successive values is less than a small user-defined value.
After testing several combinations of fit parameters (see §3.2) we also included a point source component in our fits and reduced the inner fit radius to zero. The fact that there is a degeneracy between the central cusp of a de Vaucouleurs profile and a nuclear point source, is discussed in more detail in §4.2. The simulations we performed convinced us of the importance of including this component. The galaxy centroid was allowed to move for all of the 2D fits. The point source centroid was always fixed to the galaxy centroid. In addition to analyzing our own data, we have used the two-dimensional method to fit 15 intermediate redshift radio galaxies from the 3CR WFPC2 snapshot survey (de Koff et al., 1996; Martel et al., 1999). The results of the 2D fits are presented for the high- and intermediate-redshift RGs in Tables Massive Ellipticals at High Redshift: NICMOS11affiliation: Based on observations made with the NASA/ESA Hubble Space Telescope, obtained at the Space Telescope Science Institute, which is operated by the Association of Universities for Research in Astronomy, Inc., under NASA contract NAS 5-26555. These observations are associated with proposal #7454. Imaging of Radio Galaxies and 4 and are discussed in §4.
3.2 Simulations and Error Analysis
To better understand the systematic uncertainties in the fits, we undertook a thorough set of simulations. The full parameter space was explored by creating a large library of artificial galaxy images distinct from those used in the 1D fits. Models were generated for a wide range of effective radius, nuclear point-source luminosity and signal-to-noise ratio, which is defined per pixel at . We assumed a constant sky background, but the noise was modulated by the final weight-map produced by DRIZZLE (from a representative sub-image of a single target’s weight-map). These galaxies were then fit using the 2D method described above. Position angle and ellipticity were held constant at the same input value for all simulated sources. Table 5 shows the range of input values for the model galaxies.
In Figure 2 we show the fractional deviation of the output fit values from the input values for radius, surface-brightness, and point-source strength versus point-source luminosity, which is shown as a percentage of the total galaxy luminosity. We can estimate the systematic errors on all the fit parameters by measuring the deviations of the output values compared to the input. Systematic errors on the primary fit parameters, effective radius, , and effective surface brightness, , are less than 5% for all model galaxies with signal-to-noise ratio 1 measured per pixel at . The median signal-to-noise ratio for our sources is . Therefore, we expect the systematics on our derived parameters to be roughly in line with those simulated here. In Figure 2 stars represent fits which include a point-source component, and circles represent fits which are purely de Vaucouleurs law models. The inclusion of a point-source in the models greatly reduces the systematic error on all three derived parameters: , , and, of course, point-source luminosity. For point-source luminosities less than of the total galaxy light, the point-source flux itself is determined to % of its input value. This is comparable to the intrinsic scatter for the galaxies with only a small point-source contribution. Therefore, the error in the nuclear luminosity determination may introduce a spurious contribution to the total error budget when the nucleus is not very bright.

Based on these simulations, we expect to underestimate the point-source contribution, and therefore underestimate the effective radius, because a more concentrated profile accounts for the “missed” point-source light. The simulations can be used to quantify this effect as a function of point-source luminosity. For the derived point-source strengths of our targets, this is not a significant effect and no correction has been made. Therefore, we have chosen to perform fits to the data both with and without a point-source component, and determine which produces the best residuals, i.e., the lowest .
We measured the random errors using a technique. For each target galaxy we calculated values for a fine linear grid of and centered on the best fit values. All objects share essentially the same structure. A representative contour plot is shown in Figure 3. The box is of the best fit values on each side, with radius the abscissa and linear intensity the ordinate. The contours represent the gaussian one, two, and three errors based on values of 2.3, 6.17, and 11.8 respectively as calculated for the standard two degree-of-freedom table (Press et al., 1992). The median 1 error for all the sources is roughly 10% of the best-fit value in both radius and surface-brightness.
The one- and two-dimensional fits agree reasonably well as illustrated in Figures 3.2 and 3.2. A linear regression analysis calculates the scatter about the one-to-one relation to be in radius and 0.3 mag in surface-brightness. Recall that these are completely independent methods of determining the fit parameters. The agreement between the results of the two algorithms in addition to the results of the simulations gives us confidence that large, systematic errors in our derived galaxy parameters are unlikely.
![[Uncaptioned image]](/html/astro-ph/0211469/assets/x15.png)
Effective radius derived via the 2D fitting method versus radius derived via the 1D algorithm. The solid line is the one-to-one line. The two independent methods show good agreement with a scatter about the one-to-one line of .
![[Uncaptioned image]](/html/astro-ph/0211469/assets/x16.png)
Effective surface brightness from the 2D fits versus the same from the 1D fits. Again, the two independent fitting methods show good agreement. The scatter about the one-to-one line is 0.3 magnitudes.
4 Results and Discussion
The NICMOS data presented here are unique in their combination of high spatial resolution and NIR wavelength coverage. Previous studies of radio galaxies were limited either by contamination from the AGN at observed optical wavelengths, i.e., the UV alignment effect, or by ground-based seeing in the NIR. The exquisite resolution and NIR sensitivity provided by HST has allowed us to analyze these data in ways that were previously impossible or unwarranted. In this section we discuss the results of our analysis, focusing first on the galaxy morphologies and then on their comparison to other galaxy samples. The key quantities used in the following discussion are presented in Tables 2 and Massive Ellipticals at High Redshift: NICMOS11affiliation: Based on observations made with the NASA/ESA Hubble Space Telescope, obtained at the Space Telescope Science Institute, which is operated by the Association of Universities for Research in Astronomy, Inc., under NASA contract NAS 5-26555. These observations are associated with proposal #7454. Imaging of Radio Galaxies (and Table 4 for comparison). Table 2 contains various magnitudes which are either model-independent or depend only weakly on the 2D fits, while Table Massive Ellipticals at High Redshift: NICMOS11affiliation: Based on observations made with the NASA/ESA Hubble Space Telescope, obtained at the Space Telescope Science Institute, which is operated by the Association of Universities for Research in Astronomy, Inc., under NASA contract NAS 5-26555. These observations are associated with proposal #7454. Imaging of Radio Galaxies presents parameters derived directly from the fits which may depend on our choice of cosmological model.
4.1 Host Galaxy Morphology

The NICMOS images (Figure 1) reveal round, symmetric host galaxies unseen in the UV WFPC2 data. Given the high angular-resolution of NICMOS, this unambiguously confirms the results of previous authors (e.g., Rigler et al., 1992; Dickinson et al., 1995; Best et al., 1998). The signal-to-noise ratio and spatial resolution of the data allow a detailed investigation of the varied luminous components. In this section we present the analysis of the host galaxy morphologies. We studied the extracted profiles in detail to look for signs of both nuclear point sources and non-homology (i.e., the degree to which the profiles differ from one another). In combination with the comparably resolved UV data from WFPC2, the correspondence between the AGN-related aligned light and the stellar host can also be determined.
4.1.1 Stellar Component
The one- and two-dimensional surface-brightness profile fits statistically prefer the models over the exponential disk profiles. To test this preference we have employed the statistical F-test to compare the resulting values. The disk model can be rejected in favor of the de Vaucouleurs profile at greater than confidence for all objects. This suggests that the host galaxies are indeed ellipticals and provides circumstantial evidence that they are the passively evolving galaxies responsible for the smooth - relation. The NICMOS data presented here are the most direct detection of the hypothesized bulge component. The correlation between bulge and black-hole mass (Magorrian et al., 1998; Gebhardt et al., 2000; Ferrarese & Merritt, 2000) also predicts that very luminous AGN should reside at the centers of large, bulge-dominated galaxies. We note, however, that the de Vaucouleurs model is an oversimplification which ignores several details of the surface-brightness profiles.
Figure 4 shows the smooth, simple surface-brightness profiles of the nine fitted galaxies. The solid line is the 2D fit. Close inspection of the profiles reveals several features. Three galaxies, 3CR 265, 3CR 280 and 3CR 65, show very steep central cusps, high central surface-brightness and the hint of the first diffraction ring of the NICMOS Camera 2 PSF (at ). These clues suggest the presence of nuclear point sources or at least a very cuspy profile. This possibility we investigate more fully below and is included in the 2D fit for these 3 galaxies. 3CR 368 and 3CR 210 show very flat outer profiles, seemingly more consistent with a power-law model rather than a de Vaucouleurs profile. Also, in both 3CR 265 and 3CR 280 the data exceed the profile at radii greater than . This may be due to their extremely high central surface-brightness, because to compensate for the central surface-brightness, the law must be more compact and therefore underpredicts the outer intensity. However, this excess light at large radii may also be indicative of extended, cD-type halos (both 265 and 280 are believed to lie at the centers of moderately rich clusters), extended emission-line nebulae (for example, [SIII] in the case of 265) or the aligned light (particularly the “arc” to the west of 280, which was masked in the 2D fits but may still contribute measurable diffuse flux).
Perhaps the more significant conclusion to be drawn from the differences between the galaxy profiles is that these sources may not form a homologous sample. Homology is relevant to the various scaling relations followed by early-type galaxies. For instance, the Fundamental Plane is tilted with respect to the predicted “virial plane” (e.g., Longo & Puddu, 1997). One explanation for the tilt is non-homology among the galaxies. We have fit a Sersic profile to each source in order to test the assumption of homology for our sample. The Sersic profile (Sersic, 1968) is defined:
| (1) |
where is calculated such that is the half-light radius. This more general profile has been shown to correlate with physical galaxy properties such as stellar velocity dispersion (see Graham et al. 2001; Trujillo, Graham, & Caon 2001). Sersic fits performed in the same manner as the and disk fits reveal a range of the index within our sample: from 2.6 for 3CR 266 to 6.8 for 3CR 280 (see Table Massive Ellipticals at High Redshift: NICMOS11affiliation: Based on observations made with the NASA/ESA Hubble Space Telescope, obtained at the Space Telescope Science Institute, which is operated by the Association of Universities for Research in Astronomy, Inc., under NASA contract NAS 5-26555. These observations are associated with proposal #7454. Imaging of Radio Galaxies). Due to the limited radial extent of the data, these results should be considered suggestive rather than conclusive, since the best-fit value depends strongly on the behavior of the profile at large radii (particularly for ). Deeper data will be able to distinguish between different with greater confidence. Graham et al. (1996) have shown that brightest cluster galaxies often obey the flatter, profile. It is interesting that several of our targets are also known to reside in moderately dense environments, including 3CR 265 and 3CR 280, two of the galaxies exhibiting an profile. Again, based on the statistical F-test, the Sersic fits do not significantly improve upon the fits except in the case of 3CR 184 where . The range of within the sample may also partly explain the observed change in derived effective radius when the outer fit radius is increased. There is a correlation between the derived Sersic index and the degree to which the change in outer fit radius affects the measured galaxy size. Table Massive Ellipticals at High Redshift: NICMOS11affiliation: Based on observations made with the NASA/ESA Hubble Space Telescope, obtained at the Space Telescope Science Institute, which is operated by the Association of Universities for Research in Astronomy, Inc., under NASA contract NAS 5-26555. These observations are associated with proposal #7454. Imaging of Radio Galaxies (Col. 8) lists the Sersic indices for the galaxies.
4.1.2 Host Galaxy Alignment

Apart from the stellar host, the NICMOS data also contain other luminous components, some of which are directly comparable to structures seen in the rest-frame UV images from WFPC2. The residuals shown in Figure 1 are faint and often aligned with the radio axis, shown as lines in the middle panels of Figure 1. The direct correspondence between the NIR aligned residuals and the structures seen in the optical WFPC2 images suggests that much of the NIR alignment is simply the long-wavelength extension of the rest-frame UV alignment effect. The detailed photometric properties of the aligned light will be discussed in a future paper.
Perhaps more interesting, however, is the observed alignment between the stellar host and the radio axis. The luminosity-weighted position angle (PA) of the stellar host has been measured using the IRAF task ELLIPSE (see § 3.1) with any bright aligned light excluded from the ELLIPSE fitting (as described in § 3.1.1). The host galaxies are certainly less elongated than the UV continuum light, but surprisingly many remain within degrees of the radio axis (Figure 5). A KS test against a uniform distribution shows that the PA distribution is inconsistent with a random distribution at the 99.9% confidence level. Of course, these measurements of PA depend on the ellipticity of the source. Very round galaxies, such as 3CR 65 and 3CR 239, do not provide a meaningful PA. Best, Longair, & Röttgering (1998) defined a metric, which they call “alignment strength”, . This properly weights each measurement according to galaxy ellipticity () and PA. A positive value of indicates alignment. The values for our sample are plotted as a histogram in Figure 6. The distribution has both positive mean equal to 0.07 and median equal to 0.06, indicating a tendency toward alignment. Two-thirds of the galaxies show positive alignment strength, similar to the value of found by Best et al. (1998).
In order to determine whether or not the alignment is an intrinsic property of the stellar component or the result of contamination by the aligned component we performed simulations of randomly oriented galaxies with comparable aligned light. The aligned light component is treated using both a model and using the actual measured NICMOS residuals for 3CR 266. The results of these simulations suggest that both the ellipticity and PA measurements can be skewed by a modest amount of aligned light. Therefore, we believe that while these results are intriguing, they could reflect some incomplete subtraction of the aligned light rather than a property of the stellar distribution. However, the same residual aligned light does not have much of an effect on the other results presented in this paper, contributing on average only 4% of the total light from the host galaxy.
In addition, using our same software, we have measured ellipticities and derived sizes and luminosities for a sample of intermediate redshift radio galaxies from the 3CR WFPC2 Snapshot Survey (de Koff et al., 1996; Martel et al., 1999). The “snapshot” sources were chosen using several criteria: multiple exposures to allow cosmic-ray removal, extended galactic appearance (i.e., not quasars or “N” galaxies), no major dust features, and good signal-to-noise ratio (which eliminates many of the higher redshift sources). This selection resulted in 15 3CR galaxies being chosen for fitting: 3CR 219, 234, 310, 314.1, 319, 332, 346, 35, 381, 403, 436, 452, 63, 79, 93.1. The median redshift of the snapshot sample is 0.16 and the range is . All the snapshot galaxies were observed with either the F675W or F702W. With a slightly negative mean , these sources do not show the same host galaxy alignment as the higher redshift 3CRs. We revisit these sources for more detailed comparison in Section 4.4.
4.1.3 Dust

The symmetric host galaxy is often centered on a local minimum of the UV light (e.g., 3CR 210, 3CR 368), suggesting that dust is playing an important role in the observed morphology of these sources (cf. Dickinson, Dey, & Spinrad, 1995). In low-redshift radio galaxies, dust is quite common in the central region, often configured in either a disk or a dust lane (e.g., Martel et al., 1999; de Koff et al., 2000). In these local objects, the dust is known to be associated with the central engine. The physical resolution of our data is insufficient to make the same claim for our targets. However, the presence of molecular gas in some intermediate- to high-redshift radio galaxies (Papadopoulos et al., 2000) also implies that conditions suitable for dust exist. The existence of dust in these sources may also be inferred by the presence of scattered light, although electrons could instead be responsible.
4.2 Nuclear Point Sources
AGN unification theories propose a quasar nucleus is hidden within every radio galaxy. In the rest-frame ultraviolet, the nucleus is heavily obscured along the line-of-sight by a dusty torus, but as one observes at longer (infrared) or much shorter (X-ray) wavelengths, the optical depth toward the nuclear source decreases significantly. Therefore, our rest-frame optical NICMOS images may be able to detect nuclear point sources where shorter wavelength observations could not. To search for possible nuclear point sources we added a delta-function at the center of the model galaxies which, upon convolution, becomes the PSF. This method is complicated by a degeneracy between the central surface-brightness produced by the de Vaucouleurs model and the point-source. Also, the galaxy may not follow the -law in the center, and instead have a more steeply rising, “cuspier” profile which would also mimic a central point-source. A possible resolution to this conflict is to deconvolve the data, an effort we have not undertaken at this time. The delta-function approach does allow us to separate the galaxies into those with and without point sources with fairly good accuracy as shown by the simulations (§3.2).
As a corollary to this method, we can use results from local, well-resolved galaxies to potentially further constrain the nuclear flux contribution. Previous work on low-redshift AGN and “normal” ellipticals has broadly categorized surface-brightness profiles at small radii (Lauer et al., 1995). The profiles are well-described by a “broken” power-law. In general the slope becomes shallower within a “break” radius of 100 – 300 pc and does not switch sign. If the same rule-of-thumb holds true for distant galaxies, then it is relatively easy to derive both an upper and lower limit to the contribution of a nuclear point source to the galaxy surface-brightness. At the redshifts of our sources, the PSF spans roughly 600 pc FWHM, so we are not able to detect the power-law break directly. However, a flux estimate for a central point source component is greatly affected by the model behavior in the central portion of the PSF. If we fit a single power-law and see a central excess in the residual image, we have a robust detection of a cuspy profile which implies the presence of a nuclear source. While this is a sound theoretical argument, in practice none of our sources exceed this extrapolated power-law. This does not rule out the presence of point sources, but suggests that their luminosities must be relatively low. Of the nine galaxies for which we fit full 2D surface-brightness models, three of them show detections of nuclear point sources using the delta-function approach. None of the three point sources, in 3CR 65, 265, and 280, are brighter than of the total galaxy light. This is consistent with the null result of the power-law method. We have calculated robust 1 upper limits to the point-source contributions in the other six galaxies by gradually increasing the nuclear luminosity while allowing galaxy centroid, , and to vary, until increases to a certain value. These upper limits are included in column 6 of Table 2.
4.3 Galaxy Luminosities and Sizes

Using the results of the 2D fits, the galaxy redshifts, and an assumed cosmology (§1), we derive absolute magnitudes in several bands and physical sizes from the model fits. We then compare these quantities to those measured in other galaxy samples.
Table 2 presents the apparent magnitudes of the host galaxy calculated three ways: from the light within a 63.9 kpc metric aperture for the data (Col. 3), from the light within a 63.9 kpc metric aperture for the model fit (Col. 4), and from the total light of the model fit (Col. 5). We also list the magnitudes of the nuclear point source component (Col. 6). These host magnitudes are largely free of contamination from AGN-related components. Indeed, we have fit and subtracted the nuclear point sources and the aligned light is faint. The degree to which these two components do affect the raw data (as measured by the aperture magnitudes) can be estimated in a mostly model-independent way. The point-source component is centered on the peak of the profile and the absolute upper limit to its contribution is equal to twice the flux contained within a diameter equal to the PSF FWHM (because for a gaussian PSF half of the total flux is contained within the FWHM). Similarly, most of the aligned light can be measured in the residual image where both the host galaxy and point-source have been subtracted away. The magnitude of the residuals is usually less than 4% of the total aperture galaxy magnitude. The one outlier is 3CR 368 which has of the total galactic flux in several bright aligned clumps. For all the galaxies the upper limit to the central flux is less than 10% of the aperture flux. The total magnitudes quoted in column 5 of Table 2 are based on the model fits alone and are used throughout the following analysis.
The NICMOS filters, F165M and F160W, cover the rest-frame wavelengths near 6500 Å in our sources. It is therefore straightforward to correct our measurements to the rest-frame Gunn- band using a model spectral energy distribution (SED) as described below. We have chosen rest-frame Gunn- because of the wealth of comparison data in this band. The choice of SED makes little difference for this small correction, but has a significant impact when we attempt to calculate magnitudes which are evolved to the present-day. Absolute un-evolved magnitudes are presented in Tables Massive Ellipticals at High Redshift: NICMOS11affiliation: Based on observations made with the NASA/ESA Hubble Space Telescope, obtained at the Space Telescope Science Institute, which is operated by the Association of Universities for Research in Astronomy, Inc., under NASA contract NAS 5-26555. These observations are associated with proposal #7454. Imaging of Radio Galaxies and 4 for the (NICMOS) and (WFPC2 snapshot) 3CR radio galaxies respectively.
To calculate both rest-frame and passively evolved magnitudes we have adopted a model SED from the Bruzual-Charlot (BC) code (a 1999 version of Bruzual & Charlot, 1993; Bruzual, 2000). The model SEDs in the BC system are spectra, normalized to one solar luminosity. We have drawn our SEDs from the set of empirical single stellar population models with a Salpeter IMF and solar metallicity. To calculate the stellar age, we assume that our galaxies had their last major epoch of star-formation in an instantaneous burst at and have evolved passively to their observed redshift. This choice of SED and stellar age implicitly determines galaxy colors, which we use to translate our NICMOS observations into other bandpasses, and mass-to-light ratios, which we use to calculate rough stellar masses for our sources.
By integrating the model SED through the appropriate NICMOS filter we normalized the spectrum to our observations. This normalized SED was then used to calculate the color correction to any other desired band. To correct to the Gunn- band above we took the normalized SED, integrated it through the rest-frame band filter and applied the AB to Gunn zeropoint offset. Then to calculate the rest-frame Gunn- from the observed we used:
| (2) |
where and are the average integrated over each filter and the 0.23 is the zeropoint offset going from AB to Gunn- magnitudes (Fukugita, Shimasaku, & Ichikawa, 1995). Applying the same normalization to an evolved SED and calculating the corresponding color correction, we derive “evolved” magnitudes which we use to compare the galaxies with local samples.
We have also calculated rest-frame magnitudes, included in column 10 of Table Massive Ellipticals at High Redshift: NICMOS11affiliation: Based on observations made with the NASA/ESA Hubble Space Telescope, obtained at the Space Telescope Science Institute, which is operated by the Association of Universities for Research in Astronomy, Inc., under NASA contract NAS 5-26555. These observations are associated with proposal #7454. Imaging of Radio Galaxies. The more significant color correction from our observed wavelength to the rest-frame -band (also included in Table Massive Ellipticals at High Redshift: NICMOS11affiliation: Based on observations made with the NASA/ESA Hubble Space Telescope, obtained at the Space Telescope Science Institute, which is operated by the Association of Universities for Research in Astronomy, Inc., under NASA contract NAS 5-26555. These observations are associated with proposal #7454. Imaging of Radio Galaxies) depends weakly on the assumed burst redshift via the amount of color evolution of the stellar population. If we change the redshift of the last major epoch of star-formation from 2.5 to 10, the mean absolute magnitude brightens by 0.1 mag.
Using the normalization and the gas mass fraction of the SED we also derive stellar masses. As shown in column 11 of Table Massive Ellipticals at High Redshift: NICMOS11affiliation: Based on observations made with the NASA/ESA Hubble Space Telescope, obtained at the Space Telescope Science Institute, which is operated by the Association of Universities for Research in Astronomy, Inc., under NASA contract NAS 5-26555. These observations are associated with proposal #7454. Imaging of Radio Galaxies these fall in the range of . These derived stellar masses are only weakly dependent on the assumed epoch of the last major episode of star-formation. We feel the choice of passive evolution is justified by both the - diagram and our later analysis of the size–surface-brightness relation (§4.4.3).
The galaxy half-light radii are presented in Table Massive Ellipticals at High Redshift: NICMOS11affiliation: Based on observations made with the NASA/ESA Hubble Space Telescope, obtained at the Space Telescope Science Institute, which is operated by the Association of Universities for Research in Astronomy, Inc., under NASA contract NAS 5-26555. These observations are associated with proposal #7454. Imaging of Radio Galaxies in both arcseconds (Col. 2) and kiloparsecs (Col. 3). For consistency with previously published studies, we have only used sizes derived using the -law profile rather than those from the Sersic fits. The galaxies are not perfectly round; the “radius” value we have quoted is the geometric mean of the semi-major and semi-minor axes. Radii for the 3CR galaxies span the range from 3 to 17 kpc. We find the smallest galaxies also happen to be those with the largest point source contributions. We suspect that this is at least partly a coincidence, since our simulations show that the radius determination is accurate when fitting for the point source.
4.4 Comparison With Other Samples

To put our sample into the context of early-type galaxies in general, we compare the 3CR galaxy sizes and luminosities to those drawn from previous studies. The effective radii and host galaxy luminosities derived above are directly comparable to previous studies of galaxies. For our comparison datasets, we have chosen the samples of Schade et al. (1999) (field early-type galaxies to ), Jørgensen, Franx, & Kjærgaard (1995) (local cluster ellipticals), Graham et al. (1996) (local brightest cluster galaxies), and Govoni et al. (2000) (local radio galaxies). We have also included the WFPC2 3CR snapshot survey data described above (§ 4.1.2)
The Schade et al. (1999) sample was selected from the CFRS (Le Fèvre et al., 1995) and LDSS (Colless et al., 1990) spectroscopic surveys based on two-dimensional surface-brightness fits to follow-up HST/WFPC2 F814W imaging. Each galaxy included in their analysis was better fit by the law than either the exponential disk or a combination (disk+bulge) of the two models. The resulting catalog contains 48 elliptical galaxies and ranges in redshift from 0.281 to 0.992. We cannot strictly compare the luminosities of this sample to our own because it contains galaxies over such a wide range of redshift. However, we feel that the more general comparison to such a sample has merit since the effective radii are still directly comparable to ours and the luminosities, while not strictly appropriate, should span the parameter space of all galaxies. The Jørgensen et al. (1995) study is a collection of data for 211 early-type galaxies from 10 different nearby clusters. Photometry was performed on images obtained with the Danish 1.5m telescope at ESO. The targets were selected based on previous identification as cluster members. Magnitudes and sizes were derived using a one-dimensional fit to the photometric curve of growth. The Graham et al. (1996) sample utilizes the photometry done in support of the Lauer & Postman (1994) study of peculiar velocities of Abell clusters. The fits to the BCGs were performed on isophotal profiles extracted from the ground-based images. The Govoni et al. (2000) sample is selected from two radio flux-limited samples (Wall & Peacock, 1985; Ekers et al., 1989). Galaxy sizes and surface-brightnesses were derived via 2D image modeling of ground-based -band images of 79 low-redshift () FRI and FRII radio galaxies. The authors include three components in their model fits, an profile, a nuclear point source (represented by the PSF) and an exponential disk. The three components were combined to obtain the optimal fit. For the size comparisons presented here we use the Govoni et al. (2000) empirically determined half-light radius. For the luminosity comparison we have adopted their quoted total magnitudes, which are based on an extrapolation of the observed surface-brightness profiles rather than the model fits. However, for the purpose of constructing the Kormendy relation we have used solely the parameters from the de Vaucouleurs fit. It should be noted that the Govoni et al. RGs (particularly the FRIs) have total magnitudes (which include point-source and disk components) and sizes comparable to those of the BCGs. The galaxy luminosities and sizes of these samples have all been converted to our chosen cosmology.
4.4.1 Sizes

In Figure 7 we present the size distributions from our own sample along with the data from the literature described above. The NICMOS galaxies have a wide size distribution spanning to kpc. To the eye, their sizes seem most similar to the FRII galaxies of the Govoni et al. (2000) sample (solid line in Fig. 7). We employ the KS test to statistically compare the 3CR galaxies to all the other samples. The local cluster, brightest cluster, and intermediate-redshift field galaxies are wholly inconsistent with the NICMOS 3CR size distribution at greater than 99.5% confidence. The most consistent score, at a statistically inconclusive 65%, is found for the local FRII galaxies as suggested by inspection.
There is no exact counterpart population at low redshift. Lacking such a direct correspondence, we assert that it is unlikely that galaxy size decreases with time. Mergers will either leave the size unchanged, as in the case of accretion of a low-mass galaxy, or perhaps increase the size, in the case of equal mass mergers (e.g., Capelato, de Carvalho, & Carlberg (1995)). If the merger funnels gas to the galaxy center, where it then forms stars, the merger may temporarily shrink the half-light radius. However, this effect will not dominate the observed light for long and is therefore not likely to be a major contributor to observed galaxy properties. Under the scenario where their sizes either remain the same or increase slightly, the 3CR galaxies match up with the local RGs or, if they grow, overlap the BCGs.
The one outlier at small size (3CR 332 at kpc) in the WFPC2 snapshot sample is contaminated by a strong point source. This source has a doubly-peaked line as shown by Halpern (1990), suggesting that we may be observing the nucleus/accretion-disk more directly than in most other radio galaxies. The derived nuclear luminosity in this case is much higher relative to the host galaxy than for the NICMOS galaxies. If this galaxy is removed, the intermediate-redshift radio galaxy size distribution becomes more consistent with the high-redshift one.
4.4.2 Luminosities
In Figure 8 we present the luminosity distributions for the NICMOS sample along with the previously published samples described above. Like the size distributions, the radio galaxy luminosities are roughly bracketed by the luminosities of the other samples. Again, we use the KS test to compare the distribution of our sample galaxies to those from the literature. In contrast to the sizes, however, we perform this comparison for the observed values directly, but also for the observed values modified using an assumed evolutionary scenario.
As determined by the KS test, the high-redshift radio galaxies are not drawn from the low-redshift cluster elliptical or intermediate-redshift radio galaxy distributions at greater than 99.9% confidence. The exceptions are the BCG sample and the local FRI sample. The value for the BCG comparison is a statistically indeterminate 60%, meaning that the 3CR sample is inconsistent with being drawn from the BCG sample at this significance. The value for the low-redshift FRI sample is an also inconclusive, but slightly more consistent, 20%. It is interesting to note that while the sizes seem most consistent with the low-redshift FRIIs, the luminosities coincide with the local FRIs. In order to make a more direct comparison with local samples we have evolved the 3CR galaxies to using the method outlined above (§ 4.3).
When we do this, the luminosity distribution for the current sample shifts fainter by 1.5 - 2.0 magnitudes via passive evolution to zero redshift (dotted line in panel f of Figure 8). The amount of evolution was calculated using the normalized model SED described in § 4.3. We applied the same normalization to the model spectrum aged to zero redshift, and integrated it through the rest-frame Gunn- filter. With this sizable correction the magnitudes are again bracketed by the low-redshift samples. Now the BCGs, cluster galaxies, and local RGs are rejected at significance. While no sample is exactly comparable, the intermediate- RGs are only rejected at the 34% significance level. If 3CR 332 is again thrown out on the basis of its discrepant size, the luminosity distribution of the intermediate-redshift RGs is rejected at only the 25% level, making it the most consistent of the comparison samples.
Another perspective can be taken by comparing the luminosities with much broader, more statistically robust samples. We can judge the relative rarity of the radio galaxies when compared to the more general luminosity functions (LFs) derived from large galaxy samples. At low redshift, the Sloan Digital Sky Survey provides a large number of galaxies for which the luminosity functions have been computed (Blanton et al., 2001). At higher redshift (), we compared our 3CR galaxies to the field galaxy LF from Cowie et al. (1996) and the cluster galaxy LF from de Propris et al. (1999). The Cowie et al. (1996) spectroscopic targets were chosen from an infrared imaging survey covering of the Hawaii Deep Field (areas SSA 13 and 22). We use their measurement of and for the bin as a comparison to our sample. The more recent study done by de Propris et al. (1999) investigates the -band LF in galaxy clusters to . In Figure 9 we show a histogram of our galaxies along with the LFs from the Cowie et al. (1996), de Propris et al. (1999), and (Blanton et al., 2001) samples. Using the assumed passive evolution model as above, we have calculated both the rest-frame -band (with no evolution) and -band magnitudes (evolved to zero redshift) to compare with these two LFs. In both cases, the HzRGs are at the very luminous end of the LF, underscoring their relative rarity.
4.4.3 Kormendy Relation
Local spheroids (early-type galaxies and spiral bulges) define a continuous and low-scatter sequence in the size–surface-brightness plane. This two-dimensional projection of the three-dimensional Fundamental Plane (FP) provides a useful diagnostic of galaxy populations without velocity dispersion measurements. While the physical processes responsible for the correlation are not entirely understood, a scaling relation of this sort is predicted qualitatively by the application of the virial theorem to these stellar systems (assuming a single mass-to-light ratio). Although this may only be illustrative, a galaxy which lies on the Kormendy relation is likely to be in dynamical equilibrium and may share a similar formation history with the other galaxies on the size–surface-brightness locus.
Figure 10 shows our sample alongside the same low-redshift comparison galaxies, excluding the intermediate redshift field ellipticals from Schade et al. (1999). Of these samples, the local cluster, brightest cluster, and radio galaxies are known to lie on the FP (Jørgensen, Franx, & Kjærgaard, 1995; Oegerle & Hoessel, 1991; Bettoni et al., 2001). The 3CR snapshot galaxies form a tight sequence in the size–surface-brightness plane, but kinematic measurements are not yet available for their placement on the FP. A representative error bar for the 3CR galaxies, based on our error analysis in § 3.2, is shown in the lower left corner of the figure.
The 3CR galaxies form a narrow sequence in the size–surface-brightness plot. This is not expected a priori for a set of sources selected via AGN rather than stellar properties (i.e., radio flux). To test the significance of this correlation defined by the high-redshift 3CR galaxies, we have employed a simple rank correlation analysis. The small value of the two-sided significance indicates a strong correlation. The slope of the Kormendy relation is well-defined for low-redshift galaxies where evolutionary effects within the galaxy samples are small. For the NICMOS sources presented here this is not the case; several gigayears ( for our cosmology) have passed between the observed epochs at and . To alleviate this systematic bias we have evolved our sources to a common redshift, , following the procedure outlined above and assuming no evolution of galaxy sizes.
Figure 11 again shows the same comparison galaxies except with the NICMOS sources now passively evolved to zero redshift. The differential evolution between the samples allows the galaxies to fall roughly on the local relation. The slope of the HzRG relation is steeper () than that of the local galaxies (). If we throw out the three point source galaxies (3CRs 65, 265, and 280) the slope is much shallower () and is more in line with the local value. Best et al. (1998) and McLure & Dunlop (2000) correspondingly derive slopes of and for their similar sample of RGs. It is interesting to note that our values range between these two slopes dependent upon the inclusion of the galaxies with a nuclear point-source. The slope is known to be very sensitive, particularly in these small samples, to observational selection effects. To test more robustly whether the evolved sources do, in fact, align with the low-redshift relation, we have utilized the two-dimensional KS test (Peacock, 1983; Fasano & Franceschini, 1987). This test rejects the hypothesis that the 3CRs (evolved to zero redshift) are drawn from the same distribution as any of the local samples, at relatively high significance ( for BCGs to for cluster members). This does not contradict the observed overlap between the high- and low-redshift samples, but rather shows that they are not statistically identical (e.g., as we have already shown, the size and luminosity distributions of the NICMOS 3CR galaxies differ from that of any particular comparison sample). A more lenient test is to look at the surface-brightness distributions in the size range of the HzRGs. Using the one-dimensional KS test for these distributions, we find that the evolved 3CR galaxies are most similar to the low-z FRIs, followed by (in order of increasing rejection) the intermediate-redshift RGs (from the WFPC2 fitting), the low-z FRIIs, and the low-z cluster galaxies. In any case, the HzRG surface-brightnesses overlap those for galaxies of similar size at low redshift when a simple model of passive luminosity evolution is applied.
4.5 Radio Galaxy Evolution

The NICMOS data presented here are unique in their combination of high spatial resolution and near-infrared wavelength coverage. These capabilities have allowed us to study the properties of radio host galaxies in some detail. The RG sizes, luminosities, and morphologies all have implications for the complete picture of radio, as well as perhaps “normal”, galaxy formation and evolution.
A single, passively evolving population which formed at early times () fits the observed - relation for HzRGs very well (e.g., Lilly & Longair, 1984; Jarvis et al., 2001). This result has defined the current radio host evolution paradigm: a massive, passively evolving stellar host dominates the rest-frame optical light and is responsible for the - relation, and a UV bright, but dynamically insignificant, component accounts for the alignment effect. Our data focus on the putative stellar component. Are the rest-frame optical morphologies, sizes, and luminosities consistent with the passive evolution picture?
The existence of a luminous, apparently stellar, continuum component undetected in the rest-frame UV supports the paradigm at its most basic level. Furthermore, the galaxy morphologies are well-described by the de Vaucouleurs profile, which at low redshift is associated with old, red elliptical galaxies. Ellipticals in clusters and the field seem to be passively evolving from early formation times (e.g., Stanford, Eisenhardt, & Dickinson, 1998; Schade et al., 1999). In this context, the fact that the HzRGs are well-fit by the de Vaucouleurs profile suggests that they belong to a similar, if not the same, class of passively evolving sources.
The passive scenario also dictates that the radio hosts will undergo little or no size evolution. The HzRGs have similar effective radii to the low-redshift samples, again supporting the paradigm: the sizes of the RGs are most consistent with the FRII radio hosts. We may, therefore, identify the HzRGs as the progenitors of local radio galaxies. Radio galaxies would then be drawn from a single, passively evolving population of sources formed at a common high redshift. The relative rarity of RGs at any given epoch is explained by noting that the radio emission in FRII sources is likely to be a transient phenomenon occurring on timescales of roughly years (e.g., Alexander & Leahy, 1987; Mack et al., 1998; Kaiser & Alexander, 1999). To follow this argument further, we now discuss the luminosities of the HzRGs.
With no evolution, the radio galaxies are much more luminous than all but the BCGs and BCG-like low-redshift FRI RGs. This is not a completely fair comparison since BCGs are perhaps the product of a “special” formation history (e.g., West, 1994; Aragón-Salamanca, Baugh, & Kauffmann, 1998; Burke, Collins, & Mann, 2000) and are known to have distinct size and luminosity distributions. If instead we restrict the size range of the comparison samples to the same set of values spanned by the high-redshift 3CRs, then the sample outshines all other galaxies including the BCGs. This discrepancy could be due to inherently more luminous galaxies or to the AGN-related light boosting the derived values. Based on the fits and residual images, we believe that the AGN contribution cannot account for a majority of the luminosity difference. We therefore conclude that the RGs are inherently more luminous. If we assume they dim passively, then they fall in the range of local galaxy luminosities. Imposing the galaxy radius restriction as above, the high- 3CR galaxies are fainter than the BCGs and low-redshift RGs, and are brighter than the local cluster galaxies. In partial support of the paradigm, they line up most closely with the intermediate-redshift radio hosts.
In the size–surface-brightness plane the HzRGs evolve onto the local relation, although distinctly distributed from any of the comparison samples. Again the HzRG distribution is most consistent with the local RGs. This correspondence, like the evolved luminosities above, depends on an assumed star-formation history. In order to fade these sources onto the local Kormendy relation and into the luminosity range of local galaxies using the single-burst model, the most recent star-formation cannot occur too early, roughly . However, most of our galaxies would evolve sufficiently with . It is the highest redshift source in our fit sample, 3CR 239 at , that drives to lower redshift the choice for the last major star-formation (which is not necessarily the same as the last major merging epoch). For a galaxy at , changing the “formation” redshift from 2.5 to 5 decreases the amount of fading to by about 0.8 magnitudes. For the other, lower redshift, galaxies in our sample the difference is smaller, about 0.3 magnitudes. Such a low “formation” redshift to accommodate 3CR 239 is problematic because the RG - relation is known to extend to with low scatter. In addition, 3CR 239 exhibits several discrete clumps of emission surrounding the central concentration, suggesting possible residue of formation or in-falling satellites. It is also interesting to note that the highest redshift object in the entire sample, 3CR 256 at , shows no centrally peaked emission and is underluminous at compared to the - relation at that redshift (Chokshi & Eisenhardt, 1991; Simpson et al., 1999). While two data points do not constitute a robust sample, these galaxies suggest that the epoch for radio galaxy formation may extend in some cases to . At it has been shown that a majority of RGs, while falling on the -band Hubble diagram, show few signs of smooth, round host galaxies (van Breugel et al., 1998; Pentericci et al., 2001). So, either we maintain that passive evolution is consistent with our data and 3CR 239 is an outlier (although, unlike 3CR 256, it does not deviate significantly from the mean - relation), or we must imagine an alternate explanation for the observed Hubble diagram.
If the distant radio hosts do not evolve into the local radio-loud galaxies, how is the - relation explained? An alternative posited by Best et al. (1998) is that low- and high-redshift RGs are not linked by evolution, but rather that RGs are only created in host galaxies above a given large galaxy mass. Their main supporting evidence for this view was that the cluster environments of RGs seemed to become less rich at lower redshift, something that cannot happen. The inclusion of a galaxy mass cutoff makes sense in terms of the relationship which has been discovered at low-redshift between black-hole mass and bulge velocity dispersion or luminosity (Magorrian et al., 1998; Gebhardt et al., 2000; Ferrarese & Merritt, 2000). In this scenario, the natural relation between radio luminosity and redshift in a flux-limited sample populates the Hubble diagram in a smooth, continuous way via the correlation of radio power with black hole and bulge mass. While our data cannot address the environment issue, we do not see any comparable “impossible” transformation (e.g., low- RGs being smaller than HzRGs or fainter than passive evolution would predict) that precludes radio galaxies at high- from being drawn from the same population as low- RGs. Given our data, the simplest explanation of the - diagram, passive evolution, remains tenable.
The fact that RGs form a highly-correlated group and follow largely the same analytical profiles (with possibly interesting differences) suggests that they may form a homogeneous sample. Similar behavior among local galaxy samples has been used to argue that the constituent galaxies have followed similar evolutionary paths. While our sample is too small to make such grandiose statements, the size–surface-brightness data certainly do not preclude the possibility that this radio-selected sample constitutes a homogeneous subset of the entire galaxy population. This is seemingly not true for the higher redshift objects, 3CR 239 and 256 in our sample and the galaxies of van Breugel et al. (1998) and Pentericci et al. (2001), which begin to show interesting diversity in their properties.
5 Conclusions and Future
Historically, there have been many attempts to unify the disparate qualities of high-redshift radio galaxies into a full picture of their formation and evolution. HST and NICMOS now play a crucial role in this continuing story. The present observations have targeted 11 3CR radio sources for detailed study. Round, smooth galaxies appear in the NIR and outshine the complex morphologies seen in the rest-frame UV. The NICMOS data have allowed us to analyze these sources in ways that were previously impossible or at least ill-advised.
The salient results of our investigation are briefly summarized: The majority of our sample are well-fit by the de Vaucouleurs profile, with low-level residuals that qualitatively match the rest-frame UV morphologies observed with WFPC2. The derived surface-brightnesses and sizes match well with bright local ellipticals, but are both fainter and smaller than the brightest galaxies found in rich clusters at low-redshift. Apart from one fit source (3CR 239), passive evolution from an early formation epoch () is sufficient to fade the sources to match the local samples. The slope of the Kormendy relation for our sample is steeper than that found for local galaxies, 4.7 compared to 3.5, and may be consistent with a constant luminosity line. If a lower “formation” redshift is chosen, , 3CR 239 can simultaneously be made to fade into the range of low-redshift galaxies. However, comparison to luminosity functions at both low and high redshift illustrates the relative rarity of galaxies at these luminosities, and suggests that HzRGs are quite massive. The 3CR host galaxies may show a tendency to align their major axes with the axis defined by the double radio lobes, but confirmation of this result awaits detailed multi-band analysis.
In short, the radio galaxies seem to be rare, massive objects which are dynamically relaxed. As such they are likely the progenitors of local giant elliptical galaxies. These sources are ideal for follow-up NIR spectroscopy on large telescopes. They are relatively bright at and should have measurable velocity dispersions at relatively low spectral resolution. In addition, similar studies of higher redshift RGs will test whether the evolutionary trends seen here between and continue to even earlier epochs.
A Notes on Individual Objects
3CR 265 (): This galaxy lies in a moderately rich cluster of galaxies (Deltorn, 1998) and is surrounded by spectacularly extended UV emission seen in the WFPC2 images. The extended UV light is strongly polarized (Jannuzi & Elston, 1991) and shows extended, broad MgII emission (Dey & Spinrad, 1996), implying that it is dominated by scattered AGN light. It is, however, significantly misaligned from the radio source axis. The NICMOS image is wholly dominated by a round, symmetric giant elliptical host galaxy. The central surface-brightness is remarkably high, and the model subtraction shows extended, irregular residuals, harboring an obscured point source. The point source fit finds a central nucleus of in the F160W filter.
3CR 184 (): Another cluster galaxy (Deltorn et al., 1997), 3CR 184 is elongated, bimodal, and aligned in the rest-frame UV, but has a dominant gE host galaxy in the NICMOS image. The isophotal elongation of the NICMOS image along the radio source axis is most likely due to the low-level, aligned light seen in the residuals. The WFPC2 image here is from Deltorn et al. (1997).
3CR 280 (): The complex aligned structure visible in the WFPC2 images of Best et al. (1997) largely disappears in the NICMOS data, although the highest surface brightness components remain barely visible. The radio galaxy host appears to be a smooth, symmetric giant elliptical, with a central point source ().
3CR 368 (): The rest-frame UV light from this object is extended over in length along the radio source axis and, surprisingly, is unpolarized. There is a galactic M-star superimposed on the galaxy (Hammer, Proust, & Fèvre, 1991), with another, fainter star at the north end visible in the NICMOS image. Both stars were subtracted before performing the surface-brightness fits. The host galaxy nucleus seen by NICMOS lies at a local minimum in the WFPC2 images; here and in other radio galaxies it is likely that a combination of dust-obscuration and -correction are responsible for rendering the stellar nucleus completely invisible at optical wavelengths. The near-IR central surface brightness of 3CR 368 is low and its surface brightness profile is unusually extended and “flat”. It may be that dust obscuration remains significant in this object even at 0.8m in the rest frame. It is also possible, based on the Sersic law fits, that the host galaxy of 3CR 368 has a more BCG type profile ().
3CR 267 (): The WFPC2 images of 3CR 267 show diffuse emission, several bright knots, and a broad “arc” all distributed generally along the radio source axis. In the NICMOS image, the three brightest knots appear to be three distinct galaxies: the gE radio source host plus two fainter companions, one evidently a disk galaxy. 3CR 267 is also known to inhabit a rich cluster. The fit residuals are very small in this case, without including any point source component.
3CR 210 (): The complex, multicomponent structure seen in the WFPC2 data simplifies to a dominant, if not completely smooth, central host galaxy in the NICMOS image, together with another red companion object. Careful comparison of the WFPC2 and NICMOS data strongly suggests the presence of a thick dust lane obscuring the central regions in the rest-frame UV. Extinction may be responsible for the central distortions still seen at the 0.8m rest frame in the NICMOS data. The 3CR 210 host galaxy seems to have two distinct peaks, which are less distinct in the NICMOS data than in the rest-frame UV. This source also lies near the center of a moderately rich cluster (J-M. Deltorn, private communication).
3CR 65 (): This galaxy was long believed to be a giant elliptical on the basis of ground-based near-IR images (cf. Rigler & Lilly, 1994) and spectroscopy of the 4000Å region (Stockton, Kellogg, & Ridgway, 1995), although Lacy et al. (1995) have argued that it harbors an optically-obscured AGN point source which is detectable in the near-IR. Both points of view may be true: viewed with NICMOS the galaxy appears to be a round gE, but with extremely high central surface brightness. The fits find a central point source with .
3CR 266 (): One of the most elongated of all 3CR galaxies in the rest-frame UV, the alignment of 3CR 266 persists into the near-IR, although the isophotes are generally rounder. The near-IR morphology is striking; cleanly separating into a relaxed, elliptical host and a thin, aligned component nearly identical to the WFPC2 image.
3CR 470 (): This galaxy is extremely faint at optical wavelengths and is barely visible in the WFPC2 images. Indeed it is not entirely clear which of the faint blobs in the WFPC2 data is the actual host: Best et al. (1997) place the radio nucleus between the two. Eisenhardt et al. (1989) noted that the near-IR structure of 3CR 470 is apparently oriented perpendicular to the radio source axis. In the NICMOS images it appears that this is due to the (chance?) alignment of three independent objects distributed roughly in a line.
3CR 239 (): This galaxy is compact and bright in both the optical WFPC2 and NIR NICMOS images. The NICMOS image is dominated by a single, round, centrally concentrated galaxy, but its outer envelope breaks up into several “satellite” lumps. The image is suggestive of a giant but not fully mature elliptical galaxy at , perhaps seen in the process of assembling through accretion. While the profile is well fit by an -law, the residuals again show that extinction may play a large role at rest wavelengths of m.
3CR 256 (): The most distant galaxy in our sample, 3CR 256 is extremely bright in the rest-frame UV and consists of two dominant components, strongly polarized, and closely aligned with the radio source (Jannuzi et al., 1995; Dey et al., 1996). It is elongated/aligned in the near-infrared, and is very subluminous, lying well below the mean - relation at that redshift. On this basis, Eisenhardt & Dickinson (1992) suggested that 3CR 256 may be one of the few true examples of a protogalaxy among the 3CR radio sources (see (Simpson et al., 1999) for a detailed analysis of the spectral energy distribution). In our NICMOS F165M images the galaxy is diffuse, elongated and very faint: it is the one complete exception to the trend toward compactness and symmetry among the NICMOS 3CR observations presented here. One peak of the infrared light lies between the bright UV lobes; there is also a faint, compact red object barely visible in the optical data. An F160W NICMOS image (not shown here) which includes [OIII] line emission has a completely different appearance, dominated by two bright lobes corresponding to those seen in the optical continuum and Lyman .
References
- Alexander & Leahy (1987) Alexander, P. & Leahy, J. P. 1987, MNRAS, 225, 1
- Aragón-Salamanca et al. (1998) Aragón-Salamanca, A., Baugh, C.M., & Kauffmann, G. 1998, MNRAS, 297, 427
- Best et al. (1998) Best, P.N., Longair, M.S., & Röttgering, H.J.A. 1998, MNRAS, 295, 549
- Best et al. (1997) Best, P. N., Longair, M. S., & Röttgering, J. H. A. 1997, MNRAS, 292, 758
- Bettoni et al. (2001) Bettoni, D., Falomo, R., Fasano, G., Govoni, F., Salvo, M., & Scarpa, R. 2001, A&A, 380, 471
- Bevington & Robinson (1992) Bevington, P. R. & Robinson, D. K. 1992, Data reduction and error analysis for the physical sciences New York: McGraw-Hill, 2nd ed.
- Blanton et al. (2001) Blanton, M. R., et al. 2001, AJ, 121, 2358
- Bruzual & Charlot (1993) Bruzual, G. & Charlot, S. 1993, ApJ, 405, 538
- Bruzual (2000) Bruzual, G. A. 2000, in Proceedings of the XI Canary Islands Winter School of Astrophysics on Galaxies at High Redshift, ed. I. Perez-Fournon, M. Balcells, & F. Sanchez. in press, astro-ph/0011094
- Burke et al. (2000) Burke, D. J., Collins, C. A., & Mann, R. G. 2000, ApJ, 532, L105
- Capelato et al. (1995) Capelato, H. V., de Carvalho, R. R., & Carlberg, R. G. 1995, ApJ, 451, 525
- Casertano et al. (2000) Casertano, S., et al. 2000, AJ, 120, 2747
- Chambers et al. (1987) Chambers, K.C., Miley, G.K., & van Breugel, W.J.M. 1987, Nature, 329, 604
- Chokshi & Eisenhardt (1991) Chokshi, A. & Eisenhardt, P. R. M. 1991, Comments on Astrophysics, 15, 343
- Cimatti et al. (1997) Cimatti, A., Dey, A., van Breugel, W., Hurt, T., & Antonucci, R. 1997, ApJ, 476, 677
- Colless et al. (1990) Colless, M., Ellis, R. S., Taylor, K., & Hook, R. N. 1990, MNRAS, 244, 408
- Cowie et al. (1996) Cowie, L. L., Songaila, A., Hu, E. M., & Cohen, J. G. 1996, AJ, 112, 839
- de Koff et al. (1996) de Koff, S., Baum, S. A., Sparks, W. B., Biretta, J., Golombek, D., Macchetto, F., McCarthy, P., & Miley, G. K. 1996, ApJS, 107, 621
- de Koff et al. (2000) de Koff, S., et al. 2000, ApJS, 129, 33
- de Propris et al. (1999) de Propris, R., Stanford, S.A., Eisenhardt, P.R., Dickinson, M., & Elston, R. 1999, AJ, 118, 719
- de Vaucouleurs (1948) de Vaucouleurs, G. 1948, Annales d’Astrophysique, 11, 247
- Deltorn (1998) Deltorn, J-M. 1998. Une Approche Observationnelle de l’Étude des Grandes Structures dans l’Univers Lointain et l’Évolution des Galaxies d’Amas. Ph. D. thesis, Université Paris
- Deltorn et al. (1997) Deltorn, J-M., Le Fèvre, O., Crampton, D., & Dickinson, M. 1997, ApJ, 483, L21
- Dey et al. (1996) Dey, A., Cimatti, A., van Breugel, W., Antonucci, R., & Spinrad, H. 1996, ApJ, 465, 157
- Dey & Spinrad (1996) Dey, A. & Spinrad, H. 1996, ApJ, 459, 133
- Dey et al. (1997) Dey, A., van Breugel, W., Vacca, W.D., & Antonucci, R. 1997, ApJ, 490, 698
- di Serego Alighieri et al. (1994) di Serego Alighieri, S., Cimatti, A., & Fosbury, R.A.E. 1994, ApJ, 431, 123
- Dickinson (1999) Dickinson, M. (Ed.) 1999, NICMOS Data Handbook(4.0 ed.). (Baltimore: STScI)
- Dickinson et al. (1995) Dickinson, M., Dey, A., & Spinrad, H. 1995, in LNP Vol. 463: Galaxies in the Young Universe 164
- Dickson et al. (1995) Dickson, R., Tadhunter, C., Shaw, M., Clark, N., & Morganti, R. 1995, MNRAS, 273, L29
- Douglas et al. (1996) Douglas, J. N., Bash, F. N., Bozyan, F. A., Torrence, G. W., & Wolfe, C. 1996, AJ, 111, 1945
- Eales et al. (1997) Eales, S., Rawlings, S., Law-Green, D., Gotter, G., & Lacy, M. 1997, MNRAS, 291, 593
- Eales et al. (1993) Eales, S. A., Rawlings, S., Dickinson, M., Spinrad, H., Hill, G. J., & Lacy, M. 1993, ApJ, 409, 578
- Ekers et al. (1989) Ekers, R. D., et al. 1989, MNRAS, 236, 737
- Fasano & Franceschini (1987) Fasano, G. & Franceschini, A. 1987, MNRAS, 225, 155
- Ferrarese & Merritt (2000) Ferrarese, L. & Merritt, D. 2000, ApJ, 539, 9
- Fruchter & Hook (2002) Fruchter, A. S. & Hook, R. N. 2002, PASP, 114, 144
- Fukugita et al. (1995) Fukugita, M., Shimasaku, K., & Ichikawa, T. 1995, PASP, 107, 945
- Gebhardt et al. (2000) Gebhardt, K., et al. 2000, ApJ, 539, L13
- Govoni et al. (2000) Govoni, F., Falomo, R., Fasano, G., & Scarpa, R. 2000, A&A, 353, 507
- Graham et al. (1996) Graham, A., Lauer, T.R., Colless, M., & Postman, M. 1996, ApJ, 465, 534
- Graham et al. (2001) Graham, A. W., Erwin, P., Caon, N., & Trujillo, I. 2001, ApJ, 563, L11
- Halpern (1990) Halpern, J. P. 1990, ApJ, 365, 51
- Hammer et al. (1991) Hammer, F., Proust, D., & Fèvre, O. Le 1991, ApJ, 374, 91
- Heckman et al. (1985) Heckman, T.M., Carty, T.J., & Bothun, G.D. 1985, ApJ, 288, 122
- Heckman et al. (1986) Heckman, T. M., Smith, E. P., Baum, S. A., van Breugel, W. J. M., Miley, G. K., Illingworth, G. D., Bothun, G. D., & Balick, B. 1986, ApJ, 311, 526
- Hill & Lilly (1991) Hill, G.J. & Lilly, S.J. 1991, ApJ, 367, 1
- Jannuzi et al. (1995) Jannuzi, B.T., Elston, R., Schmidt, G.D., Smith, P.S., & Stockman, H.S. 1995, ApJ, 454, 111
- Jannuzi & Elston (1991) Jannuzi, B. T. & Elston, R. 1991, ApJ, 366, 69
- Jarvis et al. (2001) Jarvis, M.J., Rawlings, S., Eales, S., Blundell, K.M., Bunker, A.J., Croft, S., McLure, R.J., & Willott, C.J. 2001, MNRAS, 326, 1585
- Jørgensen et al. (1995) Jørgensen, I., Franx, M., & Kjærgaard, P. 1995, MNRAS, 273, 1097
- Kaiser & Alexander (1999) Kaiser, C. R. & Alexander, P. 1999, MNRAS, 302, 515
- Krist (1995) Krist, J. 1995, in ASP Conf. Ser. 77: Astronomical Data Analysis Software and Systems IV, Volume 4 349
- Lacy et al. (1995) Lacy, M., Rawlings, S., Eales, S., & Dunlop, J.S. 1995, MNRAS, 273, 821
- Lauer et al. (1995) Lauer, T.R., et al. 1995, AJ, 110, 2622
- Lauer & Postman (1994) Lauer, T. R. & Postman, M. 1994, ApJ, 425, 418
- Le Fèvre et al. (1995) Le Fèvre, O., Lilly, S. J., Crampton, D., Hammer, F., & Tresse, L. 1995, in Seventeeth Texas Symposium on Relativistic Astrophysics and Cosmology, Volume 759 612
- Lilly & Longair (1984) Lilly, S.J. & Longair, M.S. 1984, MNRAS, 211, 833
- Longo & Puddu (1997) Longo, G. & Puddu, E. 1997, A&A, 320, 415
- Mack et al. (1998) Mack, K.-H., Klein, U., O’Dea, C. P., Willis, A. G., & Saripalli, L. 1998, A&A, 329, 431
- Magorrian et al. (1998) Magorrian, J., et al. 1998, AJ, 115, 2285
- Martel et al. (1999) Martel, A.R., et al. 1999, ApJS, 122, 81
- Matthews et al. (1964) Matthews, T.A., Morgan, W.W., & Schmidt, M. 1964, ApJ, 140, 35
- McCarthy et al. (1987) McCarthy, P.J., Breugel, van W.J.M., Spinrad, H., & Djorgovski, S.G. 1987, ApJ, 321, 29
- McCarthy (1993) McCarthy, P. J. 1993, ARA&A, 31, 639
- McCarthy et al. (1997) McCarthy, P. J., Miley, G. K., de Koff, S., Baum, S. A., Sparks, W. B., Golombek, D., Biretta, J., & Macchetto, F. 1997, ApJS, 112, 415
- McCarthy et al. (1995) McCarthy, P. J., Spinrad, H., & van Breugel, W. 1995, ApJS, 99, 27
- McLure & Dunlop (2000) McLure, R. J. & Dunlop, J. S. 2000, MNRAS, 317, 249
- Oegerle & Hoessel (1991) Oegerle, W. R. & Hoessel, J. G. 1991, ApJ, 375, 15
- Papadopoulos et al. (2000) Papadopoulos, P. P., Röttgering, H. J. A., van der Werf, P. P., Guilloteau, S., Omont, A., van Breugel, W. J. M., & Tilanus, R. P. J. 2000, ApJ, 528, 626
- Peacock (1983) Peacock, J. A. 1983, MNRAS, 202, 615
- Pentericci et al. (2001) Pentericci, L., McCarthy, P. J., Röttgering, H. J. A., Miley, G. K., van Breugel, W. J. M., & Fosbury, R. 2001, ApJS, 135, 63
- Press et al. (1992) Press, W.H., Teukolsky, S.A., Vetterling, W.T., & Flannery, B.P. 1992, Numerical Recipes in C: The Art of Scientific Computing(2 ed.). (Cambridge: Cambridge University Press)
- Rigler & Lilly (1994) Rigler, M.A. & Lilly, S.J. 1994, ApJ, 427, 79
- Rigler et al. (1992) Rigler, M.A., Lilly, S.J., Stockton, A., Hammer, F., & Fèvre, O. Le 1992, ApJ, 385, 61
- Schade et al. (1999) Schade, D., et al. 1999, ApJ, 525, 31
- Sersic (1968) Sersic, J.L. 1968, Atlas de galaxias australes Cordoba, Argentina: Observatorio Astronomico, 1968
- Simpson et al. (1999) Simpson, C., et al. 1999, ApJ, 525, 659
- Smith & Heckman (1989) Smith, E. P. & Heckman, T. M. 1989, ApJ, 341, 658
- Stanford et al. (1998) Stanford, S. A., Eisenhardt, P. R., & Dickinson, M. 1998, ApJ, 492, 461
- Stockton et al. (1995) Stockton, A., Kellogg, M., & Ridgway, S.E. 1995, ApJ, 443, 69
- Tran et al. (1998) Tran, H.D., Cohen, M.H., Ogle, P.M., Goodrich, R.W., & di Serego Alighieri, S. 1998, ApJ, 500, 660
- Trujillo et al. (2001) Trujillo, I., Graham, A. W., & Caon, N. 2001, MNRAS, 326, 869
- van Breugel et al. (1998) van Breugel, W. J. M., Stanford, S. A., Spinrad, H., Stern, D., & Graham, J. R. 1998, ApJ, 502, 614
- Wall & Peacock (1985) Wall, J. V. & Peacock, J. A. 1985, MNRAS, 216, 173
- West (1994) West, M. J. 1994, MNRAS, 268, 79
| 3CR | RAaaRadio source coordinates (J2000) from Douglas et al. (1996) | DecaaRadio source coordinates (J2000) from Douglas et al. (1996) | RAbbNICMOS galaxy coordinates (J2000) as measured from image WCS, subject to absolute errors of | DecbbNICMOS galaxy coordinates (J2000) as measured from image WCS, subject to absolute errors of | Redshift | Filter | Rest-frame | Exposure | Dithers | Estimated Line |
|---|---|---|---|---|---|---|---|---|---|---|
| (J2000) | (J2000) | (J2000) | (J2000) | Range (Å) | (s) | ContaminationccCalculated assuming the composite spectrum of McCarthy (1993) | ||||
| (1) | (2) | (3) | (4) | (5) | (6) | (7) | (8) | (9) | (10) | (11) |
| 265 | 11h45m31.87s | +31d33m43.4s | 11h45m29.0s | +31d33m47s | 0.811 | F160W | 7805 - 9997 | 2559 | 4 | mag ([SIII]) |
| 184 | 07h39m24.47s | +70d23m10.9s | 07h39m24.2s | +70d23m27s | 0.994 | F160W | 7089 - 9080 | 5134 | 6 | mag |
| 280 | 12h56m57.49s | +47d20m20.2s | 12h56m57.7s | +47d20m21s | 0.996 | F160W | 7082 - 9071 | 5134 | 6 | mag |
| 368 | 18h05m06.36s | +11d01m32.6s | 18h05m06.4s | +11d01m33s | 1.131 | F165M | 7293 - 8218 | 10268 | 12 | mag |
| 267 | 11h49m56.53s | +12d47m19.0s | 11h49m56.6s | +12d47m19s | 1.140 | F165M | 7263 - 8183 | 10268 | 12 | mag |
| 210 | 08h58m09.96s | +27d50m51.6s | 08h58m10.0s | +27d50m54s | 1.169 | F165M | 7166 - 8074 | 10268 | 12 | mag |
| 65 | 02h23m43.19s | +40d00m52.5s | 02h23m43.4s | +40d00m53s | 1.176 | F165M | 7142 - 8048 | 7701 | 9 | mag |
| 266 | 11h45m43.37s | +49d46m08.2s | 11h45m43.4s | +49d46m08s | 1.275 | F165M | 6832 - 7698 | 8727 | 13 | mag |
| 470 | 23h58m35.34s | +44d04m38.9s | 23h58m36.0sddAssuming the middle source in the ‘trio’ is the radio galaxy. See the cutout in Figure 1 | +44d04m45sddAssuming the middle source in the ‘trio’ is the radio galaxy. See the cutout in Figure 1 | 1.653 | F160W | 5328 - 6824 | 7701 | 9 | mag (H) |
| 239 | 10h11m45.42s | +46d28m19.7s | 10h11m45.3s | +46d28m20s | 1.781 | F160W | 5083 - 6510 | 7701 | 9 | mag ([OIII]) |
| 256 | 11h20m43.05s | +23d27m55.0s | 11h20m43.0s | +23d27m54s | 1.819 | F165M | 5513 - 6212 | 7701 | 9 | mag |
| F160W | 5014 - 6422 | 5134 | 6 |
| Object | Filter | bbMeasured in a 63.9 kpc diameter aperture, calculated in our adopted cosmology | ccTotal aperture light of the best fit de Vaucouleurs model and point source (where applicable) | ddTotal light in the best fit de Vaucouleurs model (no point source component) | eePoint source magnitudes. Upper limits are derived from the maximal allowed (within 1 errors) point source component, and are shown for galaxies which were better fit by the pure galaxy model |
|---|---|---|---|---|---|
| (Aperture Data) | (Aperture Model) | (Total Galaxy) | (Pt. Src.) | ||
| (1) | (2) | (3) | (4) | (5) | (6) |
| 3CR 265 | F160W | 18.67 | 18.70 | 18.74 | 22.84 |
| 3CR 184 | F160W | 19.27 | 19.28 | 19.04 | 30.03 |
| 3CR 280 | F160W | 19.53 | 19.51 | 19.49 | 23.03 |
| 3CR 368 | F165M | 20.10 | 20.18 | 19.75 | 28.31 |
| 3CR 267 | F165M | 20.19 | 20.22 | 20.07 | 25.12 |
| 3CR 210 | F165M | 19.71 | 19.68 | 19.12 | 28.09 |
| 3CR 65 | F165M | 19.26 | 19.43 | 19.35 | 22.75 |
| 3CR 266 | F165M | 20.09 | 20.16 | 19.92 | 29.07 |
| 3CR 470 | F160W | 21.15ffAssuming the middle source in the ’trio’ is the radio galaxy. See the cutout in Figure 1 | |||
| 3CR 239 | F160W | 19.88 | 19.87 | 19.68 | 27.19 |
| 3CR 256 | F165M | 20.76 |
| Object | Outer Fit | bbEffective radius in arcseconds | ccEffective radius in kiloparsecs | ddAverage surface-brightness within effective radius in rest-frame Gunn- magnitudes per square arcsecond | Ellip.eeEllipticity | PAffPosition angle | Sersic Index | MrhhAbsolute (total) Gunn- magnitudes | MKiiAbsolute (total) rest-frame magnitudes | Stellar MassjjStellar Mass as derived from the SED normalization to the NICMOS data | |
|---|---|---|---|---|---|---|---|---|---|---|---|
| Radius (′′) | (′′) | (kpc) | (mag/) | (∘E of N) | () | (mag) | (mag) | (mag) | ( ) | ||
| (1) | (2) | (3) | (4) | (5) | (6) | (7) | (8) | (9) | (10) | (11) | (12) |
| 3CR 265 | 7.5 | 0.46 | 3.77 | 17.87 | 0.157 | 171 | 5.5 | 0.52 | -23.58 | -24.57 | 5.83 |
| 3CR 184 | 3.8 | 1.10 | 9.46 | 19.59 | 0.227 | 82 | 2.6 | 0.37 | -23.86 | -24.85 | 6.33 |
| 3CR 280 | 7.5 | 0.55 | 4.75 | 18.53 | 0.173 | 91 | 6.8 | 0.37 | -23.42 | -24.41 | 4.23 |
| 3CR 368 | 7.5 | 1.54 | 13.62 | 20.75 | 0.157 | 171 | 5.7 | 0.32 | -23.49 | -24.45 | 4.01 |
| 3CR 267 | 3.8 | 0.77 | 6.83 | 19.53 | 0.155 | 49 | 4.2 | 0.30 | -23.21 | -24.11 | 2.92 |
| 3CR 210 | 7.5 | 1.93 | 17.14 | 20.50 | 0.367 | 10 | 2.8 | 0.27 | -24.24 | -25.14 | 7.54 |
| 3CR 65 | 3.8 | 0.68 | 6.04 | 18.45 | 0.017 | 8 | 4.4 | 0.26 | -24.02 | -24.92 | 6.18 |
| 3CR 266 | 3.8 | 1.09 | 9.82 | 19.83 | 0.324 | 5 | 2.6 | 0.19 | -23.70 | -24.57 | 4.20 |
| 3CR 239 | 3.8 | 0.90 | 8.19 | 18.16 | 0.182 | 180 | 3.9 | -0.18 | -24.98 | -25.56 | 5.90 |
| Object | Redshift | Filter | bbEffective radius in arcseconds | ccEffective radius in kiloparsecs | ddAverage surface-brightness within effective radius in rest-frame Gunn- magnitudes per square arcsecond | Ellip.eeEllipticity | PAffPosition angle | MrhhAbsolute (total) Gunn- magnitudes | |
|---|---|---|---|---|---|---|---|---|---|
| (′′) | (kpc) | (mag/) | (∘E of N) | (mag) | (mag) | ||||
| (1) | (2) | (3) | (4) | (5) | (6) | (7) | (8) | (9) | (10) |
| 3CR 35 | 0.03 | F702W | 5.87 | 3.85 | 21.07 | 0.281 | 112 | 0.08 | -20.42 |
| 3CR 310 | 0.05 | F702W | 10.57 | 11.86 | 21.58 | 0.284 | 81 | 0.04 | -22.36 |
| 3CR 403 | 0.06 | F702W | 8.35 | 10.27 | 20.86 | 0.320 | 34 | 0.02 | -22.77 |
| 3CR 452 | 0.08 | F702W | 3.54 | 5.83 | 20.23 | 0.263 | 103 | -0.02 | -22.17 |
| 3CR 314 | 0.12 | F702W | 2.70 | 6.27 | 20.68 | 0.154 | 76 | -0.10 | -21.87 |
| 3CR 332 | 0.15 | F702W | 0.11 | 0.32 | 14.85 | 0.053 | 54 | -0.16 | -21.24 |
| 3CR 381 | 0.16 | F702W | 1.50 | 4.48 | 19.54 | 0.098 | 53 | -0.18 | -22.28 |
| 3CR 346 | 0.16 | F702W | 0.44 | 1.32 | 17.99 | 0.067 | 113 | -0.19 | -21.18 |
| 3CR 219 | 0.17 | F702W | 0.79 | 2.51 | 18.41 | 0.113 | 110 | -0.21 | -22.16 |
| 3CR 63 | 0.17 | F702W | 0.71 | 2.28 | 18.43 | 0.215 | 84 | -0.21 | -21.92 |
| 3CR 234 | 0.18 | F675W | 0.74 | 2.45 | 18.32 | 0.096 | 109 | -0.30 | -22.20 |
| 3CR 319 | 0.19 | F702W | 0.58 | 2.01 | 18.70 | 0.148 | 152 | -0.25 | -21.38 |
| 3CR 436 | 0.21 | F675W | 4.39 | 16.49 | 21.41 | 0.218 | 11 | -0.36 | -23.25 |
| 3CR 93 | 0.24 | F675W | 1.37 | 5.67 | 20.28 | 0.259 | 130 | -0.43 | -22.06 |
| 3CR 79 | 0.26 | F675W | 1.59 | 6.81 | 19.40 | 0.074 | 20 | -0.45 | -23.34 |
| Parameter | Values |
|---|---|
| (pixels)aaThese sizes correspond to effective radii of roughly 1 - 20 kpc at in our assumed cosmology, and | 3, 5, 10, 15, 30, 60 |
| (cts/s/pixel) | 100 |
| Point Source Strength | |
| (% of total galaxy light) | 0, 1, 5, 10, 20 |
| Signal-to-Noise | |
| (per pixel at ) | 0.2, 1, 5, 15 |