Binarity in Brown Dwarfs: T Dwarf Binaries Discovered with the Hubble Space Telescope WPFC2
Abstract
We present the discovery of two T dwarf binaries, 2MASS 12252739AB and 2MASS 15342952AB, identified in a sample of ten T dwarfs imaged with the Hubble Space Telescope Wide Field Planetary Camera 2. Companionship is established by the uniquely red F814WF1042M colors of the binary components, caused by heavily pressure-broadened K I absorption centered at 7665 & 7699 Å. The separations of the two binary systems are 02820005 and 00650007, implying projected separations of 3.170.14 and 1.00.3 AU, respectively. These close separations are similar to those found in previous brown dwarf binary searches, and permit orbital mapping over the coming decade. 2MASS 12252739AB has a substantially fainter secondary, with MF814W = 1.590.04 and MF1042M = 1.050.03; this system is likely composed of a T6 primary and T8 secondary with mass ratio 0.7–0.8. The observed binary fraction of our HST sample, 20%, is consistent with results obtained for late-M and L field dwarfs, and implies a bias-corrected binary fraction of 9% for AU and , significantly lower than the binary fractions of F–G and early-type M dwarf stars. Neither of the T binaries have separations AU, consistent with results from other brown dwarf binary searches. Using the statistical models of Weinberg, Shapiro, & Wasserman, we conclude that tidal disruption by passing stars or Giant Molecular Clouds, which limits the extent of wide stellar binaries, plays no role in eliminating wide brown dwarf binaries, implying either disruption very early in the formation process (ages Myr) or a formation mechanism which precludes such systems. We find that the maximum binary separation in the brown dwarf regime appears to scale as M, a possible clue to the physical mechanism which restricts wide substellar systems.
1 Introduction
T dwarfs are low-temperature (Teff 1300–1500 K) brown dwarfs exhibiting distinct absorption bands of CH4 in the near-infrared H- and K-bands (Kirkpatrick et al., 1999; Burgasser et al., 2002d; Geballe et al., 2002). They are distinguished from warmer L-type (Kirkpatrick et al., 1999; Martín et al., 1999) and M-type brown dwarfs by the presence of the CH4 bands, in addition to significant H2O and collision-induced (CIA) H2 absorption in the near-infrared. These molecular features, combined with pressure-broadened K I and Na I absorption at red-optical wavelengths (Tsuji, Ohnaka, & Aoki, 1999; Burrows, Marley, & Sharp, 2000; Liebert et al., 2000), force the emergent spectral energy distributions of T dwarfs to peak around 1 . Since the discovery of the prototype of this class, Gliese 229B (Nakajima et al., 1995; Oppenheimer et al., 1995), over 30 T dwarfs have been identified in wide-field surveys such as the Two Micron All Sky Survey (Burgasser et al., 1999, 2000c, 2003, 2002d, hereafter 2MASS; Skrutskie et al. 1997) and the Sloan Digital Sky Survey (Strauss et al., 1999; Tsvetanov et al., 2000; Leggett et al., 2000; Geballe et al., 2002, hereafter SDSS; York et al. 2000), deep narrow-field surveys (Cuby et al., 1999; Liu et al., 2002; Zapatero Osorio et al., 2002), and as companions to nearby stars (Nakajima et al., 1995; Burgasser et al., 2000b; Els et al., 2001).
For both stars and brown dwarfs, multiplicity is one of the fundamental properties that probes formation processes. Multiple systems are common among main sequence stars, with roughly 60% of solar-type stellar systems found to be comprised of two or more components (Abt & Levy, 1976; Abt, 1987; Duquennoy & Mayor, 1991). In contrast, only 32–42% of field M dwarf systems are multiple (Henry & McCarthy, 1990; Fischer & Marcy, 1992; Reid & Gizis, 1997). Recent investigations of late-M and L field dwarf samples yield even smaller multiplicity fractions, only 20-30% (Koerner et al., 1999; Reid et al., 2001; Close et al., 2002). Furthermore, while the separation distribution of F-M stellar pairs appears to be broad (ranging from approximately 0.1 AU to 0.1 pc) and unimodal (peaking around 3-30 AU), all late-M and L dwarf binaries identified to date have apparent separations and projected separations AU (Martín, Brandner & Basri, 1999; Koerner et al., 1999; Reid et al., 2001; Leggett et al., 2001; Close et al., 2002). Ejection models for brown dwarf formation (Reipurth & Clarke, 2001; Bate, Bonnell, & Bromm, 2002) have been proposed to explain this dearth of widely-separated, low-mass dwarf pairs, which may be the result of nature (i.e., inherent in the formation process itself) or nurture (i.e., due to dynamical scattering).
In this article, we present imaging results for the first T dwarf binary search sample, undertaken using the Hubble Space Telescope (HST) Wide Field Planetary Camera 2 (Biretta et al., 2002, hereafter WPFC2). In 2 we describe the observations and image reduction techniques, and identify closely-separated sources near two of our T dwarf targets. In 3 we describe our photometric analysis, presenting aperture photometry and colors for our complete sample. The colors of the individual components of the 2MASS 12252739111Throughout the main text, we abbreviate object names to 2MASS hhmmddmm; full designations are given in Table 1. and 2MASS 15342952 pairs confirm their companionship. We discuss our PSF fitting in 4, by which we derive rigorous flux ratios and separations for the two T binaries, and quantify our search limits. In 5 we discuss individual targets in detail, including a possible faint companion to 2MASS 12170311. In 6 we analyze binary statistics for field L and T dwarfs, and compare to stellar samples. Finally, we discuss our results in light of brown dwarf binary formation and destruction processes in 7, and conclude that the small separations of these systems are not due to disruptive encounters with stars and Giant Molecular Clouds (GMCs) in the Galaxy, but are more likely imposed early on in the formation process.
2 Observations
We imaged a sample of ten T dwarfs identified in a magnitude-limited search of the 2MASS database (Burgasser et al., 1999, 2000b, 2000c, 2002d) in the WPFC2 F814W (Å) and F1042M (Å) filters during HST Cycle 9. A log of observations is given in Table 1. The F814W and F1042M filters were chosen to sample the red wing of the pressure-broadened K I doublet, as the strength of this feature allows late-type L and T dwarfs to stand out from nearly all background sources in red optical colors (e.g., I–z; Leggett et al. 2000). Each object was centered on the PC chip and observed twice (to allow for cosmic-ray subtraction) in both filters for total exposure times ranging from 2000 to 2600 sec.
Images were reduced by standard pipeline processing, which includes analog-to-digital correction, removal of the bias pedestal, subtraction of bias and dark frames, and division by an appropriate flat field image. No correction to shutter shading was required due to the long exposure times. The images were then combined using a cosmic ray rejection routine developed at NASA Goddard, based on an improved version of the CR_REJECT routine written by R. S. Hill. Bad pixels identified both in the data quality arrays and the cosmic ray rejection routine were replaced by the mean of neighboring pixels to produce the final, cleaned image. We note that a reflection arc from an offset bright star appears on the F814W PC chip images of 2MASS 23561553, caused by non-optimal baffling of this detector (Biretta et al., 2002). This reflection leads to a slightly higher background in the vicinity of the source but does not affect our background-subtracted photometry (3.1). No other residual or reflection artifacts are seen in the data.
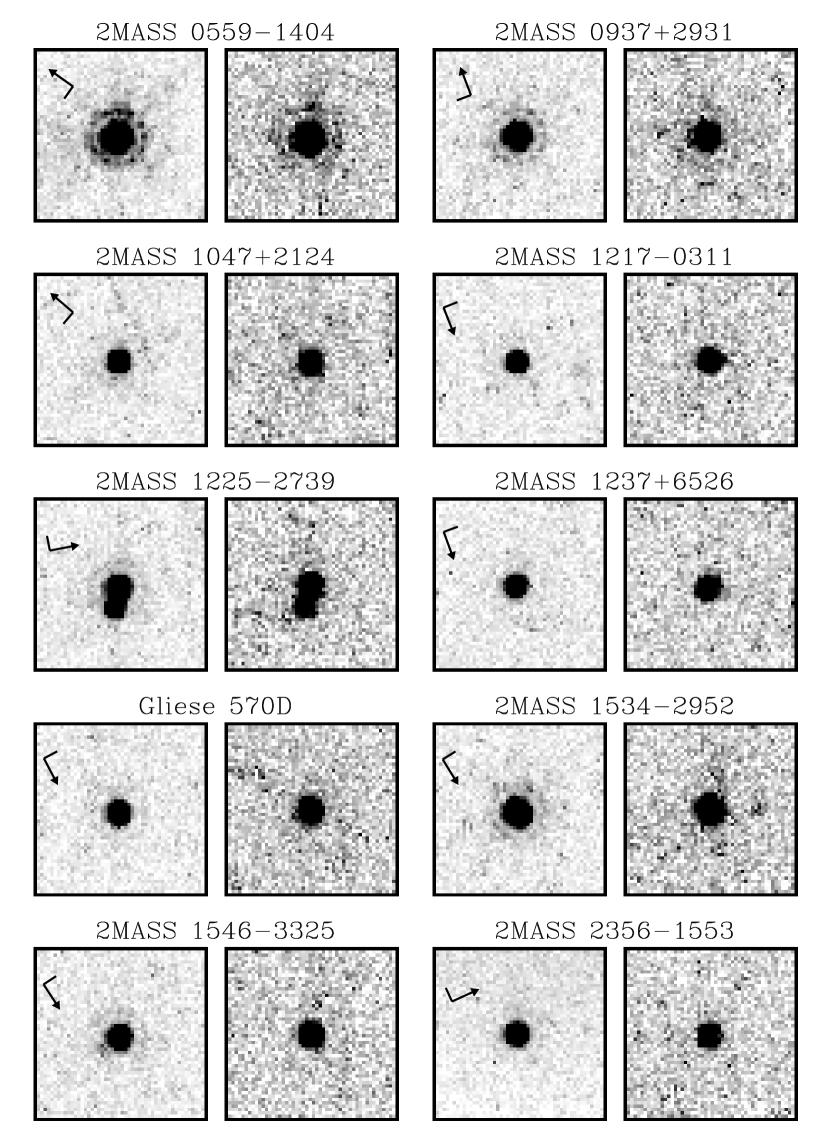
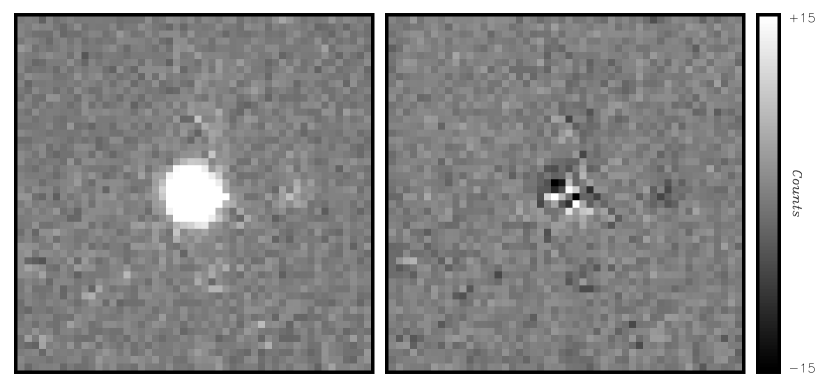
Sections of the reduced PC images 23 on a side around each of the primary targets are shown in Figure 1. North/east orientations are indicated by arrows. We immediately identify two closely-separated objects near the position of 2MASS 12252739 in both the F814W and F1042M images, with the western component appearing to be fainter at both bands. 2MASS 15342952 is slightly elongated along a north/south axis as compared to both the other T dwarf targets and other sources in the 2MASS 15342952 PC field, as is shown in more detail in Figure 2. We attribute this elongation to a marginally resolved pair of point sources (4.2). All of the other T dwarf targets appear to be single point sources at the spatial resolution of the PC chip (0046).
3 Photometry
3.1 Aperture Photometry
Sources on all four WPFC2 chips were initially identified with the IRAF222IRAF is distributed by the National Optical Astronomy Observatories, which are operated by the Association of Universities for Research in Astronomy, Inc., under cooperative agreement with the National Science Foundation. DAOFIND routine, and then confirmed by visual inspection. We extracted aperture photometry for each source using the IRAF PHOT routine, using 2, 3, and 5 pixel apertures, corresponding to 009, 014, and 023 on the PC chip and 020, 030, and 050 on the WF chips. Background values were determined using a centroid algorithm in a 15 pixel annulus 10 pixels from each source. Individual aperture corrections were then measured for each single star (neglecting galaxies and residual cosmic rays) by integrating their radial profiles to 20 pixels. Because our fields were generally at high galactic latitudes, source densities were low, and many fields (particularly those in the F1042M filter) had few or no stellar sources on a particular chip. Hence, a mean set of aperture corrections were derived from all point sources in each chip and filter; these values are given in Table 2. After applying the aperture corrections, flux values were corrected for geometric distortion and charge-transfer efficiency (CTE), the latter by the prescription of Whitmore, Heyer, & Casertano (1999). Because of the long exposure times and high backgrounds, typical CTE corrections generally did not exceed 20%. No corrections for instrument contamination were made, as they are exceedingly small in these red filters (Biretta et al., 2002). Synthetic flux zeropoints from Baggett et al. (1997) were used to convert the corrected magnitudes to the WPFC2 photometric system. A final source list was compiled by requiring detections in both filters and positional coincidence within 1 pixel; this constraint eliminated most residual cosmic rays (however, see 5.2).
Because aperture corrections were made for point-source radial profiles, extended sources such as galaxies or close doubles were readily identified by significant differences in derived photometry depending on aperture size. This effect verified the slight elongation of 2MASS 15342952. All other T dwarf targets (including the two close sources in the 2MASS 12252739 field) have photometry in each aperture consistent with the formal uncertainties. We adopt the 3-pixel aperture magnitudes for point sources (optimizing the signal-to-noise ratio), except for the second source in the 2MASS 12252739 field, where we select a 2-pixel aperture to minimize the contribution of the brighter nearby source; and extended sources, including 2MASS 15342952, where we select 5-pixel aperture magnitudes to minimize aperture corrections. HST WPFC2 and 2MASS J-band magnitudes and colors for our T dwarf targets and Gliese 229B333J-band photometry for Gliese 229B is on the UKIRT system (Casali & Hawarden, 1992), which is similar to the 2MASS photometric system (Carpenter, 2001; Dahn et al., 2002). (Golimowski et al., 1998; Leggett et al., 1999) are listed in Table 3.
3.2 T Dwarf Colors
Figure 3 plots F814W magnitude versus F814WF1042M color for all sources identified in the ten WPFC2 datasets, along with data for Gliese 229B. Single point sources and target objects are plotted as solid circles, while extended sources (i.e., galaxies) are plotted as open circles. Primary T dwarf targets are individually labelled, all of which are 2–3 magnitudes redder than the background stellar and galactic sources, again due to the red wing of the pressure-broadened K I doublet. Both sources at the position of 2MASS 12252739 lie at red colors, implying that both are T dwarfs. Based on the estimated surface density of T dwarfs detectable by 2MASS, 8.410-4 deg-2 (Burgasser et al., 2002d), which we extrapolate to a limiting J magnitude of 17 (the apparent J magnitude of 2MASS 12252739B; see below), the probability of two relatively bright T dwarfs randomly lying within 18 of each other (the approximate search radius on the PC chip) is 310-7. We therefore confidently claim companionship for these two objects based on their proximity and unique colors. By the same argument, the two sources at the position of 2MASS 15342352 are also companion T dwarfs, based on the red color of their combined light. Hereafter, we refer to these two systems as 2MASS 12252739AB and 2MASS 15342352AB.
Figure 4 plots the F814WF1042M versus F814WJ color-color diagram for the observed T dwarfs and Gliese 229B. Note that the colors of single targets follow a fairly linear trend:
| (1) |
Because 2MASS 12252739 is unresolved by 2MASS, we determined J-band component magnitudes from the combined light magnitude, J = 15.220.05, and the J-band flux ratio,
| (2) |
using Eqn. 1 and the photometry listed in Table 3. The F814WJ colors for these two objects both lie 0.15 mag below the linear fit traced by the single stars, but are consistent within the photometric uncertainties. The combined light F814WJ color of 2MASS 15342952AB is also below the single star locus, but in this case it is probably because the object is marginally resolved in the WPFC2 images. On the other hand, 2MASS 12170311 is slightly redder in F814WJ color than expected, although by no more than 2. Both F814WF1042M and F814WJ colors are generally redder for the later-type T dwarfs, with the former being particularly sensitive to spectral type. One notable exception is the T6.5 emission-line dwarf 2MASS 1237+6526 (Burgasser et al., 2000a), which has the reddest F814WF1042M color in the sample (see 5.3). On the other hand, F1042MJ colors generally decrease for later spectral types, likely due to increased H2O and CH4 absorption around 1.25 (Burgasser et al., 2002d).
4 PSF Fitting
4.1 Technique
In order to derive separations and flux ratios for our two T dwarf binaries, and search for faint companions around the other target sources, we performed point spread function (PSF) subtraction on all of our primary targets. Our technique was as follows: first, we extracted subimages of all apparently single point sources from the PC chip images of all ten datasets, a total of 22 sources in F814W and 11 in F1042M. These included some of the target objects, although care was taken to exclude any point sources with bad pixels near the source peak. We then subtracted two-dimensional Gaussian fits to the PSFs from the images; typical residuals were consistently % of the original source peak. Finally, we averaged these Gaussian-subtracted images, scaled by the fit maximum, to produce a single PSF residual image for each filter.
For each of our target sources, we searched for faint companions using an iterative reduction routine. Model images were constructed by combining two PSF residual images with two Gaussian surfaces having the same FWHM as the PSF fits described above, each scaled to separate component fluxes. For 2MASS 12252739AB and 2MASS 15342952AB, initial guesses were based on the approximate positions and flux ratios from the aperture photometry (we assumed 2MASS 15342952AB to be separated by 1 pixel along each axis as an initial guess). Our routine then iteratively searched for the optimal solution to the primary position, secondary position, primary flux, and secondary flux, in that order, by shifting the component positions in steps of 0.1 pixels and scaling the fluxes in steps of 1% (0.01 mag). If the secondary flux was scaled below 1 count or separations below 0.5 pixels were reached, then the object was considered a single point source. Otherwise, the routine derived separations, position angles, and flux ratios for the optimal binary solution.
For all of the apparently single targets, we followed up this process by fitting a single PSF residual plus Gaussian to the image and then searching by eye for any obvious counterparts. We then used the same binary search routine for each image with 20 random companion initial positions. If no companion brighter than the S/N = 7 detection limits (approximately 25.5 mag at F814W and 19.9 mag at F1042M; Table 5) was found, the primary target was assumed to be single.
4.2 Results
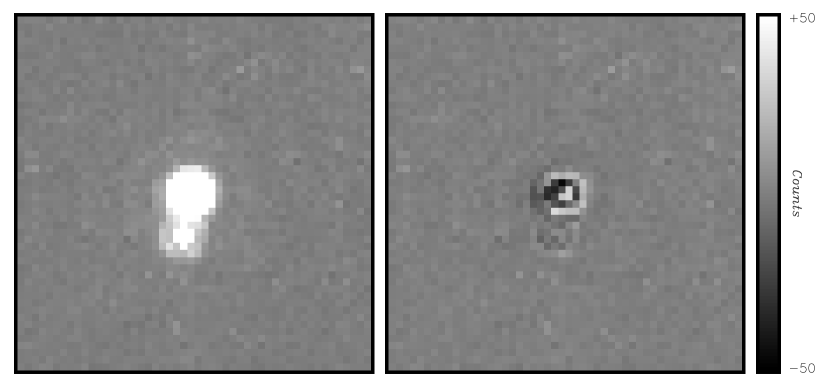
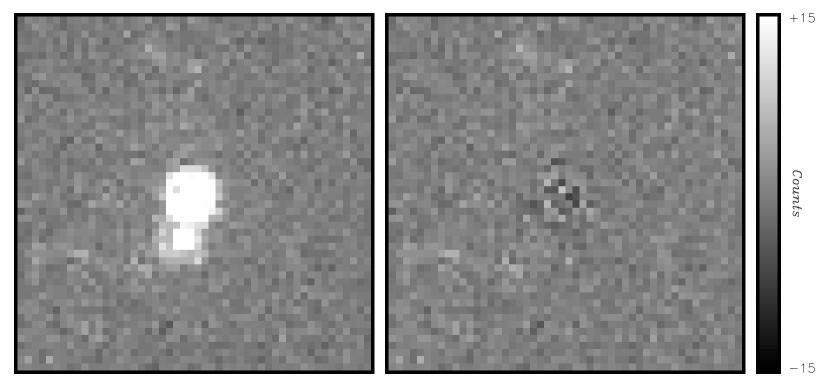
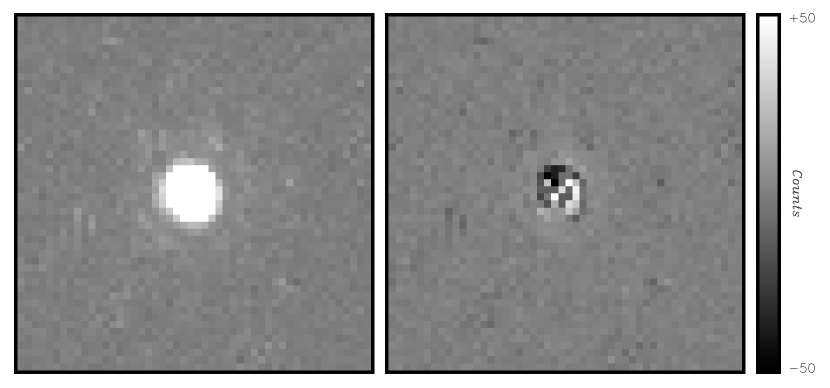
Convergent binary solutions were obtained for both 2MASS 12252739AB and 2MASS 15342952AB in both filters. Figure 5 shows the original and PSF-subtracted images for these pairs. Residuals from the subtraction were less than 4–5% of the peak flux, at the level of 8–10 (F814W) and 2–3 (F1042M) times the background noise. In both cases, smaller residuals were obtained for fits to two sources rather than a single source. This validates the duplicity of 2MASS 15342952AB, whose separation (00650007) is smaller than both the diffraction limit (008 at F814W, 011 at F1042M) and Nyquist sampling limit (20046 = 009) of the instrument. We are able to overcome the former because our technique resolves even significant overlap of two PSFs, particularly when they have nearly equal brightness. The latter constraint is overcome by using a PSF generated from multiple measurements, allowing us to subsample below the Nyquist limit. Table 4 lists the derived binary parameters for these systems; no other sources can be seen in the subtracted images. PSF fitting of the other primary T dwarf targets revealed only one potential faint companion to 2MASS 12170311, detected at F1042M only. This possible detection, which may simply be a residual cosmic ray, is discussed in detail in 5.2. No other companions were identified around any of the other target objects within 11, and no other faint objects with T dwarf-like colors were identified in any of the WPFC2 images.
To obtain proper calibration and determine the uncertainties of our results, we ran the algorithm described above on 20,000 simulated binaries constructed from the F814W and F1042M images of 2MASS 05591404. These test images sampled a range of separations 1–15 pixels (005–069), all orientations, and flux ratios M = 0–7 mag. Once processed through the PSF fitting routine, those test cases having output separations within 0.5 pixels and corrected flux ratios within 0.2 mag of the input values were considered recovered binaries. Corrections and uncertainties to both positions and flux ratios were then determined separately for 2MASS 12252739AB and 2MASS 15342952AB in each filter, using only those recovered test cases having similar input separations ( and , respectively) and flux ratios ( and , respectively). Typical flux ratio corrections were approximately 0.10 mag (i.e., shifting the secondary to brighter magnitudes) with 1 uncertainties of 0.04 and 0.3 mag for 2MASS 12252739AB and 2MASS 15342952AB, respectively; separation 1 uncertainties were 0.12 and 0.15 pixels (0005 and 0007), respectively, translating into position angle uncertainties of 7 and 9. The values listed in Table 4 reflect these corrections and uncertainties.
4.3 Search Limits
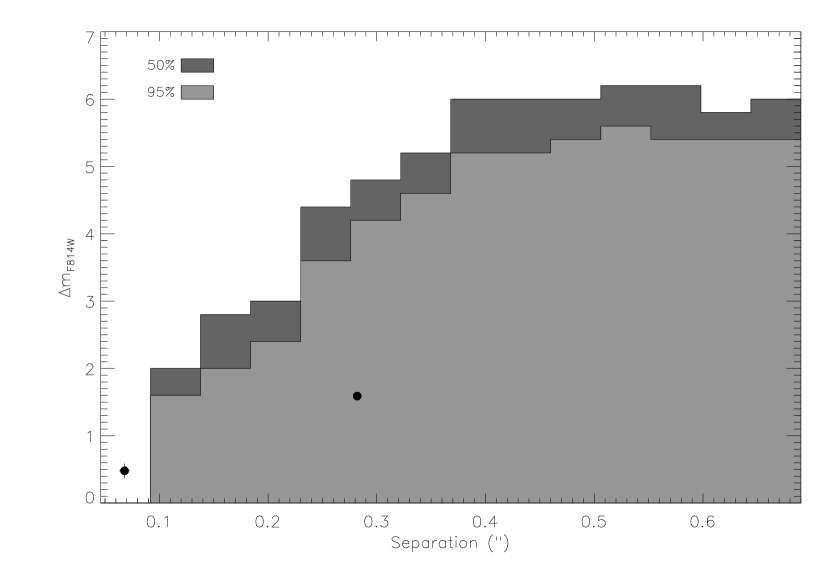
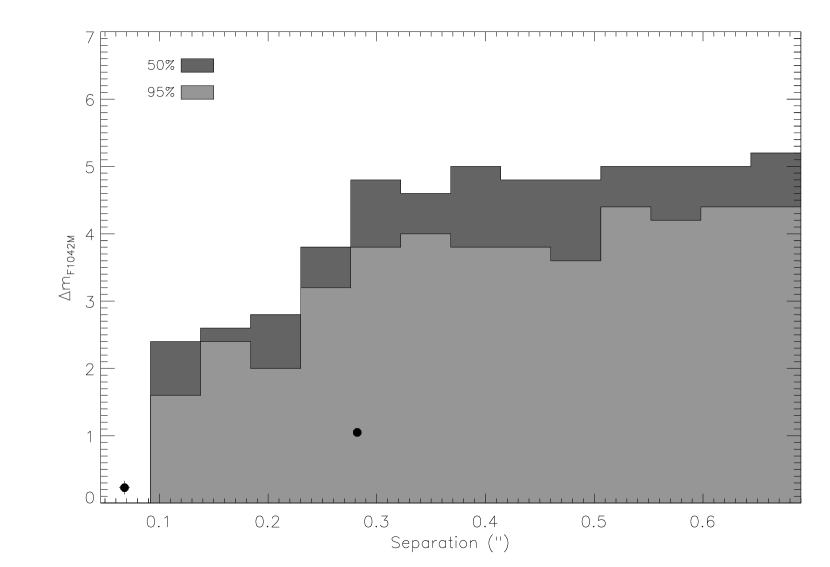
Our calibration simulations allowed us to derive limiting detection magnitudes as a function of separation, as shown in Figure 6. Around 2MASS 05591404, faint secondaries (M 3) were generally missed at separations closer than 015, while M 5.5 (6) and 4.5 (5) could be obtained for wide separations at the 95% (50%) confidence level at F814W and F1042M, respectively. In general, only near-equal-magnitude companions with could be recovered better than 50% of the time, as is the case for 2MASS 15342952AB.
For , S/N = 7 limits (Table 5) yield the maximum sensitivity for faint companions, ranging from M = 4.3–6.9 at F814W to M = 2.9–4.9 at F1042M. We can convert these values to mass ratio ( M2/M1) limits using a mass-luminosity power law from Burrows et al. (2001), L M2.64, and assuming for simplicity coevality and negligible variation in bolometric corrections over the sample444The fact that F814WF1042M varies by 1 mag over this sample implies that this is in general not true, particularly for very cool companions; however, this assumption is suitable for a rough limit., such that
| (3) |
These values are listed in Table 5, and range from 1.0–0.4. Overall, our sample is complete to for AU (assuming a mean distance of 10 pc), with less sensitivity for small mass ratios to separations approaching AU.
5 Individual Targets
5.1 Binaries
2MASS 12252739AB is clearly resolved into two unequal-magnitude components in our HST images. The colors of these objects are significantly different, with the fainter companion having an F814WF1042M color similar to the T8 Gliese 570D (Burgasser et al., 2000b), while the color of the primary is consistent with the spectral type of the combined system, T6. The magnitude ratios of this pair, MF814W = 1.590.04 and MF1042M = 1.050.03, are greater than the absolute magnitude ratios of Gliese 229B (T6.5) and Gliese 570D, MF814W = 1.010.10 and MF1042M = 0.870.12, consistent with 2MASS 12252739A being earlier than type T6.5. Based on these colors, we speculate that this system is comprised of a T6 and T8 pair, which should be confirmed with spatially-resolved spectroscopy. No parallax has been measured for this system yet, but the spectrophotometric distance of the secondary, compared to Gliese 570D, is = = 11.1 pc. At J-band, = 10.8 and = 11.9, based on the absolute J-band magnitudes of the T6 SDSS 1624+0029 (Dahn et al., 2002, MJ = 15.330.07) and Gliese 570D (Burgasser et al., 2000b, MJ = 16.470.05). All of these distance estimates combined yield a mean = 11.20.5 pc and projected physical separation = 3.170.14 AU; note that the uncertainties do not represent probable scatter in the absolute magnitude/spectral type relation, not yet adequately measured for the T dwarfs. Adopting Teff 1000 and 800 K for the two components (Burgasser et al., 2002d), assuming coevality, and using the models of Burrows et al. (1997), we can derive component masses for ages of 0.5, 1.0, and 5.0 Gyr, as listed in Table 6. The derived mass ratio of this system is = 0.7–0.8, depending on its age. Assuming that, on average, the semimajor axis of a binary system (Fischer & Marcy, 1992), we estimate orbital periods of 24–40 yr; hence, significant orbital motion ( 10) could be detectable in this system on a yearly basis.
2MASS 15342952AB is a more marginally resolved system, suggesting that it is much more closely-separated than 2MASS 12252739AB. The flux ratios for this system, MF814W = 0.50.3 and MF1042M = 0.20.3, are much smaller than the spread in absolute magnitudes for mid-type T dwarfs; e.g., MF814W = 2.060.06 and MF1042M = 1.360.08 between the T5 2MASS 05591404 and the T6.5 Gliese 229B. Hence, we assume that this system is comprised of two nearly equal-mass components with spectral types T5.5 and Teff 1100 K. Again, no parallax measurement has been made for this system. Based on the absolute J-band magnitudes of 2MASS 05591404 and SDSS 1624+0029, we estimate a spectrophotometric distance of = 165 pc, the uncertainty dominated by the poor absolute magnitude constraints for mid-type T dwarfs. Combined with the measured separation, this implies = 1.00.3 A.U. Based on mass estimates as derived above (Table 6), we estimate orbital periods of 4–6.5 yr, making this system an excellent target for rapid orbital mapping; however, its very close separation may hamper these measurements, and only significant orbital motion () may be detectable.
5.2 A Potential Binary
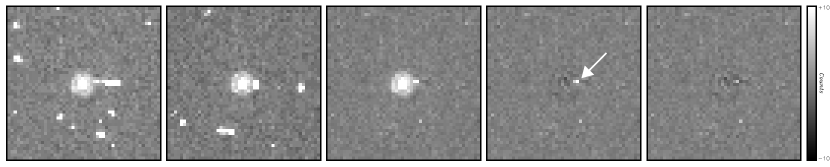
PSF subtraction of the F1042M image of 2MASS 12170311 reveal a faint companion 02090006 from the target source at position angle 747. The corrected flux ratio of the secondary, MF1042M = 2.350.04 makes this source the faintest “detection” in the sample, F1042M = 19.180.08, very close to the detection limits of the image. No counterpart is seen in the F814W image, suggesting a very red source, F814W–F1042M 6.2.
However, it is quite likely that this object is simply a residual cosmic ray. Figure 7 shows the two original PC exposures of the 2MASS 12170311 field, along with the final combined image, a single PSF-subtracted image, and a double PSF-subtracted image. Cosmic rays show up as bright pedestals of flux, in contrast to the more gradually sloping PSF. The potential companion (to the right of the primary target, indicated by an arrow in the fourth panel of Figure 7) is within one pixel of a bright, extended cosmic ray in the first image, and is completely wiped out by a cosmic ray in the second image. It is likely that the source in the first image is a cosmic ray itself. Only 3–4 overlapping (i.e., detected on the same pixels in both exposures) cosmic rays were found within 25 pixels of any of the target images, most of which were quite obviously identifiable. This source is less obvious given its more gradually sloped profile (i.e., not a flat pedestal) and very faint flux. Fitting two PSFs to the cosmic ray-corrected image results in significantly reduced residuals (by roughly 10%), although the fainter source is not completely subtracted out as a result of this fit (fifth panel in Figure 7). Such a fit is inconclusive, however, as subtracting any PSF from a cosmic ray will reduce the overall image residuals, while faint legitimate sources may not subtract cleanly due to the increased relative noise. We therefore classify this source as a candidate companion, requiring additional followup to verify its existence.
If the companion were real, it would be an extremely interesting object, as its color limit and intrinsic faintness would make it the coldest and faintest brown dwarf so far identified. Assuming simplistically that scales with F1042M magnitude, and using the absolute magnitudes and estimated Teffs of Gliese 229B (Marley et al., 1996, 950 K) and Gliese 570D (Burgasser et al., 2000b; Geballe et al., 2001, 800 K), we estimate T/T 0.6 and hence T 500 K. Because H2O begins to condense in atmospheres as cool as this (Burrows & Sharp, 1999), 2MASS 12170311B would probably not be a T dwarf but the prototype for a new spectral class. It would also have an extremely low mass, M 0.012 M☉ for an age of 1 Gyr (Burrows et al., 1997). Hence, confirmation of this possible companion by follow-up imaging is clearly a priority.
5.3 Single Sources
Two other T dwarfs in our sample warrant additional discussion. The first is the bright (J = 13.830.03) T dwarf 2MASS 05591404 (Burgasser et al., 2000c). This object has a measured parallax (Dahn et al., 2002), and is over 1 mag brighter at J-band than the L8 dwarfs 2MASS 1632+1904 (Kirkpatrick et al., 1999) and Gliese 584C (Kirkpatrick et al., 2000), and only 0.6 mag fainter at Ks. Burgasser (2001) has suggested that 2MASS 05591404 may be an equal-magnitude binary based on its brightness and derived Teff, although an alternate hypothesis may be the rapid dissolution of dust cloud material over the L/T transition (Burgasser et al., 2002b). Our images rule out the presence of bright secondary closer than 005. If this hypothetical companion exists, it is either currently aligned with the primary or is separated by less than 0.5 AU. As at least one brown dwarf spectroscopic binary has been found with a separation less than this limit (Basri & Martín, 1999, PPl 15), high-resolution spectroscopy of 2MASS 05591404 may be required to fully rule out the presence of a close companion.
2MASS 1237+6526 is another T dwarf whose duplicity is under consideration. Burgasser et al. (2000a) have suggested that the unique H emission in this object may be due to the presence of a close ( 0.003 AU), interacting companion, although Burgasser et al. (2002a) have failed to find photometric evidence of an eclipsing system. Our HST images do not rule out the presence of this hypothetical companion, as a spatial resolution of 00002 (assuming a distance of 14 pc) would be required to resolve it. The very red F814WF1042M and F814WJ colors of this T6.5 dwarf, similar to the T8 Gliese 570D, could arise from warm circum(sub)stellar material, consistent with this object being a very young and low-mass (3–12 MJup) weak-line T Tauri object (Burgasser et al., 2002a; Liebert et al., 2002). Photometry from Dahn et al. (2002) confirm this object’s very red optical/near-infrared colors, but give no evidence for a reddened JK color (0.260.20). Hence, the nature of this object remains ambiguous.
6 Binary Statistics
6.1 The Binary Fraction
Of the ten T dwarfs imaged in our sample, two have clearly resolved binary companions, implying an observed binary fraction of 20%555Derivation of uncertainties for all sample statistics are described in the Appendix.. This is consistent with results obtained for field late-type M and L dwarfs (Koerner et al., 1999; Reid et al., 2001; Close et al., 2002).
One must keep in mind, however, that the T dwarf sample was originally drawn from a magnitude-limited search, and that the observed binary fraction (for initially unresolved pairs) is therefore biased (Öpik, 1924; Branch, 1976). If we assume negligible contribution by multiple systems of three components or more, then the observed binary fraction, , is related to the “true”, or volume-limited, fraction, , by
| (4) |
where
| (5) |
is the fractional increase in volume sampled for binaries with flux ratio and flux ratio distribution . In the case of all binaries being equal-magnitude systems, = 23/2 = 2.8; while in the case of a flat , = 1.9. From these limiting cases and our observed binary fraction, we derive %, where we have included the uncertainty in and allowed to vary between 1.9 and 2.8. This value is significantly lower than the binary fraction of more massive stars (Duquennoy & Mayor, 1991; Fischer & Marcy, 1992; Reid & Gizis, 1997).
A second means of obtaining a bias-free estimate of the binary fraction in our magnitude-limited sample is by computing the relative luminosity functions with the technique (Schmidt, 1968, 1975). Simply, , where is is the luminosity function calculated from
| (6) |
the sum carried over all N objects in the sample, with . For the T dwarfs, the minimum detectable distance, , is set by the constraint of no optical counterpart in the USNO A2.0 catalog (Monet et al., 1998) or in Digital Sky Survey images, and is roughly 1 pc for all objects in our sample (Burgasser, 2001); the maximum detectable distance, , depends on the sample search limit (J = 16) and the absolute J magnitude of the object. We have estimated for objects in our sample using the known absolute magnitudes of the T5 2MASS 05591404, T6 SDSS 1624+0029, T6.5 Gliese 229B, and T8 Gliese 570D, interpolating by spectral type (Burgasser, 2001). Because binaries can be detected to distances further than single objects, we have included this correction for 2MASS 12252739AB and 2MASS 15342952AB using = 0.29 and 1.0, respectively. The derived binary fraction is only 6%, on the low end of, but not inconsistent with, the bias-corrected value given above, and again much lower than stellar binary fraction measures. An estimate of uncertainty for this technique is not straightforward (Méndez & Ruiz, 2001); nonetheless, the value is consistent with a binary fraction much less than that of more massive stellar systems. The completeness estimator for our sample (Schmidt, 1968), = 0.510.09, gives us some confidence that our result is not significantly influenced by incompleteness or color bias.
The bias correction given in Eqn. 4 is applicable to the L dwarf sample of Reid et al. (2001), which is also based on a magnitude-limited survey of the 2MASS database (Kirkpatrick et al., 1999, 2000). They found = 20% (4 of 20), which translates into a corrected fraction %, where again we have included uncertainty in both and . The 1/ technique gives a consistent value of 12%; again, significantly lower than the binary fraction of more massive stars.
Hence, we find that both L and T dwarf samples, when corrected for selection bias, yield binary fractions which are significantly lower than measurements made for more massive stars, suggesting a continuation of the apparent trend of decreasing from F–G to M dwarf stars. However, it must be stressed that the derived fraction is applicable for separations AU and , while the investigation of, e.g., Duquennoy & Mayor (1991), probed much smaller mass ratios () and separations ( AU). Hence, our sample may contain binaries with secondaries below our detection limits, or very tight unresolved binaries. We can estimate the contribution from the latter population by examining the frequency of M dwarf spectroscopic binaries in the magnitude-limited sample of Reid et al. (2002), who found 6% (2 of 36) of their targets were spectroscopic binaries. Again, using Eqn. 4, this implies a bias-corrected fraction of only 3%, increasing the net binary fraction of the T dwarfs to perhaps 12%, not enough to bring our results in agreement with the binary fraction of F–G or M dwarfs. Similarly, if we compare our derived binary frequency to only those stellar systems having AU, roughly 41% in the Duquennoy & Mayor (1991) F–G dwarf sample (using their Gaussian log(P) distribution) and 31% in the Fischer & Marcy (1992) M dwarf sample (their Table 2), we find that there are clearly fewer T dwarf multiple systems in this separation regime. The contribution of lower-mass companions is also insufficient to explain the deficiency of L and T dwarf binaries, as binary fractions for F–G and M dwarf systems with 0.4 1.0 are roughly 33% (from Table 7 in Duquennoy and Mayor 1991) and 32% (from Fischer & Marcy 1992, assuming a flat mass ratio distribution), respectively, significantly higher than our results. Hence, unless T dwarfs prefer very closely-separated (see below) and/or very low-mass companions, the binary fraction of these objects is significantly lower than that of more massive stars.
6.2 Separation Distribution
The two confirmed binary systems identified in this survey have projected separations 3 AU, and no wide, co-moving companions to any of these objects have yet been identified in either the HST data or the 2MASS survey. In fact, no wider companions ( 2) have been found around any T dwarf identified in the 2MASS or SDSS surveys. This result is consistent with the current absence of widely-separated late-M and L dwarf binaries (Table 7), all of which have 10–20 AU. In contrast, roughly 50% of the more massive early-type M dwarf multiple systems in the Fischer & Marcy (1992) study have 10 AU 104 AU. Similarly, roughly 40% of M dwarf multiple systems in the 8 pc sample have separations greater than 10 AU (Reid & Gizis, 1997). If lower-mass systems had a similar fraction of wide binaries, then roughly 20 pairs with AU from the approximately 300 known L and T dwarfs should have been identified, while there are currently none. The absence of wide systems may contribute to the overall deficiency in multiple systems amongst the T dwarfs, as the binary fractions of F–G dwarfs and M dwarfs drop to roughly 20% for separations AU, within the uncertainty estimates of our bias-corrected result. We discuss the apparent limit in the separations of low-mass stars and brown dwarfs further in 7.1.
6.3 Mass Ratio Distribution
Finally, we consider the mass ratio distribution, , a statistic that can constrain the origin of secondaries in a binary population. In general, masses are difficult to derive for field brown dwarfs, as estimates depend on both temperature and age, and there are few empirical clues currently known for the latter parameter. In Table 7, we have estimated masses for 2MASS 0746+2000AB, DENIS 12281159AB, 2MASS 15342952AB, and 2MASS 12252739AB assuming an age of 1 Gyr, the Teff scale of Burgasser et al. (2002d), and the theoretical models of Burrows et al. (1997); for 2MASS 1146+2230AB, we used maximum masses of 0.06 M☉ based on the presence of the 6708 Å Li I line in the combined light spectrum (Kirkpatrick et al., 1999). All other mass estimates are taken from the listed references. Fortunately, the desired quantity, , is not greatly sensitive to these assumptions.
The two T dwarf binaries identified in our sample have relatively large mass ratios, = 0.8 and 1.0. As discussed in 4.3, we were capable of identifying systems down to , albeit not for very closely separated systems like 2MASS 15342952AB. When we place these two systems in context with the other low-mass binaries listed in Table 7, there appears to be a preference for equal-mass systems, the lowest mass ratio system being 0.7. This is similar to what has been reported in the 8 pc sample (Reid & Gizis, 1997), and is at odds with the flatter distributions of Duquennoy & Mayor (1991) and Fischer & Marcy (1992).
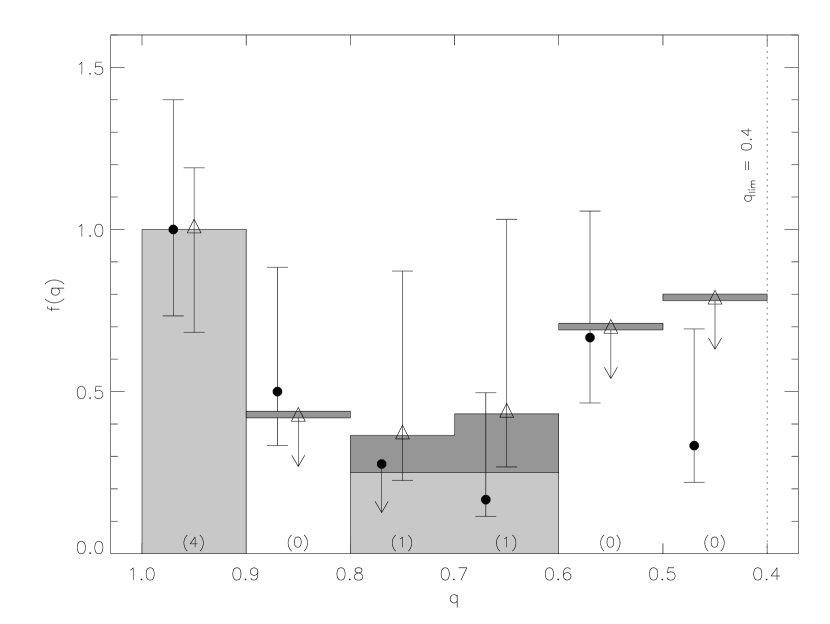
The two binaries identified in our program form too small a sample to examine the mass ratio distribution statistically, so we combined our ten T dwarfs with the L dwarf sample of Reid et al. (2001). Based on their completeness limits, and using the same mass/flux ratio scaling as described in 4.3, we find that their sample is complete to for , or AU assuming a mean distance of 20 pc. This is comparable to our completeness for AU, although the inner separation limit for our sample is roughly one-half that of the L dwarf study. Nonetheless, because similar instruments and observing strategies were employed, combining these two samples should not introduce significant biases. The observed binary fraction for this combined sample is 20%, while the bias-corrected fraction is %. Breaking these systems down by mass ratio, we find 4 systems with , 1 system with , 1 system with , and less than 1.4 systems for all other ratio bins. We plot this distribution (light grey histogram) in Figure 8, normalized so that .
Again, there appears to be a preference for equal mass binaries. This is not unexpected, however, given the intrinsic faintness of very low-mass brown dwarfs, and the preferential selection of equal-mass systems in magnitude-limited surveys. We must, therefore, consider selection biases in these magnitude-limited samples. The correction to the flux ratio distribution is
| (7) |
which, using the mass/flux ratio scaling as before, yields
| (8) |
Hence, the bias is a fairly strong function of . Applying these corrections, we derive a slightly revised mass ratio distribution (dark grey histogram in Figure 8). Even with the bias corrections, there are more objects in the bin than in other mass ratio bins, although not a statistically significant number. With the substantial statistical uncertainties of our small sample, in particular the large upper limits for , we cannot statistically rule out a flatter distribution.
We have also plotted the M dwarf for the 8 pc sample (Reid & Gizis, 1997) in Figure 8, which we have normalized as above and computed uncertainties based on a total of 21 M dwarf multiple systems. This distribution appears to be similar to the L and T dwarf distribution, with a possible preference for high-mass ratio systems, although the uncertainties are again significant; a flatter distribution cannot be statistically ruled out. Hence, concluding a preference of equal-mass components amongst the M, L, and T dwarf binaries requires considerably better statistics, but our results are suggestive of this trend.
7 Brown Dwarf Binary Formation and Disruption
The results above indicate that both the binary fraction and separation distribution of brown dwarfs are significantly different that those of more massive stars, while the mass ratio distribution suggests a preference for equal-mass systems. We now examine how these properties may constrain the formation or evolution of substellar binary systems.
7.1 Disruption by Stellar and GMC Encounters
The deficiency of brown dwarf binaries with AU is reminiscent of the deficiency of stellar binaries with 0.1 pc 2105 AU (Bahcall & Soniera, 1981; Close, Richer, & Crabtree, 1990; Wasserman & Weinberg, 1991). While there remains some debate as to whether a sharp break exists in the separation distribution (Retterer & King, 1982; Wasserman & Weinberg, 1987, 1991; Close, Richer, & Crabtree, 1990), it is generally believed that impulsive perturbations by close stellar encounters or passage through a GMC causes a gradual diffusion of separations and binding energies, ultimately resulting in the dissolution of weakly bound systems in a catastrophic encounter (Weinberg, Shapiro, & Wasserman, 1987). Because the binding energies of brown dwarf pairs are small and such systems therefore easily disrupted, it is tempting to ascribe the same mechanism to the apparent absence of widely-separated systems.
To examine the probability of disruption by stellar and GMC encounters, we used the formalism of Weinberg, Shapiro, & Wasserman (1987), adopting the general parameters used by the authors666Vrel = 20 km s-1, = 0.1, = 0.05 pc-3, = 410-8 pc-3, RGMC = 20 pc, MGMC = 5105 M☉, and Nclump = 25; see Weinberg, Shapiro, & Wasserman (1987) for nomenclature. and examine the evolution of two 0.05 M☉ gravitationally bound brown dwarfs with separation 10 AU. The critical impact parameter for significant gravitational disruptive effects is AU. For stellar encounters, the Fokker-Planck impact parameter in the tidal limit777In the case we are considering, , so that, unlike wide stellar pairs, the tidal limit applies., AU , implies that both close, catastrophic collisions and gradual tidal disruption can affect the evolution of brown dwarf pairs. However, the frequency of close stellar encounters is Gyr)-1, while the diffusive timescale is Gyr. Hence, stellar encounters are not frequent enough to affect brown dwarf binaries with AU over the age of the Galaxy. The tidal limit impact parameter for GMC interactions is AU , while the impact parameter for catastrophic interactions with GMC clumps in the case of cloud penetration (occurring at a rate of roughly 1 Gyr-1) is AU ; hence, GMC interactions play no role in the disruption of brown dwarf binary systems. Therefore, the separation limit of brown dwarf pairs is not due to disruption in the Galactic field, as appears to be the case for wide stellar binaries. Indeed, only brown dwarf systems with separations many orders of magnitude larger than those observed could be disrupted in the field.
To further elucidate how stellar and GMC disruptions do not constrain the separation of brown dwarf pairs, Figure 9 plots the separation of binary stars and brown dwarfs versus total mass. Binary data for brown dwarf and late-type stars (primaries later than M8) are listed in Table 7; for stellar binaries, we include the samples of Close, Richer, & Crabtree (1990), Duquennoy & Mayor (1991), Fischer & Marcy (1992), Reid & Gizis (1997, HST M dwarf binaries and the 8 pc sample), and Tokovinin (1997, Multiple Star Catalog); finally, for stellar-brown dwarf binaries we use compiled values from Reid et al. (2001). The absence of wide low-mass pairs is quite striking in this figure, particularly given the ability of 2MASS and other field surveys to resolve such systems. The curved line shows a log-normal relation for the maximum separation of binary systems, , which is appropriate for disruption by point-source encounters (Reid et al., 2001). Note that such an envelope matches the observed cut-off for stellar binaries quite well, but allows more-widely separated brown dwarf binaries to form ( AU). For the lower-mass systems, we find a second line,
| (9) |
appears to be more adequate for the separation limit. While the number of objects for which this envelope applies is relatively small, it is not biased by selection effects, as all systems would be unresolved in their original surveys, and would be easily resolved by HST, for . We suggest that this power-law relation may be a clue to the mechanism that modulates the formation or disruption of substellar binaries, although further data are required to confirm if this relation is truly representative of all brown dwarf binary systems.
What about disruption within the nascent star-forming cluster? A survey of the 120 Myr Pleiades cluster by Martín et al. (2000) found no binaries out of a sample of 34 low-mass star or brown dwarf members for AU, although candidate photometric binaries (including PPL 15) suggest a binary fraction of % (Reid et al., 2001), consistent with the binary fraction observed in the field. Duchêne, Bouvier, & Simon (1999) found no substellar binaries or companions in the 0.5–10 Myr IC 348 cluster for 30 AU, although one very wide ( 2300 AU) candidate system in this cluster has been suggested by Najita, Tiede, & Carr (2000). Finally, a search for binary objects in 1–5 Myr Cha H 1 cloud by Neuhäuser et al. (2002) and Neuhäuser, Guenther, & Brandner (2003) has turned up only one potential binary candidate with 28 AU. Therefore, it appears that for disruption to play an important role in the elimination of brown dwarf binaries with AU, it must occur within a few million years of formation. Note that the theory of Weinberg, Shapiro, & Wasserman (1987) predicts that stellar encounters may have some influence in young dense clusters, as Gyr-1, and Myr for pc-3, typical for regions such as the Orion Nebular Cloud (Hillenbrand, 1997). However, as these dense regions rapidly disperse (i.e., within a few Myr), close encounters are probably not solely responsible for the absence of widely-separated substellar binaries.
7.2 Small N Protoclusters and Brown Dwarf Ejection Models
A currently popular model of star formation in clusters is through the fragmentation of molecular clouds into small aggregates of non-hierarchical protostellar cores (Larson, 1972), with the entire young star forming region being comprised of these initial groupings. On a short timescale (ages yr), these “protoclusters” are disrupted by dynamical interactions between the cores, which is likely modulated by residual gas and dust that continues to be accreted (Bonnell et al., 1997, 2001). Such dynamical interactions preferentially eject the lowest-mass components, while an ejected core is also less likely to continue significant accretion. These considerations have given rise to so-called “ejection” formation models for brown dwarfs (Reipurth & Clarke, 2001; Bate, Bonnell, & Bromm, 2002), in which the dynamic removal of cores from accretion regions condemns them to remain below the Hydrogen burning minimum mass. A numerical simulation by Bate, Bonnell, & Bromm (2002) utilizing this general model have found a low brown dwarf binary fraction, at most 5%, based on a single remaining undisturbed pair in a dynamically unstable multiple system. This fraction is consistent with the derived fraction of L and T dwarf binaries, although the simulation also predicts similarly low binary fractions for low-mass stars, which is not observed. Nonetheless, since the ejection model predicts the disruption of potential brown dwarf binaries at very early ages, while also imposing a limit to the dimensions of such systems (Reipurth & Clarke, 2001), it shows some promise in explaining the origins of substellar systems in general.
7.3 Fragmentation
The preference for brown dwarfs to form close binaries may not necessarily require a disruptive process, however. Studies of young binary stars favor fragmentation (Boss, 1988) as the dominant mode of binary formation, due to coevality of components, the presence of circumbinary structures, and the preference for equal-mass components in closely-separated systems (White & Ghez, 2001). These conditions do not require dynamical disruption from neighboring protostellar systems. In general, a low-mass gas and dust core must collapse to smaller dimensions before it achieves sufficient densities to continue fragmentation, producing multiple systems which are initially closely separated. This suggests a maximum separation dependence on mass, as hinted at in Figure 8, although no theoretical prediction as such has been made. The deficiency of low-mass pairs may arise from the inability for very small cloud clumps to both form and also continue fragmenting, although the influence of magnetic fields, turbulence, and external perturbations would also have substantial influence. Current models (e.g., Boss 2001) are capable of producing core fragments in the range of 10s of Jupiter masses (MJup), in the mass range of field L and T brown dwarfs, but masses down to 1 MJup require dynamical ejection to prevent further accretion.
7.4 How Do Brown Dwarfs Form?
The similarity in the binary fractions and separation distributions for young cluster and field low-mass systems, and the low probability of dynamic disruption in all but the densest stellar environments, makes it highly probable that the field brown dwarf binary distribution is quite similar to the natal distribution. This is important, as the distances and dust opacity of protostellar environments, and the relative faintness of protosubstellar objects, makes investigation of brown dwarf formation at very early ages quite difficult. Improving the statistics for field brown dwarf systems, and examining closer separation regimes through radial velocity techniques, should provide considerable insight into the formation of these very low-mass objects. We find that both fragmentation and ejection models produce some of the qualitative characteristics of late-M, L, and T dwarf binaries, and it is possible that substellar systems form by some combination of these processes. However, more detailed quantitative predictions must be matched with large, unbiased sample statistics before conclusive statements can be made on the formation of brown dwarfs.
Appendix A Probability Distribution for the Binary Fraction
When binary fractions (or other equivalent frequency statistics) are quoted in the literature, they are frequently assigned Poisson uncertainties. However, the Poisson limit applies only in the case of a large sample, whereas the brown dwarf samples discussed here are less than 30 in number. Hence, we derived statistical uncertainties by constructing a probability distribution for given the total sample size, , and the number of binaries in the sample, . The binomial distribution determines the probability of finding binaries given the sample size and binary fraction, as:
| (A1) |
However, this equation may also be used to derive the probability distribution of given the observed quantities N and n. To do this, we compute for , normalizing
| (A2) |
which yields .
Figure 9 plots for our T dwarf sample, and . To derive upper and lower uncertainty limits, and , we computed the values for which = = 0.84, equivalent to 1 limits for a Gaussian distribution. These limits can also be found numerically by solving
| (A3) |
As shown in Figure 9, the derived limits are not symmetric about the probability peak, prohibiting ranges which exceed the sample size or are less than zero. For large samples ( 100) one recovers the standard Poisson uncertainty limits, (.
References
- Abt (1987) Abt, H. A. 1987, ApJ, 317, 353
- Abt & Levy (1976) Abt, H. A., & Levy, S. G. 1976, ApJS, 30, 273
- Baggett et al. (1997) Baggett, S., Casterno, S., Gonzaga, S., & Ritchie, C. 1997, STSCI ISR WPFC2 97-10 (Baltimore: STScI)
- Bahcall & Soniera (1981) Bahcall, J. N., & Soniera, R. M. 1981, ApJ, 264, 122
- Basri & Martín (1999) Basri, G., & Martín, E. L. 1999, AJ, 118, 2460
- Bate, Bonnell, & Bromm (2002) Bate, M. R., Bonnell, I. A., & Bromm, V. 2002 MNRAS, 332, L65
- Biretta et al. (2002) Biretta, J., et al. 2002, WFPC Instrument Handbook, Version 7.0 (Baltimore: STScI)
- Bonnell et al. (1997) Bonnell, I. A., Bate, M. R., Clarke, C. J., & Pringle, J. E. 1997, MNRAS, 285, 201
- Bonnell et al. (2001) Bonnell, I. A., Bate, M. R., Clarke, C. J., & Pringle, J. E. 2001, MNRAS, 323, 785
- Boss (1988) Boss, A. P. 1988, Comments Astrophys., 12, 169
- Boss (2001) Boss, A. P. 2001, ApJ, 551, L167
- Branch (1976) Branch, D. 1976, ApJ, 210, 392
- Burgasser (2001) Burgasser, A. J. 2001, Ph.D. Dissertation, California Institute of Technology
- Burgasser et al. (2000a) Burgasser, A. J., Kirkpatrick, J. D., Reid, I. N., Liebert, J., Gizis, J. E., & Brown, M. E. 2000a, AJ, 120, 473
- Burgasser et al. (2002a) Burgasser, A. J., Liebert, J., Kirkpatrick, J. D., & Gizis, J. E. 2002a, AJ, 123, 2744
- Burgasser et al. (2002b) Burgasser, A. J., Marley, M. S., Ackerman, A. S., Saumon, D., Lodders, K., Dahn, C. C., Harris, H. C., & Kirkpatrick, J. D. 2002b, ApJ, 571, L151
- Burgasser et al. (2003) Burgasser, A. J., McElwain, M. W., Kirkpatrick, J. D., Burgasser, A. J., Cutri, R. M., & Skrutskie, M. F. 2003, AJ, in press
- Burgasser et al. (1999) Burgasser, A. J., et al. 1999, ApJ, 522, L65
- Burgasser et al. (2000b) —. 2000b, ApJ, 531, L57
- Burgasser et al. (2000c) —. 2000c, AJ, 120, 1100
- Burgasser et al. (2002d) —. 2002d, AJ, 564, 421
- Burrows et al. (1997) Burrows, A., et al. 1997, ApJ, 491, 856
- Burrows et al. (2001) Burrows, A., Hubbard, W. B., Lunine, J. I., & Liebert, J. 2001, Rev. of Modern Physics, 73, 719
- Burrows, Marley, & Sharp (2000) Burrows, A., Marley, M. S., & Sharp, C. M. 2000, ApJ, 531, 438
- Burrows & Sharp (1999) Burrows, A., & Sharp, C. M. 1999, ApJ, 512, 843
- Carpenter (2001) Carpenter, J. M. 2001, AJ, 121, 2851
- Casali & Hawarden (1992) Casali, M. M., & Hawarden, T. G. 1992, UKIRT Newsletter, 4, 33
- Close, Richer, & Crabtree (1990) Close, L. M., Richer, H. B., & Crabtree, D. R. 1990, AJ, 100, 1968
- Close et al. (2002) Close, L. M., Siegler, N., Potter, D., Brandner, W., & Liebert, J. 2002, ApJ, 567, L53
- Cuby et al. (1999) Cuby, J. G., Saracco, P., Moorwood, A. F. M., D’Odorico, S., Lidman, C., Comerón, F., & Spyromilio, J. 1999, A&A, 349, L41
- Dahn et al. (2002) Dahn, C. C., et al. 2002, AJ, 124, 1170
- Duchêne, Bouvier, & Simon (1999) Duchêne, G., Bouvier, J., & Simon, T. 1999, A&A, 343, 831
- Duquennoy & Mayor (1991) Duquennoy, A., & Mayor, M. 1991, A&A, 248, 485
- Els et al. (2001) Els, S. G., Sterzik, M. F., Marchis, F., Pantin, E., Endl, M., & Kurster, M. 2001, A&A, 370, L1
- Fischer & Marcy (1992) Fischer, D. A., & Marcy, G. W. 1991, ApJ, 396, 178
- Freed, Close, & Siegler (2002) Freed, M., Close, L. M., & Siegler, N. 2002, ApJ, in press
- Geballe et al. (2001) Geballe, T. R., Saumon, D., Leggett, S. K., Knapp, G. R., Marley, M. S., & Lodders, K. 2001, ApJ, 556, 373
- Geballe et al. (2002) Geballe, T. R., et al. 2002, ApJ, 564, 466
- Golimowski et al. (1998) Golimowski, D. A., Burrows, C. J., Kulkarni, S. R., Oppenheimer, B. R. & Brukardt, R. A. 1998, AJ, 115, 2579
- Goto et al. (2002) Goto, M., et al. 2002, 567, L59
- Henry & McCarthy (1990) Henry, T. J., & McCarthy, D. W. Jr. 1990, ApJ, 350
- Hillenbrand (1997) Hillenbrand, L. A. 1997, AJ, 113, 1733
- Kirkpatrick et al. (2000) Kirkpatrick, J. D., Reid, I. N., Liebert, J., Gizis, J. E., Burgasser, A. J., Monet, D. G., Dahn, C. C., Nelson, B., & Williams, R. J. 2000, AJ, 120, 447
- Kirkpatrick et al. (1999) Kirkpatrick, J. D., et al. 1999, ApJ, 519, 802
- Koerner et al. (1999) Koerner, D. W., Kirkpatrick, J. D., McElwain, M. W., & Bonaventura, N. R. 1999, ApJ, 526, L25
- Lane et al. (2001) Lane, B. F., Zapatero Osorio, M. R., Britton, M. C., Martín, E. L., & Kulkarni, S. R. 2001, ApJ, 560, 390
- Larson (1972) Larson, R. B. 1972, MNRAS, 156, 437
- Leggett et al. (2001) Leggett, S. K., Allard, F., Geballe, T., Hauschildt, P. H., & Schweitzer, A. 2001, ApJ, 548, 908
- Leggett et al. (1999) Leggett, S. K., Toomey, D. W., Geballe, T. R., & Brown, R. H. 1999, ApJ, 517, L139
- Leggett et al. (2000) Leggett, S. K., et al. 2000, ApJ, 536, L35
- Liebert et al. (2002) Liebert, J., Kirkpatrick, J. D., Cruz, K. L, Reid, I. N., Burgasser, A. J., Tinney, C. G., & Gizis, J. E. 2002, AJ, in press
- Liebert et al. (2000) Liebert, J., Reid, I. N., Burrows, A., Burgasser, A. J., Kirkpatrick, J. D., & Gizis, J. E. 2000, ApJ, 533, L155
- Liu et al. (2002) Liu, M. C., Wainscoat, R., Martín, E. L., Barris, B., & Tonry, J. 2002, ApJ, 568, L107
- Marley et al. (1996) Marley, M. S., Saumon, D., Guillot, T., Freedman, R. S., Hubbard, W. B., Burrows, A., & Lunine, J. I. 1996, Science, 272, 1919
- Martín, Brandner & Basri (1999) Martín, E. L., Brandner, W., & Basri, G. 1999, Science, 283, 1718
- Martín et al. (2000) Martín, E. L., Brandner, W., Bouvier, J., Luhman, K. L., Stauffer, J., Basri, G., Zapatero Osorio, M. R., & Barrado y Navascués, D. 2000, ApJ, 543, 299
- Martín et al. (1999) Martín, E. L., Delfosse, X., Basri, G., Goldman, B., Forveille, T., & Zapatero Osorio, M. R. 1999, AJ, 118, 2466
- Méndez & Ruiz (2001) Méndez, R. A., & Ruiz, M. T. 2001, ApJ, 547, 252
- Monet et al. (1998) Monet, D. G., et al. 1998, USNO-A2.0 Catalog (Flagstaff: USNO)
- Najita, Tiede, & Carr (2000) Najita, J. R., Tiede, G. P., & Carr, J. S. 2000, ApJ, 541, 977
- Nakajima et al. (1995) Nakajima, T., Oppenheimer, B. R., Kulkarni, S. R., Golimowski, D. A., Matthews, K., & Durrance, S. T. 1995, Nature, 378, 463
- Neuhäuser et al. (2002) Neuhäuser, R., Brandner, W., Alves, J., Joergens, V., & Comerón, F. 2002, A&A, 384, 999
- Neuhäuser, Guenther, & Brandner (2003) Neuhäuser, R., Guenther, E., & Brandner, W. 2003, in Brown Dwarfs, Proceedings of IAU Symposium 211, ed. E. L. Martín (San Francisco; ASP), in preparation
- Öpik (1924) Öpik, E. 1924, Publ. Obs. Astron. Univ. Tartu, 25, 6
- Oppenheimer et al. (1995) Oppenheimer, B. R., Kulkarni, S. R., Matthews, K., & Nakajima, T. 1995, Science, 270, 1478
- Potter et al. (2002) Potter, D., Martín, E. L., Cushing, M. C., Baudoz, P., Brandner, W., Guyon, O., & Neuhäuser, R. 2002, ApJ, 567, L133
- Reid & Gizis (1997) Reid, I. N., & Gizis, J. E. 1997, AJ, 113, 2246
- Reid et al. (2001) Reid, I. N., Gizis, J. E., Kirkpatrick, J. D., & Koerner, D. 2001, AJ, 121, 489
- Reid et al. (2002) Reid, I. N., Kirkpatrick, J. D., Liebert, J., Gizis, J. E., Dahn, C. C., & Monet, D. G. 2002, AJ, 124, 1170
- Reipurth & Clarke (2001) Reipurth, B., & Clarke, C. 2001, AJ, 122, 432
- Retterer & King (1982) Retterer, J. M., & King, I. R. 1982, ApJ, 254, 214
- Schmidt (1968) Schmidt, M. 1968, ApJ, 151, 393
- Schmidt (1975) Schmidt, M. 1975, ApJ, 202, 22
- Skrutskie et al. (1997) Skrutskie, M. F., et al. 1997, in The Impact of Large-Scale Near-IR Sky Surveys, ed. F. Garzon (Dordrecht: Kluwer), p. 25
- Strauss et al. (1999) Strauss, M. A., et al. 1999, ApJ, 522, L61
- Tokovinin (1997) Tokovinin, A. A. 1997, A&AS, 124, 75
- Tsuji, Ohnaka, & Aoki (1999) Tsuji, T., Ohnaka, K., & Aoki, W. 1999, ApJ, 520, L119
- Tsvetanov et al. (2000) Tsvetanov, Z. I., et al. 2000, ApJ, 531, L61
- Wasserman & Weinberg (1987) Wasserman, I., & Weinberg, M. D. 1987, ApJ, 312, 390
- Wasserman & Weinberg (1991) Wasserman, I., & Weinberg, M. D. 1991, ApJ, 382, 149
- Weinberg, Shapiro, & Wasserman (1987) Weinberg, M. D., Shapiro, S. L, & Wasserman, I. 1987, ApJ, 312, 367
- White & Ghez (2001) White, R. J., & Ghez, A. M. 2001, ApJ, 556, 265
- Whitmore, Heyer, & Casertano (1999) Whitmore, B., Heyer, I., & Casertano, S. 1999, PASP, 111, 1559
- York et al. (2000) York, D. G., et al. 2000, AJ, 120, 1579
- Zapatero Osorio et al. (2002) Zapatero Osorio, M. R., et al. 2002, ApJ, 578, 536
| F814W | F1042M | ||||||
|---|---|---|---|---|---|---|---|
| ObjectaaSource designations for the 2MASS Point Source Catalog are given as “2MASS Jhhmmss[.]ssddmmss[.]s”. The suffix conforms to IAU nomenclature convention and is the sexigesimal R.A. and decl. at J2000 equinox. | SpT | UT Date/TimebbUT date/time given as yyyymmdd hh:mm. | (sec) | UT Date/TimebbUT date/time given as yyyymmdd hh:mm. | (sec) | RA ()ccTelescope Roll Angle East from North. | |
| (1) | (2) | (3) | (4) | (5) | (6) | (7) | |
| 2MASS 055919141404488 | T5 | 20000906 18:41 | 2400 | 20000906 20:15 | 2600 | 305 | |
| 2MASS 09373487+2931409 | T6pec | 20001016 23:44 | 2600 | 20001017 00:08 | 2600 | 339 | |
| 2MASS 10475385+2124234 | T6.5 | 20010104 16:16 | 2400 | 20010104 17:50 | 2600 | 310 | |
| 2MASS 121711100311131 | T7.5 | 20000704 03:10 | 2400 | 20000704 04:43 | 2600 | 158 | |
| 2MASS 122554322739466 | T6 | 20010410 15:53 | 2600 | 20010410 17:29 | 2600 | 79 | |
| 2MASS 12373919+6526148 | T6.5 | 20000613 15:32 | 2000 | 20000613 16:49 | 2400 | 160 | |
| Gliese 570D | T8 | 20000818 07:23 | 2400 | 20000818 08:54 | 2600 | 152 | |
| 2MASS 153449842952274 | T5.5 | 20000818 04:10 | 2600 | 20000818 05:42 | 2600 | 148 | |
| 2MASS 154627183325111 | T5.5 | 20000819 05:55 | 2600 | 20000818 07:26 | 2600 | 147 | |
| 2MASS 235654771553111 | T6 | 20001129 09:48 | 2400 | 20001129 11:23 | 2600 | 66 | |
| Filter | ApertureaaAperture in pixels, corresponding to angular apertures of 009 (020), 014 (030), and 023 (050) for 2, 3, and 5 pixels on the PC (WF) chips. | PC | WF1 | WF2 | WF3 |
|---|---|---|---|---|---|
| (1) | (2) | (3) | (4) | (5) | (6) |
| N∗ | 24 | 66 | 79 | 78 | |
| 2 | 1.620.07 | 1.210.03 | 1.210.02 | 1.210.02 | |
| F814W | 3 | 1.210.04 | 1.090.02 | 1.080.01 | 1.080.01 |
| 5 | 1.040.02 | 1.020.02 | 1.010.01 | 1.010.01 | |
| N∗ | 7 | 21 | 17 | 19 | |
| 2 | 1.650.08 | 1.280.06 | 1.310.05 | 1.280.05 | |
| F1042M | 3 | 1.330.09 | 1.110.04 | 1.130.03 | 1.120.03 |
| 5 | 1.010.06 | 1.030.03 | 1.030.02 | 1.030.02 |
| Object | SpT | F814W | F1042M | 2MASS J | F814WF1042M | F1042MJ | F814WJ |
|---|---|---|---|---|---|---|---|
| (1) | (2) | (3) | (4) | (5) | (6) | (7) | (8) |
| 2MASS 05591404 | T5 | 18.650.03 | 15.020.07 | 13.830.03 | 3.640.08 | 1.190.08 | 4.820.04 |
| 2MASS 15342952ABaaWPFC2 magnitudes computed for a 5-pixel aperture. | T5.5 | 19.620.02 | 15.750.07 | 14.900.04 | 3.860.08 | 0.850.08 | 4.720.04 |
| 2MASS 15463325 | T5.5 | 20.520.03 | 16.660.07 | 15.600.05 | 3.860.08 | 1.060.09 | 4.920.06 |
| 2MASS 12252739AbbJ magnitude estimated from combined 2MASS J = 15.220.05 and J = 1.350.08 (see 3.2). | T6 | 20.320.03 | 16.380.07 | 15.500.05 | 3.940.08 | 0.880.09 | 4.830.06 |
| 2MASS 23561553 | T6 | 20.730.03 | 16.960.08 | 15.800.06 | 3.770.08 | 1.160.10 | 4.930.07 |
| 2MASS 0937+2931 | T6pec | 19.730.03 | 15.470.07 | 14.650.04 | 4.260.08 | 0.820.08 | 5.080.05 |
| Gliese 229BccWPFC2 magnitudes from Golimowski et al. (1998); UKIRT J from Leggett et al. (1999). | T6.5 | 19.490.03 | 15.160.03 | 14.320.05 | 4.330.04 | 1.150.06 | 5.170.06 |
| 2MASS 1047+2124 | T6.5 | 20.890.03 | 16.670.07 | 15.820.06 | 4.220.08 | 0.850.10 | 5.070.07 |
| 2MASS 1237+6526 | T6.5 | 21.250.03 | 16.760.07 | 16.030.09 | 4.490.08 | 0.730.12 | 5.220.10 |
| 2MASS 12170311 | T7.5 | 21.110.03 | 16.830.07 | 15.850.07 | 4.290.08 | 0.980.10 | 5.270.08 |
| Gliese 570D | T8 | 20.550.03 | 16.080.07 | 15.330.05 | 4.490.08 | 0.730.09 | 5.220.06 |
| 2MASS 12252739Bb,db,dfootnotemark: | T8:eeSpectral type estimated from F814WF1042M color; see 5.1.1. | 21.910.05 | 17.450.06 | 16.850.08 | 4.460.07 | 0.610.10 | 5.070.09 |
| 2MASS 12252739AB | 2MASS 15342952AB | 2MASS 12170311AB?aaPotential faint companion requiring confirmation; see 5.1.2. | |
|---|---|---|---|
| (1) | (2) | (3) | |
| SpT | T6/T8 | T5.5/T5.5 | T7.5/Y? |
| d (pc)bbSpectrophotometric distance estimated from spectral types and T dwarf with known distances; see 5.1.1. | 11.20.5 | 165 | 104 |
| () | 02820005 | 00650007 | 02090006 |
| (AU) | 3.170.14 | 1.00.3 | 2.10.8 |
| () | 2507 | 19 | 747 |
| F814W | 1.590.04 | 0.50.3 | 4.4 |
| F1042M | 1.050.03 | 0.20.3 | 2.350.04 |
| F814W | F1042M | ||||||
|---|---|---|---|---|---|---|---|
| Object | mlimaaS/N = 7 detection limit. | Mlim | bbMass ratio limit derived from Eqn. 3. | mlimaaS/N = 7 detection limit. | Mlim | bbMass ratio limit derived from Eqn. 3. | |
| (1) | (2) | (3) | (4) | (5) | (6) | (7) | |
| 2MASS 05591404 | 25.6 | 6.9 | 0.09 | 19.9 | 4.9 | 0.18 | |
| 2MASS 0937+2931 | 25.4 | 5.8 | 0.13 | 19.9 | 4.4 | 0.22 | |
| 2MASS 1047+2124 | 25.5 | 4.6 | 0.20 | 19.9 | 3.2 | 0.33 | |
| 2MASS 12170311 | 25.6 | 4.4 | 0.22 | 19.9 | 3.1 | 0.34 | |
| 2MASS 12252739 | 25.5 | 5.2 | 0.16 | 20.0 | 3.5 | 0.29 | |
| 2MASS 1237+6526 | 25.3 | 4.1 | 0.24 | 19.7 | 3.1 | 0.34 | |
| Gliese 570D | 25.4 | 5.0 | 0.17 | 20.0 | 3.8 | 0.27 | |
| 2MASS 15342952 | 25.2 | 5.9 | 0.13 | 19.6 | 4.2 | 0.23 | |
| 2MASS 15463325 | 25.4 | 5.0 | 0.17 | 19.9 | 3.2 | 0.33 | |
| 2MASS 23561553 | 25.4 | 4.8 | 0.19 | 20.0 | 2.9 | 0.36 | |
| 2MASS 12252739AB | 2MASS 15342952AB | ||||||
|---|---|---|---|---|---|---|---|
| Age (Gyr) | M (M☉) | (AU)aaSemimajor axis assuming = 1.26 (Fischer & Marcy, 1992). | (yr) | M (M☉) | (AU)aaSemimajor axis assuming = 1.26 (Fischer & Marcy, 1992). | (yr) | |
| (1) | (2) | (3) | (4) | (5) | (6) | (7) | |
| 0.5 | 0.017/0.023 | 4.0 | 40 | 0.027/0.027 | 1.3 | 6.4 | |
| 1.0 | 0.024/0.033 | 4.0 | 34 | 0.035/0.035 | 1.3 | 5.6 | |
| 5.0 | 0.04/0.06 | 4.0 | 24 | 0.065/0.065 | 1.3 | 4.1 | |
| Object | SpT | M (M☉) | () | (AU)aaProjected separation, except for Gliese 569BC whose orbit has been mapped (Lane et al., 2001). | M | Filter | Ref. | |
|---|---|---|---|---|---|---|---|---|
| (1) | (2) | (3) | (4) | (5) | (6) | (7) | (8) | (9) |
| 2MASS 22062047AB | M8/M8.5 | 0.090/0.088 | 1.0 | 017 | 4.1 | 0.11 | JHK′K | 1 |
| Gliese 569BC | M8.5/M9 | 0.069/0.059 | 0.9 | 008 | 0.900.02 | 0.45 | JK | 2 |
| 2MASS 23310406AB | M8/L3 | 0.091/0.062 | 0.7 | 057 | 14.4 | 2.6 | JHK′K | 1 |
| LHS 2397aAB | M8/L7.5 | 0.090/0.068 | 0.8 | 021 | 3.0 | 4.5 | F814W | 3 |
| 2MASS 1426+1557AB | M8.5/L1 | 0.083/0.075 | 0.9 | 015 | 3.6 | 0.67 | JHK′K | 1 |
| 2MASS 2140+1652AB | M8.5/L0 | 0.087/0.075 | 0.9 | 016 | 3.7 | 0.75 | JHK′K | 1 |
| 2MASS 0746+2000AB | L0.5/L0.5 | 0.075/0.075bbAssuming and age of 1 Gyr, Teff scale from Burgasser et al. (2002d), and evolutionary models from Burrows et al. (1997). | 1.0 | 022 | 2.7 | 0.63 | F814W | 4 |
| 2MASS 1146+2230AB | L3/L3 | 0.06/0.06ccUpper limit on masses based on the detection of 6708 Å Li absorption (Kirkpatrick et al., 1999; Reid et al., 2001). | 1.0 | 029 | 7.6 | 0.31 | F814W | 4 |
| 029 | 7.6 | 0.0 | K | 5 | ||||
| Gliese 564BC | L4/L4 | 0.053/0.053 | 1.0 | 013 | 2.4 | 0.30 | JHKs | 6,7 |
| DENIS 12281159AB | L5/L5 | 0.06/0.06ccUpper limit on masses based on the detection of 6708 Å Li absorption (Kirkpatrick et al., 1999; Reid et al., 2001). | 1.0 | 028 | 5.1 | 0.22 | F110M | 8,4 |
| 027 | 4.9 | 0.10 | K | 5 | ||||
| 2MASS 0850+1057AB | L6/T? | 0.05/0.04 | 0.8 | 016 | 4.4 | 1.3 | F814W | 4 |
| 2MASS 0920+3517AB | L6.5/L6.5 | 0.68/0.68 | 1.0 | 007 | 1.6 | 0.43 | F814W | 4 |
| DENIS 02051159AB | L7/L7 | 0.05/0.05 | 1.0 | 051 | 9.2 | 0.0 | K | 5 |
| 035 | 6.3 | 0.0 | JHKL’ | 9 | ||||
| 2MASS 15342952AB | T5.5/T5.5 | 0.035/0.035bbAssuming and age of 1 Gyr, Teff scale from Burgasser et al. (2002d), and evolutionary models from Burrows et al. (1997). | 1.0 | 007 | 1.0 | 0.5 | F814W | 10 |
| 2MASS 12252739AB | T6/T8 | 0.033/0.024bbAssuming and age of 1 Gyr, Teff scale from Burgasser et al. (2002d), and evolutionary models from Burrows et al. (1997). | 0.7 | 028 | 3.2 | 1.6 | F814W | 10 |