Beyond the X–ray background with XEUS
Abstract
We briefly discuss the perspectives of sensitive hard X–ray observations with the large collecting area X–ray telescopes of XEUS.
1 Introduction
Thanks to the excellent performances of the new generation of X–ray satellites both in terms of spatial resolution (Chandra) and high energy throughput (XMM–Newton) it has been possible to perform the deepest X–ray observations and almost completely resolve the 0.5–8 keV X–ray background (XRB) into single sources (Brandt et al. 2001; Giacconi et al. 2002). Although at the flux limits reached by deep Chandra surveys a large variety of sources has been detected, Active Galactic Nuclei (AGN) provide the most important contribution to the overall energy budget of the hard XRB. The increasing observational evidence of a large population of obscured sources support the prediction of AGN synthesis models for the X–ray background (Setti & Woltjer 1989; Comastri et al. 1995; Gilli et al. 2001). At this stage it seems obvious to conclude that there would be no other deep X–ray surveys if the origin of the XRB is considered a closed issue.
In the following we try to outline a few topics which would greatly benefit from further observations with a large collecting area X–ray facility such as XEUS.
2 The content of hard X–ray surveys
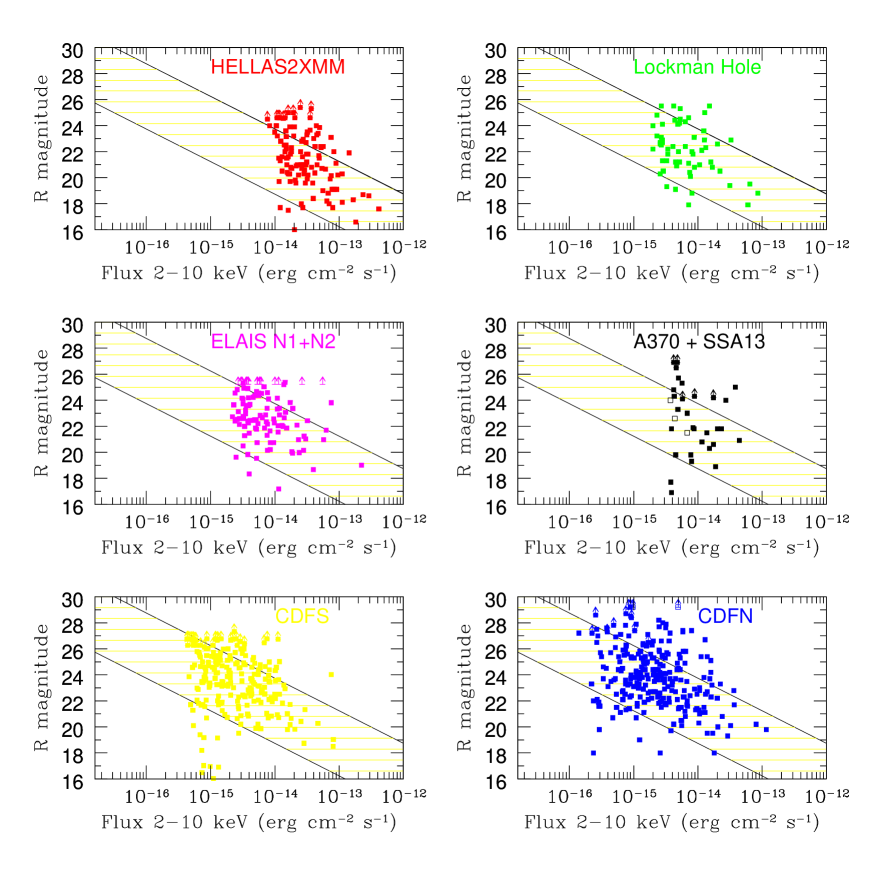
The overall status of optical follow–up observations of X–ray sources
is usually summarized by plots of the R–band magnitude versus the
2–10 keV X–ray flux (Figure 1). The range of X–ray to optical flux ratios
of spectroscopically identified AGN
is marked with the shaded area within –1 log 1
(Maccacaro et al. 1988).
This trend holds for a large number
of sources over a broad range of fluxes.
Attention should be paid to those sources which deviate from
log.
The objects characterized by high values of
are optically faint, sometimes below the
limits of deep optical images.
The spectroscopic identification of these objects
is already challenging the capabilities of 8–10 m ground
based telescopes. Although obscured accretion seems to provide
the most likely explanation for their X–ray to optical
flux ratios distribution (Comastri, Brusa & Mignoli 2002)
the observed properties are also consistent with those expected
for high redshift (possibly even ) quasars and
cluster of galaxies at .
A not negligible number of X–ray sources
have optical counterparts which are brighter than expected for AGN
and lie below log.
The identification breakdown suggests that these objects are fairly
normal galaxies and the X–ray emission is powered by processes
associated with star formation, even though obscured accretion
might be responsible of the peculiar broad band properties
of a few of them (Comastri et al. 2002a).
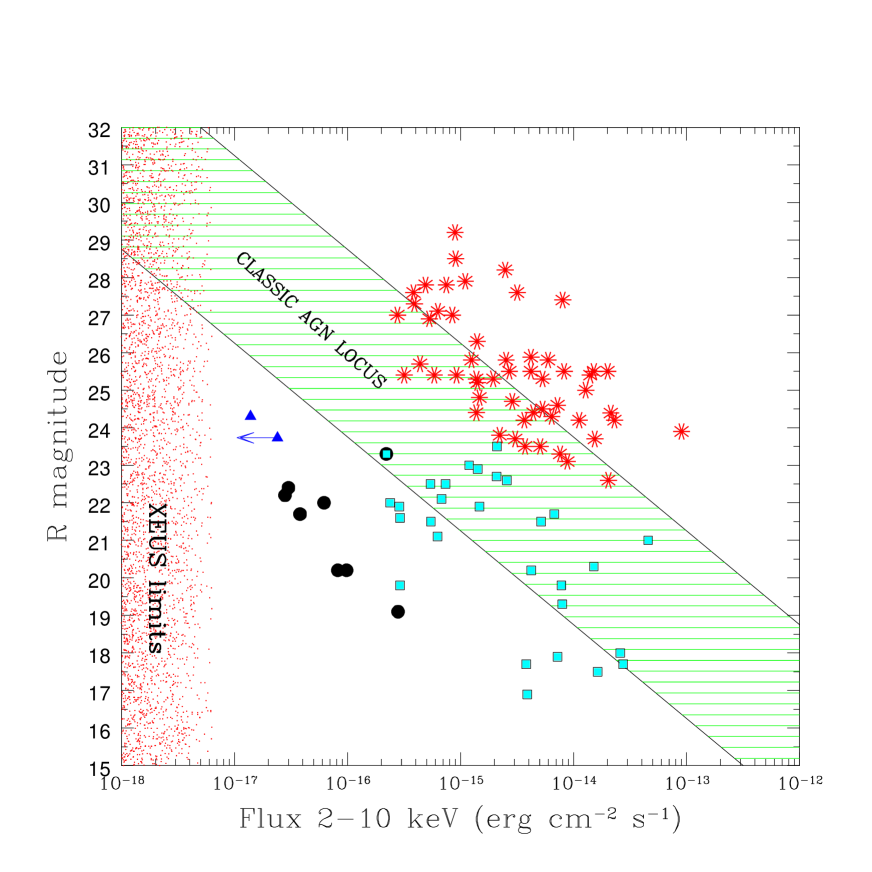
3 Selected outliers in the plane
For the purposes of the present discussion we have selected three different classes of hard X–ray selected sources which, in our opinion, deserve further investigation and would greatly benefit from deeper X–ray observations. An expanded view of their X–ray and optical fluxes is reported in Figure 2. The red asterisks in the upper part of the diagram correspond to extremely red objects (EROs), the cyan squares around log are X–ray Bright Optically Normal Galaxies (aka XBONG; Comastri et al. 2002b), while the black circles in the lower left part are spectroscopically confirmed starburst galaxies.
3.1 Extremely Red Objects
The bulk of the overall energy output of Extremely Red Objects (R–K 5 or I–K 4) is, almost by definition, in the near–infrared band. The red colors are consistent with those expected for passively evolving galaxies, dust–enshrouded starburst galaxies or reddened AGN at 1. Recent Chandra and XMM–Newton hard X–ray observations (Alexander et al. 2002a, Brusa et al. 2002a, Vignali et al. 2002) have proven to be very powerful in disentangling the various possibilities. The properties of X–ray detected EROs are consistent with those of high redshift, luminous, obscured AGN. Therefore, hard X–ray selected EROs have the properties of the so far elusive population of type 2 quasars predicted by the synthesis models and responsible for the energetically dominant component of the XRB. Stacking analysis of those objects which are not individually detected suggests that, on average, star–forming systems are more luminous X–ray sources than passively evolving galaxies (Brusa et al. 2002b).
3.2 X-ray bright optically normal galaxies
The excellent spatial resolution of the Chandra detectors allowed to unambiguosly identify an intriguing new class of X–ray sources (Hornschemeier et al. 2001, Barger et al. 2002). They are found at moderately low redshift ( 1) and are characterized by an absorption dominated optical spectrum and AGN–like hard X–ray luminosities ( erg s-1). The average value of their log distribution is around with a large dispersion (Fig. 2). An attempt to investigate their nature through a multiwavelength approach suggests that the putative AGN responsible for the hard X–ray emission is completely hidden at longer wavelengths (Comastri et al. 2002b). It has been also suggested that the observed broad band properties can be explained by the presence of an heavily obscured ( cm-2) Compton thick AGN (Comastri, Brusa and Mignoli 2002).
3.3 The hard X–ray luminosity and the star formation rate
It is well known that the radio and far–infrared luminosities of
star–forming galaxies follow a tight linear relation.
Making use of a sample of nearby star–forming galaxies
observed by ASCA and BeppoSAX it has been shown that
a linear relation holds also between the X–ray and both
the radio and far–infrared bands (Ranalli, Comastri & Setti 2002).
Such a relation has been extended to 1
combining the 1 Ms Chandra Deep Field North exposures
with deep 15m ISOCAM (Alexander et al. 2002b)
and 1.4 GHz VLA observations (Bauer et al. 2002)
and up to 3 via stacking analysis of
Lyman break galaxies (Nandra et al. 2002).
These results imply that the hard X–ray emission can be used as
an absorption independent indicator of the star formation rate.
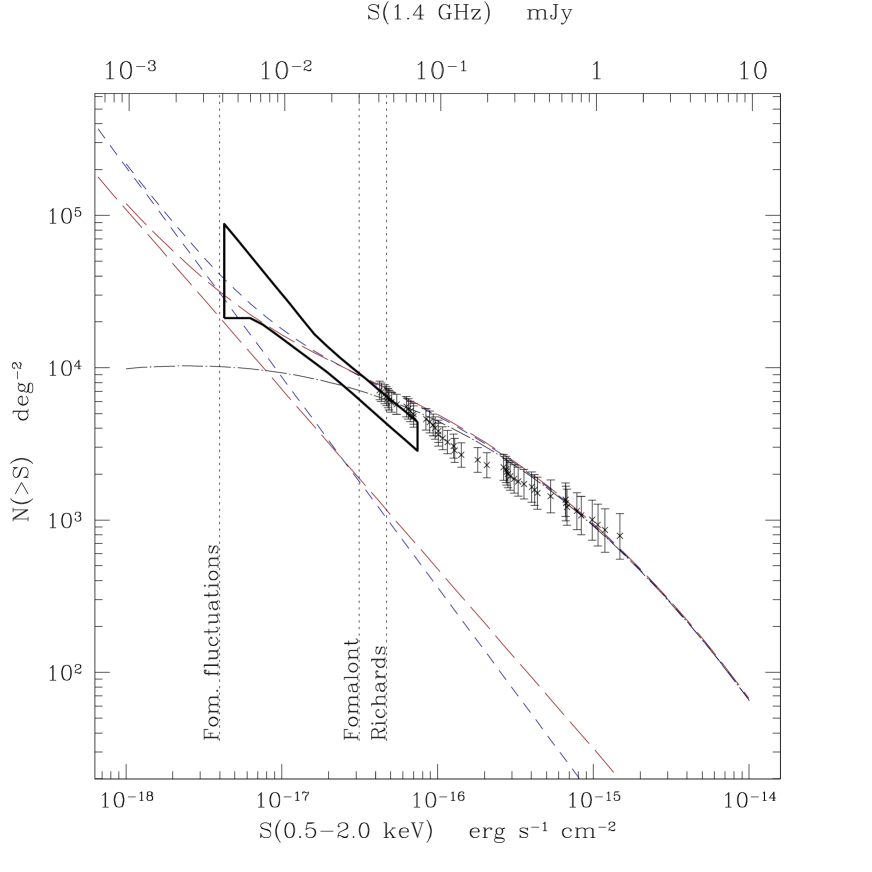
Moreover it is possible to compute the expected X–ray counts
of star–forming galaxies from the Log–Log measured in
deep radio surveys (Fig. 3). The number counts of
star–forming galaxies begin to overcome AGN counts at fluxes of the
order of 10-17 erg s-1 cm-2. Interesting enough
the predictions are fully consistent with the constraints
from fluctuation analysis in deep Chandra fields
(Miyaji & Griffiths 2002) and with the number counts expected
by the X–ray binaries resulting from the peak in the cosmic star
formation rate at 1 (Ptak et al. 2001).
4 Perspectives for XEUS deep fields
The foreseen XEUS capabilities in terms of collecting area will allow to obtain (with exposure times ranging from 100 ks to 1 Ms) good quality X–ray spectra for almost all the X–ray sources discovered in the deepest Chandra and XMM–Newton surveys. Given that most of these sources are likely to be the obscured AGN responsible for the bulk of the hard X–ray background, it will be possible to completely characterize the cosmic history of accretion powered sources. It is also worth noticing that the detection of iron K features could provide the only method (besides spectroscopy with 30–100 m optical telescopes and the photometric technique) to obtain a redshift estimate for those sources with extremely faint optical counterparts. The detection of X–ray sources will be pushed down to limiting fluxes of the order of a few erg s-1 cm-2. At this level starburst galaxies will be detected in the X–ray band to at least 3, allowing to obtain an independent constraint on the cosmic star formation history to be compared with those obtained at longer wavelengths, and to investigate the connection with the onset and fueling of massive black holes.
Acknowledgements.
This research has been partially supported by ASI contracts I/R/113/01; I/R/073/01 and by the MIUR grant Cofin–00–02–36. We thank G.G.C. Palumbo for useful comments.References
- [1] Alexander, D.M., Vignali, C., Bauer, F.E., et al., 2002a, AJ, 123, 1149
- [2] Alexander, D.M., Aussel, H., Bauer, F.E., et al., 2002b, ApJ, 568, L85
- [3] Baldi, A., Molendi, S., Comastri, A., et al., 2002, ApJ 564, 190
- [4] Barger, A.J., et al., 2001, AJ, 121, 662
- [5] Barger, A.J., Cowie, L.L., Brandt, W.N., et al., 2002, AJ 124, 1839
- [6] Bauer, F.E., Alexander, D.M., Hornschemeier A.E., et al. 2002, AJ in press (astro–ph/0207433)
- [7] Brandt, W.N., et al., 2001, AJ, 122, 2810
- [8] Brusa, M., Comastri, A., Daddi, E., Cimatti, A., & Vignali, C. 2002a, in “X–ray spectroscopy of AGN with Chandra and XMM–Newton”, eds. Boller T., Komossa S., Kahn S., Kunieda H. (astro–ph/0204251)
- [9] Brusa, M., Comastri, A., Daddi, E., Cimatti, A., Mignoli, M., & Pozzetti, L., 2002b, submitted to ApJ
- [10] Comastri, A., Setti, G., Zamorani, G., & Hasinger, G., 1995, A&A 296, 1
- [11] Comastri, A., Mignoli, M., Ciliegi, P., et al., 2002a, ApJ 571, 771
- [12] Comastri, A., Brusa, M., Ciliegi, P., et al., 2002b, in proceedings of “New Visions of the X-ray Universe in the XMM-Newton and Chandra Era” , 26-30 November 2001, ESTEC, The Netherlands (astro–ph/0203019)
- [13] Comastri, A., Brusa, M., & Mignoli, M., 2002, proceeding of the workshop “X-ray surveys, on the light of the new observatories” Santander, September 2002, AN 324, in press
- [14] Fomalont, E.B., et al., 1991, AJ, 102, 1258
- [15] Giacconi, R., et al., 2002, ApJS, 139, 369
- [16] Gilli, R., Salvati, M., & Hasinger, G., 2001, A&A, 366, 407
- [17] Hornschemeier, A.E., Brandt, W.N., Garmire, G.P., et al., 2001, ApJ, 554, 742
- [18] Maccacaro, T., Gioia, I.M., Wolter, A., Zamorani, G., Stocke, J.T.: 1988, ApJ 326, 680
- [19] Mainieri, V., et al. 2002, A&A, 393, 425
- [20] Manners, J.C., et al., 2002, MNRAS submitted (astro–ph/0207622)
- [21] Miyaji, T., & Griffiths, R.E., 2002, ApJ, 564, L5
- [22] Nandra, K., et al., 2002, ApJ, 576, 625
- [23] Ptak, A., Griffiths, R., White, N., Ghosh, P., ApJ 559, L91
- [24] Ranalli, P., Comastri, A., & Setti, G.C., 2002, A&A, in press
- [25] Ranalli, P., 2002, proceeding of the workshop “X-ray surveys, on the light of the new observatories” Santander, September 2002, AN 324, in press
- [26] Richards, E.A., 2000, ApJ, 533, 611
- [27] Setti, G., & Woltjer, L., 1989, A&A, 224, L21
- [28] Vignali, C., et al., 2002, proceedings of the 5th Italian AGN Meeting ”Inflows, Outflows and Reprocessing around black holes”, astro–ph/0209415