1-2 \Year2003 \Month02 \Pagespan000000 \lhead[0]P. Ranalli: Faintest star forming galaxies \rhead[Astron. Nachr./AN 324 (2003) 1/2]0 \headnoteAstron. Nachr./AN 324 (2003) 1/2, 000–000
ranalli@bo.astro.it
The Faintest Star Forming Galaxies
1 X-rays from the radio sub-mJy galaxies: two megaseconds of Chandra in the HDFN
We searched for X-ray detections of star forming galaxies at high redshift in the 2 Ms Chandra observation of the Hubble Deep Field North (HDFN). Star forming galaxies with were selected from the deep radio surveys in the HDFN (Richards et al. 1998, AJ 116, 1039; Richards 2000, ApJ 533, 611; Garrett 2000, A&A 361, L41); our selection criterium has been to include all galaxies with Spiral or Irregular morphologies, known redshifts and no AGN signatures in their optical spectra. From a preliminary data reduction, ten sources were detected in the X-rays; for them we determined rest-frame 0.5-2.0 and 2.0-10 keV fluxes and best-fit X-ray slopes with the same method described in Ranalli et al. (2002, A&A in press).
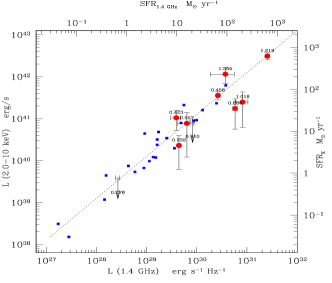
X-ray and radio fluxes and luminosities (Fig. 1) of these 10 high redshift objects follow the same linear relation which holds for nearby galaxies and allows the use of the X-ray luminosity as a Star Formation Rate indicator (Ranalli et al. 2002, Proc. Symp. “New Visions of the X-ray Universe”, ESTEC 2001, astro-ph/0202241). With fluxes of the order of a few erg s-1 cm-2, these are the faintest normal galaxies ever detected in the X-rays.
2 X-ray number counts and background
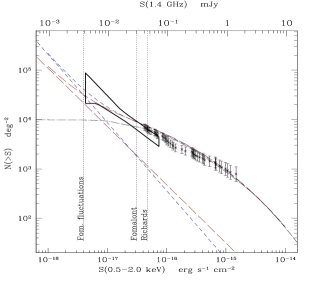
We consider the number counts for the radio sub-mJy population associated with
faint blue galaxies at high redshift (, ) representing an early era of star formation in the universe. The deepest radio surveys (at 5 GHz: Fomalont et al. 1991, AJ 102, 1258; at 1.4 GHz: Richards 2000) give the Log –Log for this population.
Under the assumption that all the objects are placed at the same redshift (so that K-corrections are the same), the radio Log –Log can be converted to X-ray counts via the radio/X-ray relation. We find that the number counts of star forming galaxies should overcome AGN counts at fluxes of the order erg s-1 cm-2. Our prediction for the soft X-ray counts is fully consistent with the constraints from fluctuation analysis in the deepest Chandra fields (Miyaji & Griffiths 2002, ApJ 564, L5).