00 \Year0000 \Month00 \Pagespan000000 \lhead[0]A.N. Author: Title \rhead[Astron. Nachr./AN XXX (200X) X]0 \headnoteAstron. Nachr./AN 32X (200X) X, XXX–XXX
Hard X–ray observations of Extremely Red Objects
Abstract
Extremely Red Objects (EROs, RK5) constitute a heterogenous class of extragalactic sources including high redshift elliptical galaxies, dusty star–forming systems and heavily obscured AGNs. Hard X-ray observations provide an unique and powerful tool to uncover obscured nuclear or star–forming activity. We present the results of XMM–Newton observations of the largest sample of EROs available to date (about 450 objects over a contiguous area of 700 arcmin2). Five of the 46 hard X–ray selected sources brighter than 3 cgs in the 2–10 keV band, are associated with EROs. All of the X-ray detected EROs show rather extreme X–ray–to–optical flux ratios, suggesting the presence of highly obscured AGN activity. We also report on the X–ray stacking analysis of spectroscopically identified EROs in the Chandra Deep Field South.
keywords:
galaxies: active – galaxies: starburst – surveys – X–rays: galaxiesbrusa@bo.astro.it
1 Introduction
Extremely Red Objects (EROs, )
show the bulk of the emission in the near-infrared band and are
associated with extremely faint optical counterparts that have so far
limited the identification process. The first available
optical–infrared spectra (e.g., Cimatti et al. 1998; Smail et
al. 1999; Pierre et al. 2001) and the recent results from the
K20 survey (Cimatti et al. 2002) indicate that
EROs counterparts lie at high redshifts.
In particular, their colors are consistent
with those of early–type passively evolving galaxies, dusty
star–forming systems and Active Galactic Nuclei (AGN) reddened by
dust and gas in the redshift range 3.
The relative fraction of these different subclasses among the ERO population
is a key parameter in the study of the galaxy evolution
and can constrain models which link the formation of
massive elliptical galaxies and the onset of AGN activity (Granato et al. 2001;
Almaini et al. 2002).
Hard X-ray observations provide a
powerful tool to uncover AGN among the EROs population.
Indeed, a sizeable fraction of hard X-ray sources recently discovered
in deep Chandra and XMM–Newton surveys are associated with EROs,
the exact value depending on the limiting fluxes reached in the
optical and X-ray bands (Brusa et al. 2002a; Mainieri et al. 2002;
Alexander et al. 2002).
Moreover, the excellent imaging capabilities of Chandra enable to probe the average X–ray properties of EROs
even beyond the limiting flux of deep surveys, using the stacking
analysis technique.
In this framework we have developed two complementary programs of hard X-ray observations of EROs making use of both Chandra and XMM–Newton data. First, we present the results of a XMM–Newton survey on a large, complete sample of EROs which is the most suitable one to estimate the fraction of AGN–powered EROs among the optically selected population. Then, we have constrained the high-energy properties of a sample of spectroscopically identified non–AGN EROs in the Chandra Deep Field South (CDFS) via stacking analysis.
Throughout the paper, a cosmology with km s-1 Mpc-1, =0.3 and =0.7 is adopted.
2 XMM–Newton observation of the “Daddi Field”
2.1 X–ray data analysis and results
We have started an extensive program of multiwavelength
observations of the largest sample of EROs available to date
(450 sources), selected in a contiguous area over a
arcmin2 field (the “Daddi field”, Daddi et al. 2000) and
complete to a magnitude limit of K19.2.
Deep optical (R at the 3 level) photometry is
available (see Daddi et al. 2000 for details in
optical and near–infrared data reduction) and VIMOS spectroscopy is
planned at VLT.
The Daddi field was observed by XMM–Newton on August 3, 2001 for a nominal exposure
time of ks.
The XMM–Newton data were processed using version 5.2 of the Science Analysis System
(SAS). The event files were cleaned up from hot pixels and soft proton
flares; the resulting exposure time is ks in the MOS1 and MOS2
detectors and ks in the pn detector.
The EBOXDETECT task, the standard SAS sliding box cell
detect algorithm, was run on the 0.5–2, 2–8 and 0.5–8 keV cleaned events.
We limited the X-ray analysis in a region of ten arcmin radius from
the centre of the XMM–Newton pointing, to take into account the
broadening of the XMM–Newton PSF at increasing distance from the aim
point. Ninety–one sources were detected in the full X–ray band with a
threshold in Poisson probability of 5;
the corrisponding flux limit is erg cm-2 s-1assuming
a power–law spectrum with =1.8 and Galactic absorption
(N cm-2).
The X–ray centroids have been corrected for systematic errors with
respect to the optical positions of three bright quasars
in the field (Hall et al. 2000) and then were cross–correlated with
the –band and –band catalogs.
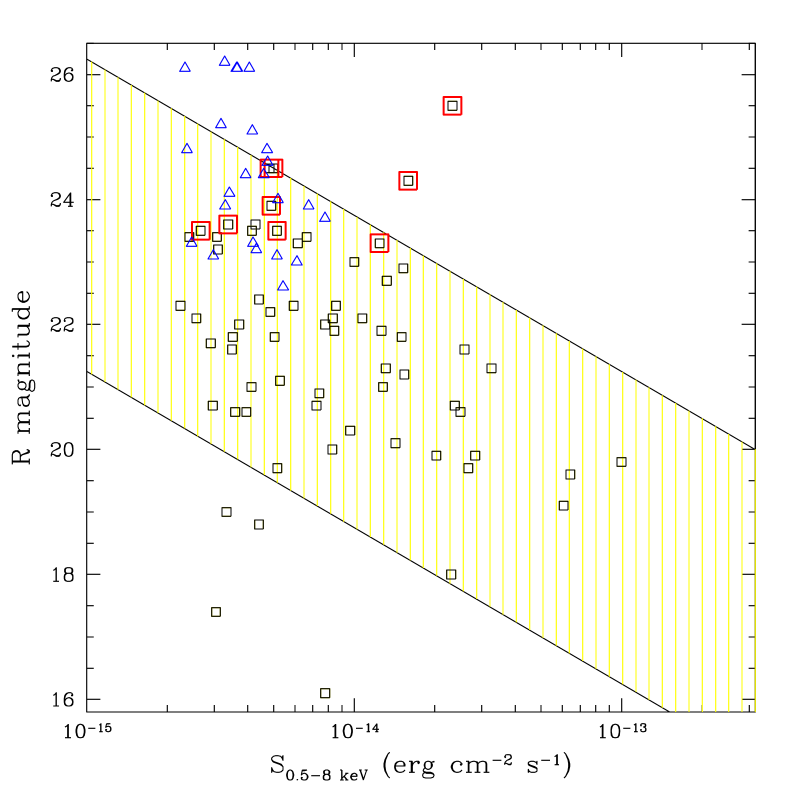
We searched for near–infrared counterparts within a radius of 6′′ from the X–ray position; we note, however, that the 75% of the sources lie within a 3′′ radius circle. The results and the optical identifications are summarized in Fig. 1: 80% of the 0.5–8 keV sources have at least one near–infrared counterpart down to the K–band magnitude limit; four sources are not detected at the R–band limit. Nine out of ninety–one sources are associated with EROs (10%); the fraction is the same (5/46) for the 2–8 keV sample. We refer to Brusa et al. (2002a) for a more detailed discussion on the XMM–Newton data analysis, the associations of X–ray sources with optical counterparts and the analysis of X–ray colors.
2.2 AGN fraction in optically selected samples
The AGN fraction among optically selected EROs samples is still very uncertain (Brusa et al. 2002a; Mainieri et al. 2002), and strongly dependent on the limiting fluxes reached in both the X–ray and near–infrared bands. About 370 EROs fall within the XMM–Newton area analysed in this work. The fraction of AGN–powered, hard X–ray selected EROs at the near–infrared (K=19.2) and X–ray flux limits of our survey is therefore 2% (5/370). This fraction rises up to 14% at at K20.1 and S erg cm-2 s-1 limiting fluxes of the CDFN observation (Alexander et al. 2002), supporting the idea that the bulk of the EROs population is not related to active phenomena.
It is worth noticing that these AGN–powered EROs, as well as others examples of hard X–ray selected EROs show a relatively well-defined correlation between the X–ray fluxes and the optical magnitude around fX/f 10. This correlation is shifted by one order of magnitude from the one found by ROSAT for soft X–ray selected quasars (Hasinger et al. 1998) and recently extended by Chandra and XMM–Newton observations to hard X–ray selected sources (Alexander et al. 2002; Lehmann et al. 2001). The most plausible explanation of such a high X–ray–to–optical flux ratio in these objects is the presence of high obscuration towards the active nuclear source. This hypothesis is strongly supported by optical identifications available for a handful of objects (Cowie et al. 2001; Mainieri et al. 2002; Hornschemeier et al. 2001) and by the X–ray spectral analysis (see Sect. 4).
3 Stacking EROs in the CDFS
The K20 EROs sample (Cimatti et al. 2002) in the Chandra Deep Field South (CDFS) area
includes 48 objects at .
For the purposes of the present work we consider only the
21 spectroscopically identified EROs which have been
classified in two categories:
13 “dusty”, i.e. objects showing at least an emission line (tipically
[OII]) over a red continuum, and 8 “old”, i.e. objects
with an absorption–line spectrum, consistent with that of early–type,
passively evolving galaxies, distributed on a similar
range of redshifts ().
For the X–ray analysis, we made use of the public CDFS
one megasecond Chandra observation available in the archive
(Giacconi et al. 2002).
At first, we have searched for individual X–ray emission from
all the objects in the EROs spectroscopic redshift catalog of Cimatti
et al. (2002).
Only one source, a dusty ERO at , was
individually detected in the one megasecond exposure.
The optical position is almost coincident (, within the
accuracy of the K–band position) with the Chandra source CXO CDFS J033213.9-274526
in the Giacconi et al. (2002) catalog.
The very hard X–ray spectrum and the high intrinsic X–ray luminosity
unambiguously reveal the presence of an obscured AGN in this source.
Indeed, this object is undetected in the soft band, implying an
intrinsic column density larger than 4 cm-2,
and an unabsorbed hard X–ray luminosity L
erg s-1; its properties are then more extreme than those
inferred from the 2 Ms CDF–N spectral analysis (Vignali et al. 2002).
Given the small area sampled and the spectroscopic incompleteness,
the present ERO sample is not suitable for a reliable estimate of
the AGN fraction among the EROs population. However, the present
low detection rate of AGN among EROs (1/21) confirms that the bulk
of the EROs population is not related to active phenomena (see
Sect. 2.2).
In order to constrain the average X–ray properties of individually
undetected EROs, we have applied the
stacking technique (Brandt et al. 2001; Nandra et al. 2002)
separately for the two classes of objects. The samples
consist of 12 “dusty” and 8 “passive” EROs,
with average redshifts of and , respectively.
We performed the detection in the three standard X–ray bands (0.5–8,
0.5–2 and 2–8 keV) and in the 1–5 keV band which roughly
corresponds to the rest–frame hard X–ray band at the average
redshift of the samples.
We refer to Brusa et al. (2002b) for details on the X–ray
data analysis.
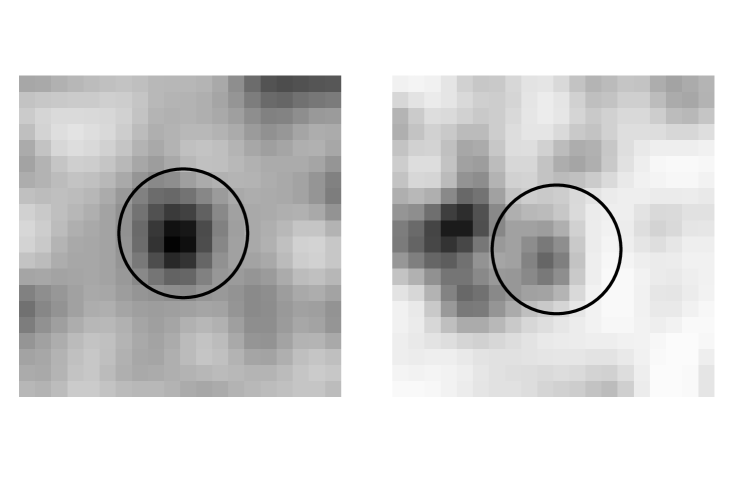
In Fig. 2 we show the summed images in the full (0.5–8 keV) band.
The most important finding is that the two spectroscopically classes of EROs
have different X–ray properties.
3.1 An X–ray dichotomy
The X–ray emission from “old” EROs remains undetected in all the considered energy bands, for a total effective exposure time of Ms. Assuming a thermal emission model with kT=1 keV and solar metallicity, fully consistent with the average X–ray spectrum of nearby elliptical galaxies (e.g., Pellegrini 1999), the 3 upper limit on the 0.5–2 keV luminosity is erg s-1.
An excess of counts above the expected background level is clearly
present in the “dusty” sample, for a total effective exposure time
of 10 Ms. The signal is stronger in the full band (99.997% confidence level
assuming a Poisson distribution, corresponding to about
4.2) and it is still present,
although at a slightly lower confidence level, in the soft and
1–5 keV band, while it is not statistically significant in the hard
band.
Assuming a power–law spectrum plus Galactic absorption
(N cm-2),
the 3 upper limit on the average band ratio
(H/S0.85, where H and S indicates the hard band
and soft band counts, respectively),
corresponds to an absorption column density lower than cm-2
(see Fig. 4 in Alexander et al. 2002).
Given that the hard X–ray spectrum of nearby starburst galaxies is
well–represented by power–law models with slopes in the range
1.8 and low intrinsic absorption (e.g., Ptak et
al. 1999; Ranalli et al. 2002), we adopted =2.1 to compute
X–ray fluxes and luminosities.
With this assumption, the stacked count rate in the 1–5 keV band
corresponds to an average 2–10 keV rest–frame luminosity of
erg s-1, at the mean redshift .
The inferred, average X–ray luminosity
is around one order of magnitude larger than that of normal spiral
galaxies (Matsumoto et al. 1997), it is similar to that of the
starburst galaxy M82 (e.g., Griffiths et al. 2000; Kaaret et al. 2001)
and about 3 times lower than that of NGC 3256, one of the most
X-ray luminous starburst in the local Universe
(e.g., Moran, Lehnert, & Helfand 1999).
The starburst scenario is supported also by the optical data.
Indeed, following Cimatti et al. (2002), we recomputed the
average spectrum of the 12 EROs we used in the X–ray stacking analysis.
The average optical spectrum shows a very red and smooth continuum,
with a strong [OII] emission and lacks of the presence
of clear AGN indicators such as [NeV],
suggesting that the optical emission is dominated by star–forming
systems.
4 Hard X–ray properties of EROs
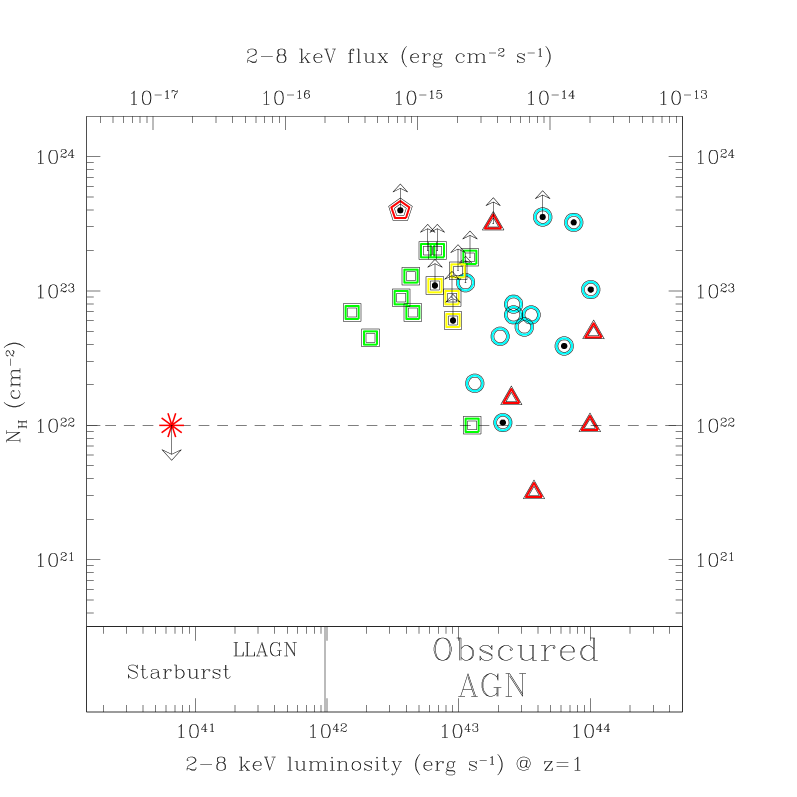
We have collected from the literature a sample of hard X–ray selected EROs serendipitously detected in moderate–deep and deep Chandra and XMM–Newton observations (Hornschemeier et al. 2001; Alexander et al. 2002; Mainieri et al. 2002). From the observed X–ray band ratio, we have computed for each ERO the corresponding X–ray column density for a source with a typical AGN power–law spectrum (=1.8) at , while for the sources in the Lockman Hole we adopted the best–fit value quoted by Mainieri et al (2002) and corrected to for unidentified sources. The results are reported in Fig. 3. Almost all of the individually detected sources are consistent with intrinsic column densities in excess of 1022 cm-2. The so far individually detected EROs have high X–ray luminosity (LX1043 erg s-1, in a few case even larger than erg s-1) and they actually are heavily obscured AGN, as inferred from X–ray spectral analysis (Cowie et al. 2001; Gandhi et al. 2002; Mainieri et al. 2002). Therefore, hard X–ray selected EROs (or at least a fraction of them) have properties similar to those of Quasars 2, the high–luminosity, high redshift type II AGNs predicted in X–Ray Background synthesis models (e.g. Comastri et al. 1995).
Stacking analysis of those objects not individually detected in the X–rays suggests a softer X–ray spectrum than that of AGN–powered EROs (see also Alexander et al. 2002). Moreover, the results from the CDFS K20 EROs sample suggest that different spectroscopic classes of EROs are characterized by different high–energies properties. Indeed, “dusty” EROs are moderately luminous hard X–ray emitters and their average X–ray spectrum (N cm-2) is consistent with that measured for nearby star–forming galaxies (e.g. Dahlem, Weaver & Heckman 1998). Early–type galaxies among EROs are not detected in the X–rays and their 3 upper limit on the soft X–ray luminosity is consistent with the emission from nearby elliptical galaxies (Pellegrini 1999).
5 Conclusions
The most important results can be summarized as follows:
-
Hard X–ray observations turned out to be extremely useful to pick–up AGN–powered EROs in optically selected samples. The fraction of AGN among EROs is in the range %, depending on the limiting fluxes in the X–ray and near–infrared bands.
-
AGN–powered EROs are X–ray luminous and obscured objects. The intrinsic column densities inferred for a sample of hard X–ray selected EROs are in excess of cm-2.
-
“Dusty” EROs are relatively unobscured (N cm-2) hard X–ray sources and their X–ray properties are consistent with those of nearby star–forming galaxies.
-
“Old” EROs are not detected in the X–rays.
Acknowledgements.
I thank A. Comastri, A. Cimatti, E. Daddi, M. Mignoli, L. Pozzetti and C. Vignali for fruitful discussion and for a careful reading of the manuscript. This work was supported by ASI I/R/113/01 and MIUR Cofin–00–02–36 grants.References
- [1] Alexander D.M., Vignali C., Bauer F.E., et al.: 2002, AJ123, 1149
- [2] Almaini O., et al.: 2002, MNRASin press (astro-ph/0108400)
- [3] Brandt, W.N., Hornschemeier, A.E., Schneider, D.P., et al.: 2001, ApJ558, L5
- [4] Brusa, M., Comastri, A., Daddi, E., Cimatti, A., Vignali, C.: 2002a, MPE Report 279, 267
- [5] Brusa, M., Comastri, A., Daddi, E., Cimatti, A., Mignoli, M., Pozzetti, L.:2002b, submitted to ApJ
- [6] Cimatti, A., Andreani, P., Rottgering, H., Tilanus, R.: 1998, Nat. 392, 895
- [7] Cimatti, A., et al.: 2002, Astron. & Astroph. 381, L68
- [8] Comastri, A., Setti, G., Zamorani, G., Hasingher, G.:1995, Astron. & Astroph. 296, 1
- [9] Cowie ,L.L., et al.: 2001, ApJ551, L9
- [10] Crawford, C.S., Fabian, A.C., Gandhi, P., Wilman, R.J., Johnstone, R.M.: 2001, MNRAS324, 427
- [11] Daddi E., Cimatti, A., Pozzetti L., et al.: 2000, Astron. & Astroph. 361, 535
- [12] Dahlem, M., Weaver, K.A., Heckman, T.M.: 1998, ApJS118, 401
- [13] Freeman, P.E., Kashyap, V., Rosner, R., Lamb, D.: 2002, ApJS138, 185
- [14] Gandhi, P., et al.: 2002, Proc. XXI Moriond Astrophysics Meeting, ”Galaxy Clusters and the High Redshift Universe Observed in X-rays” (astro–ph/0106139)
- [15] Giacconi, R., et al.: 2002, ApJS139, 369
- [16] Granato, G.L., Silva, L., Monaco, P., et al.: 2001, MNRAS324, 757
- [17] Griffiths, R.G., et al.: 2000, Science 290, 1325
- [18] Hall, P.B., et al.: 2000, AJ120, 2220
- [19] Hasinger, G., et al.: 1998, Astron. & Astroph. 329, 482
- [20] Hornschemeier, A.E., et al.: 2001, ApJ554, 742
- [21] Kaaret, P., Prestwich, A.H., Zezas, A., et al.: 2001, MNRAS321, L29
- [22] Lehmann, I., Hasinger, G., Murray, S.S. & Schmidt, M.: 2001, in “X-rays at Sharp Focus Chandra Science Symposium” (astro–ph/0109172)
- [23] Mainieri, V., Bergeron, J., Hasinger, G., et al.: 2002, Astron. & Astroph. 393, 425
- [24] Matsumoto, H., Koyama, K., Awaki, H., Tsuru, T., Loewenstein, M., Matsushita, K.: 1997, ApJ482, 133
- [25] Moran, E.C., Lehnert, M.D., Helfand, D.J.: 1999, ApJ526, 649
- [26] Nandra, K., Mushotzky, R.F., Arnaud, K., et al.: 2002, ApJ576, 625
- [27] Pellegrini, S.: 1999, Astron. & Astroph. 351, 487
- [28] Pierre, M., et al. 2001, Astron. & Astroph. , 372, L45
- [29] Ptak, A., Serlemitsos, P., Yaqoob, T., Mushotzky, R.F.: 1999, ApJS120, 179
- [30] Ranalli, P., Comastri, A., Setti, G.C.:2002, Astron. & Astroph. submitted
- [31] Smail, I., Ivison, R.J., Kneib, J.P., et al.: 1999, MNRAS308, 1061
- [32] Vignali, C., Alexander, D.M., Bauer, F.E., et al.: 2002, proceedings of the 5th Italian AGN Meeting ”Inflows, Outflows and Reprocessing around black holes”, astro–ph/0209415