01 \Year2002 \Month10 \Pagespan223227 \lhead[0]A. Comastri: Unconventional AGN \rhead[Astron. Nachr./AN XXX (200X) X]0 \headnoteAstron. Nachr./AN 32X (200X) X, XXX–XXX
Unconventional AGN in hard X-ray surveys
Abstract
Extensive programs of follow–up observations of hard X–ray selected sources have unambiguosly revealed that the sources of the X–ray background are characterized by an extremely large dispersion in their optical magnitude and spectroscopic classification. Here we present the results of an attempt to understand the nature of the observed variety using a simple prescription for their optical to X–ray energy distribution.
keywords:
X–rays , Surveyscomastri@anastasia.bo.astro.it
1 Introduction
Thanks to the capabilities of the detectors onboard Chandra and XMM–Newton the X-ray sky is now probed down to flux limits where the bulk of the hard X-ray background is resolved into single sources. The accuracy in the positioning of hard (2–10 keV) X–ray sources is more than an order of magnitude better than that achieved by ASCA and BeppoSAX in the same energy range. One of the most interesting consequences of this enormous improvement is the possibility to identify a relatively large number of hard X–ray sources characterized by broad band properties which are significantly different from those of conventional AGN selected in the optical and soft X–ray bands. Although there are compelling theoretical and observational evidences which suggest that the large majority of the hard X–ray sources are obscured AGN, the origin of such a broad variety in their multiwavelength properties is still far to be understood.
2 The diagnostic
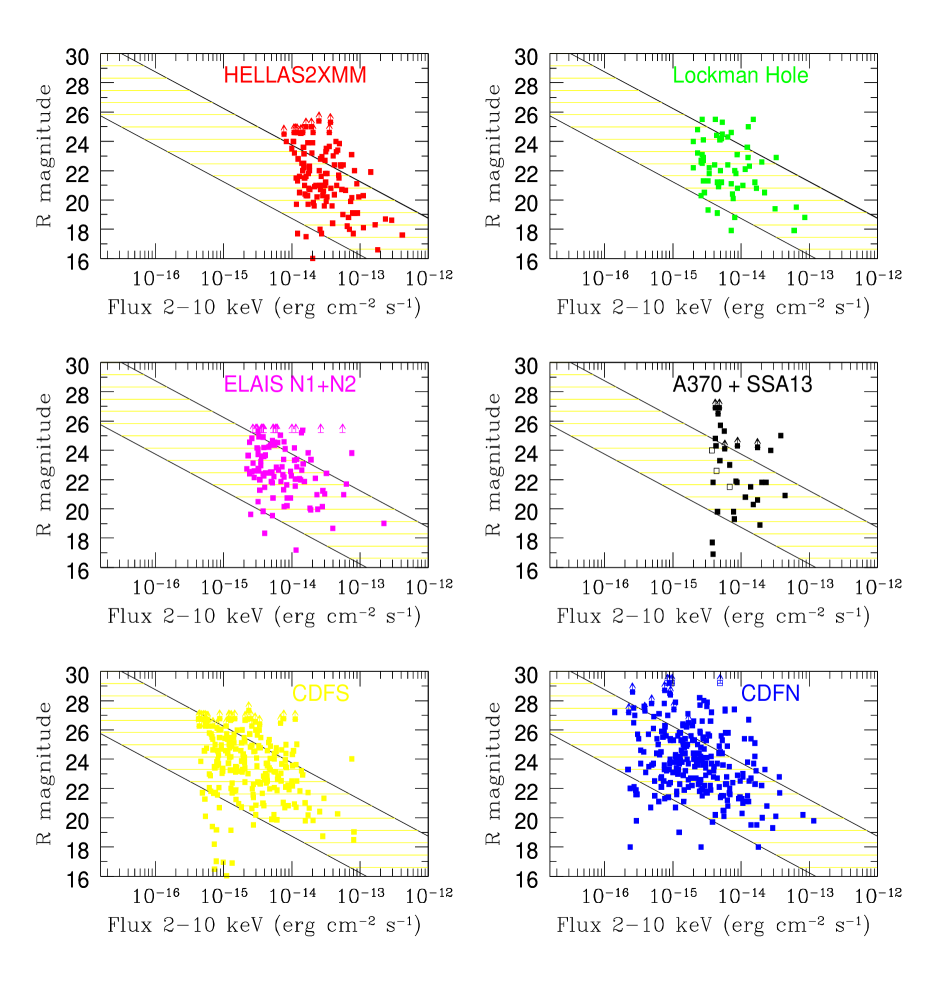
It is well known that various classes of X–ray emitters are characterized by different values of their X–ray to optical flux ratio (see fig. 1 in Maccacaro et al. 1988). For a given X–ray energy range and the R band filter the following relation holds: . The large majority of spectroscopically identified AGN in both ROSAT (e.g. Hasinger et al. 1998) and ASCA (Akiyama et al. 2000) surveys fall within 1. Extensive optical follow–up observations of hard X–ray sources discovered by deep and medium deep Chandra and XMM–Newton surveys confirm this trend to fainter X–ray fluxes and, at the same time, show evidence of a relatively large number of sources which deviate from log (Fig. 1). For the purposes of the present paper it is convenient to divide the “outliers” in two groups. The first includes sources that are X–ray weak for their R band magnitudes (log –1); the second, sources that are optically faint (sometimes below the limits of deep optical images) and relatively X–ray bright (log 1). In the following we refer to both classes of sources as unconventional AGN.
The identification breakdown of the sources in the first group is a mixed bag including emission line galaxies and apparently normal galaxies (see Alexander et al. this volume). A sizeable fraction of the latters, named XBONG (X–ray Bright Optically Normal Galaxies; Comastri et al. 2002b), are particulary intriguing being characterized by an absorption dominated optical spectrum and AGN–like hard X–ray luminosities ( erg s-1). They are found at moderately low redshift, ( 1; Hornschemeier et al. 2001, Barger et al. 2002). The average value of their log distribution is around –1 with a large dispersion (Fig. 3). An attempt to deeply investigate their nature through a multiwavelength approach suggests that the putative AGN responsible for the hard X–ray emission is completely hidden at longer wavelengths (Comastri et al. 2002a).
The sources characterized by high values of are even less understood. The spectroscopic identification of these objects is already challenging the capabilities of 8–10 m optical telescopes calling for the next generation of ground–based facilities or for alternative techniques such as multicolour optical photometry and, for the X–ray brightest sources, on the search for redshifted iron K lines. In this respect it is important to note that wide area, shallow, hard X–ray surveys, designed to sample relatively bright X–ray and optical fluxes (Fig. 1), are best suited to investigate the nature of sources with high X–ray to optical ratios. Indeed a few examples of objects with log in the HELLAS2XMM (F. Fiore et al., in preparation) and Chandra surveys (Fabian et al. 2000) turned out to be high redshift, highly obscured AGN.

Although obscured accretion seems to provide the most likely explanation for the optical and X–ray flux distribution of unconventional AGN, alternative possibilities are viable. At very faint optical fluxes (log ) the observed properties would be consistent with both high redshift (possibly even ) quasars and high–z () cluster of galaxies. The X–ray emission in optically bright sources () could be ascribed, at least in part, to star–formation related processes (see Hornschemeier 2002) or, for those objects detected in the radio band, to a BL Lac object with rather extreme properties (M. Brusa et al. in preparation).
3 A toy model for unconventional AGN
In the following we try to further investigate the nature of unconventional AGN assuming that they are powered by heavily obscured accretion. In order to properly address this issue it is important to point out that as long as the absorption column density does not exceed values of the order of “a few” 1024 cm-2 (mildly Compton–thick) the high energy spectrum recovers at 10–20 keV (see fig. 2); for higher values of the intrinsic absorption (heavily Compton–thick), Compton down–scattering strongly suppress the nuclear radiation at all energies and only reflected light with a quite flat slope can be seen (Matt et al. 1999). A strong iron line (EW 1 keV) is expected in both the cases. At longer wavelengths the nuclear radiation is completely blocked by dust and the optical infrared spectrum is dominated by the host galaxy starlight. There are several examples of both mildly and heavily Compton thick sources in the local Universe discovered thanks to BeppoSAX. The prototype of the former is NGC 6240 at (Vignati et al. 1999) while for the latter an handful of objects are reported by Maiolino et al. (1998). Whether Compton thick AGN are common at high redshift is still debated (Fabian et al 2002) though the ultraluminous infrared quasars IRAS 091044109 at (Franceschini et al. 2000, Iwasawa et al. 2001) and F15307 at (Ogasaka et al. 1997) are good examples of mildly and heavily Compton thick AGN, respectively.
It is quite obvious to note that moving the SED of a mildly Compton thick object (Figure 2) to progressively higher redshifts the K–corrections in the optical and X–ray band work in the opposite direction. The shape of the hard X–ray spectrum is responsible of the strong positive K–correction which “boosts” the X–ray flux and favours the detection of high redshift sources. The same effect has been already extensively used to detect high redshift, luminous, infrared galaxies at submillimeter wavelengths (Hughes et al. 1998). Indeed the steep rising of the X–ray and far–infrared spectrum towards high frequencies of the ultraluminous infrared galaxy IRAS 09104+4109 is very similar. Conversely, the weak rest–frame optical–UV emission is shifted in the R band explaining the extremely faint optical magnitudes. As a consequence the optical to X–ray flux ratio changes in a non–linear way.
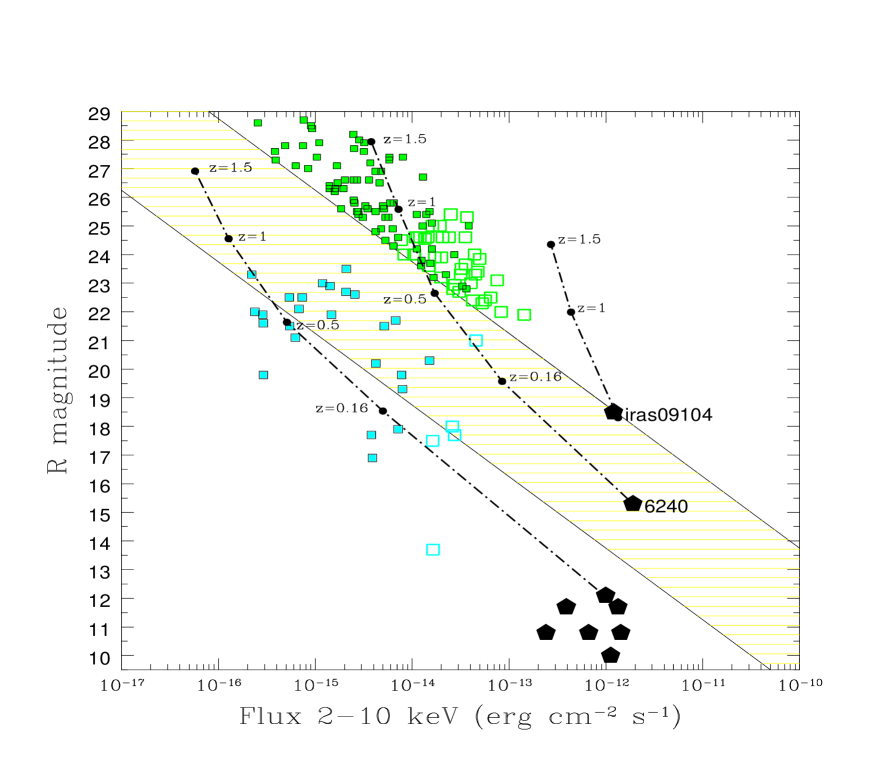
We have computed the optical magnitude in the R band and the 2–10 keV X–ray flux which would be observed for a source with the SED of Figure 2 from to . The redshift tracks in the optical magnitude versus X–ray flux plane (Fig. 3) have been normalized to the observed X–ray flux and R magnitude of NGC 6240 and IRAS 091044109. The two objects are characterized by a similar SED but different X–ray luminosities (about erg s-1 and 1046 erg s-1 respectively). The results clearly indicate that the observed high values of the X–ray to optical flux ratio are consistent with those expected by a population of high redshift, mildly Compton thick AGN with X–ray luminosities in the range log erg s-1.
We have also tried to explain with a similar approach the distribution of values of XBONG assuming that the underlying SED of the AGN powering the hard X–ray emission is that of a heavily Compton–thick object. The lower redshift track in figure 3, normalized to the locus of nearby objects in the BeppoSAX survey of Maiolino et al. (1998), is in relatively good agreement with the observed and redshift distribution of the XBONG sample.
Although it seems reasonable to argue that a large fraction of unconventional AGN are obscured by Compton thick gas our approximations appear to be too much simple to draw quantitative conclusions. At the face value our model predicts that most of the sources with log 1 are mildly Compton thick AGN in the redshift range 0.5–1.5. The presence of a large population of Compton thick AGN at faint optical magnitudes has been put forward by Fabian et al. (2002). On the basis of a more sophisticated model they suggest that such a population would have redshifts ranging from 2 to 8 and could be detectable in Chandra deep fields.
The detection of strong FeK features could in principle provide a powerful tool to check the space density and redshift distribution of Compton thick AGN. Although only an handful of objects exhibit obvious K lines (Bauer et al this volume) we expect to obtain more stringent constraints from an undergoing systematic spectral analysis of a carefully selected sample of unconventional AGN.
Acknowledgements.
This research has been partially supported by ASI contracts I/R/113/01; I/R/073/01 and by the MIUR grant Cofin–00–02–36.References
- [1] Akiyama, M., Otha, K., Yamada, T., et al.: 2000, ApJ 532, 700
- [2] Baldi, A., Molendi, S., Comastri, A., et al.: 2002, ApJ 564, 190
- [3] Barger, A.J., et al.: 2001, AJ 121, 662
- [4] Barger, A.J., Cowie, L.L., Brandt, W.N., et al.: 2002, AJ 124, 1839
- [5] Brandt, W.N., et al.: 2001, AJ, 122, 2810
- [6] Comastri, A., Mignoli, M., Ciliegi, P., et al.: 2002, ApJ 571, 771
- [7] Comastri, A., Brusa, M., Ciliegi, P., et al.: 2002, in proceedings of “New Visions of the X-ray Universe in the XMM-Newton and Chandra Era” , 26-30 November 2001, ESTEC, The Netherlands (astro–ph/0203019)
- [8] Fabian, A.C, et al.: 2000, MNRAS 315, L8
- [9] Fabian, A.C, Wilman, R.J., Crawford, C.S.: 2002, MNRAS 329, L18
- [10] Franceschini, A., Bassani, L., Cappi, M., et al.: 2000 A&A 353, 910
- [11] Giacconi, R., et al: 2001, ApJS, 139, 369
- [12] Hasinger, G., et al: 1998, A&A 329, 482
- [13] Hornschemeier, A.E., Brandt, W.N., Garmire, G.P., et al.: 2001, ApJ, 554, 742
- [14] Hornschemeier, A.E.: 2002, preprint, astro–ph/0210044
- [15] Hughes, D.H., Serjeant, S., Dunlop, J. et al.: 1998 Nature 394, 241
- [16] Iwasawa, K., Fabian, A.C., Ettori, S.: 2001 MNRAS 321, L15
- [17] Maccacaro, T., Gioia, I.M., Wolter, A., Zamorani, G., Stocke, J.T.: 1988, ApJ 326, 680
- [18] Mainieri, V., et al. 2002, A&A in press, (astro–ph/0207166)
- [19] Maiolino, R., Salvati, M., Bassani, L. et al.: 1998 A&A 338, 781
- [20] Manners, J.C., et al.: 2002 MNRAS submitted (astro–ph/0207622)
- [21] Matt, G., Pompilio, F., La Franca F.,: 1999, New Astr., 4, 191
- [22] Ogasaka Y. et al. 1997 PASJ 49, 179
- [23] Vignati, P., Molendi S., Matt G., et al: 1999 A&A 349, L57