http://lully.as.arizona.edu
ISO and the Cosmic Infrared Background
Abstract
ISO observed, for the first time to such a high sensitivity level, the mid- and far- infrared universe. A Number of deep surveys were performed to probe the cosmological evolution of galaxies. In this review, I discuss and summarize results of mid-infrared ISOCAM and far-infrared ISOPHOT surveys, and show how our vision of the extragalactic infrared universe has become more accurate. In particular, ISO allowed us to resolve into sources a significant fraction of the Cosmic Infrared Background (CIB) in the mid-infrared, and to probe a fainter population in the far-infrared with the detection of the CIB fluctuations. Together with other wavelength data sets, the nature of ISO galaxies is now in the process of being understood.
I also show that the high quality of the ISO data put strong constraints on the scenarios of galaxy evolution. This induced a burst in the development of models, yielding to a more coherent picture of galaxy evolution.
I finally emphasize the potential of the ISO data archive in the field of observational cosmology, and describe the next steps, in particular the forthcoming cosmological surveys to be carried out by SIRTF.
keywords:
ISO – infrared galaxies – galaxy evolution – extragalactic surveys – cosmic infrared background1 INTRODUCTION
The Cosmic Infrared Background (CIB) (e.g. Puget et al, 1996; Hauser & Dwek, 2001) is the relic emission of galaxy formation and evolution, being composed of light radiated from galaxies since their formation. The aim of the cosmological surveys is to resolve the CIB into sources, and to provide data on galaxies at various wavelengths, redshifts, with enough quality on individual objects as well as with statistical significant samples, in order to address the questions of the processes of galaxy formation and evolution, and the nature of the galaxies.
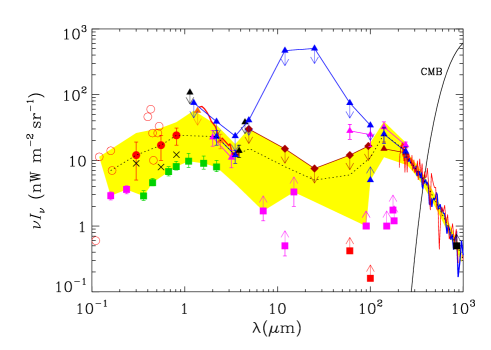
The CIB Spectral Energy Distribution (SED), shown in Fig. 1 (from Hauser & Dwek, 2001) shows the existence of a minimum between 3 and 10 separating direct stellar radiation from the FIR part due to radiation re-emitted by dust. The latter radiation contains at least a comparable integrated power as the former, and perhaps as much as 2.5 times more. This ratio is much larger than what is measured locally (30). The CIB is thus likely to be dominated by a population of strongly evolving redshifted IR galaxies.
ISO revolutionized our view of the extragalactic universe with sensitive cosmological surveys carried out in the mid- and far- infrared. Of course, other cosmological surveys have been carried out with SCUBA, MAMBO, Chandra, XMM, and in the optical range; all give invaluable informations about galaxy evolution, but it is beyond the scope of this short paper to review them. Reviews of extragalactic results from ISO can be found in Genzel & Cesarsky (2000) and Franceschini et al. (2001), and a comprehensive overview of ISO operations and science in Casoli et al. (2000) (particularly in the Puget & Guiderdoni paper). I will here summarize the main results obtained in the MIR with ISOCAM (Sect. 2), in the FIR with ISOPHOT (Sect. 3), and overview the models that ISO data were able to constrain (Sect. 4). Sect. 5 emphasizes the potential of the ISO archive, and in Sect. 6 I briefly explore the future of IR (and mm) astronomy, in particular with SIRTF.
2 MID INFRARED SURVEYS
2.1 Specificities
The mid-infrared surveys have been conducted with ISOCAM (Cesarsky et al., 1996), mainly at 7 and 15 ; a few have been performed at 4.5 and 12 (Clements et al., 1999). At 7 using the LW2 filter (e.g. Taniguchi et al., 1997; Oliver et al., 2002), the contamination by stars is important and data at other wavelengths (usually near infrared) are needed to identify them. The decreasing k-correction is less favorable for detecting higher redshift galaxies (dash line in Fig. 2, taken from Franceschini et al., 2001).

At 15 using the LW3 filter (e.g Elbaz et al., 1999), the stellar contamination is less of a problem and the k-correction of galaxies is favorable for detecting sources up to redshifts around 1.4 (Fig. 2). Thus, a significant part of the extragalactic results are based on 15 observations.
2.2 Source Counts
Source counts at 15 show an impressive consistency over four decades of flux between surveys of different depths (e.g. Elbaz et al., 1999, Gruppioni et al, 2002). Data come from large and shallow surveys like \objectELAIS (e.g. Serjeant et al, 2000), to narrower and deeper surveys (e.g. Serjeant et al, 1997, Aussel et al, 1999; Altieri et al, 1999). The number counts (summarized in Fig. 3 by Elbaz et al., 1999) are in excess by a factor of 10, at the 0.5 mJy level, compared to non evolution scenarios. The slope is steep ( in the differential counts, for mJy), and a turnover appears at mJy. At fainter levels, the convergence (decrease) is fast.

2.3 Nature of the Galaxies
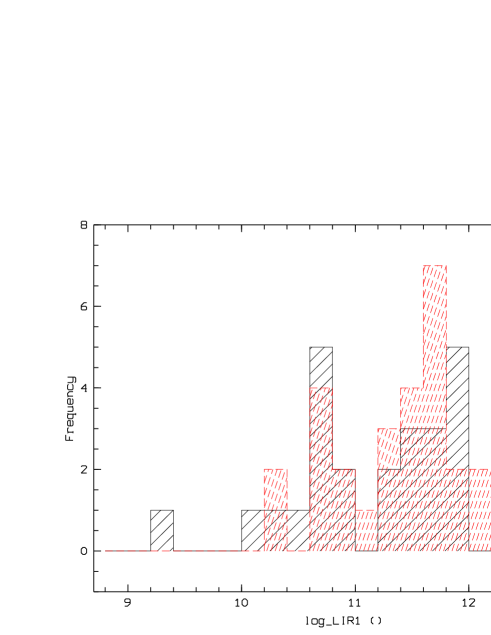
With a median redshift of and most of the sources with (Aussel et al., 1999), the MIR sources have a mean luminosity of (Elbaz et al., 2002). Most of them are experiencing intense stellar formation of about 100 yr-1, which appears to be uncorrelated with the faint blue galaxy population dominating the optical counts at z0.7 (Ellis 1997; Elbaz et al. 1999). Fig. 4 (from Elbaz et al., 2002) represents their HDF-N sample, and summarizes the properties of MIR galaxies: redshift distribution, luminosity, and SFR (for 80% of the non-AGN galaxies).

2.4 Galaxy Evolution
Elbaz et al (2002) present a summary of the galaxy evolution at 15 and beyond. First, they show that 60% of the CIB at 15 is created by LIRGs (). Second, they show that the comoving luminosity density at 15 was about 55 times larger at than today. Third, still using some assumption about the SED of the galaxies, they conclude that the comoving density of IR luminosity radiated by dusty starbursts (which is directly related to the star formation) was about times larger at than today. At intermediate redshifts, Flores et al (1999) also determined the star formation rate. Finally, they show that about half of the CIB at 140 is produced by LIRGs and about one third by ULIRGs. Thus MIR galaxies observed by ISOCAM have resolved about 75% of the CIB at 140 .
3 FAR INFRARED SURVEYS
3.1 Specificities
The far-infrared surveys have been conducted with ISOPHOT (Lemke et al., 1996), mainly at 90 and 170 ; a few have been performed at 60, 120, 150 and 180 (Juvela et al., 2000; Linden-Voernle et al., 2000). In the 50 to 100 range, the C100 Ge:Ga camera is sensitive to the peak of rest-frame emission from obscured star formation. The decreasing k-correction, in addition to a challenging data processing, led to probe mainly the local universe. With 46 arcseconds per pixel and a FWHM of about the same size, the angular resolution at 100 is significant improved since IRAS.
In the 100 to 200 range, the C200 stressed Ge:Ga camera is sensitive to the very cool local galaxies as well as higher redshift starburst galaxies, thanks to an advantageous k-correction (e.g. Guiderdoni et al., 1997) and the behavior of the camera (e.g. Lagache & Dole, 2001). With 92 arcseconds per pixel and a FWHM of about the same size, the angular resolution at 170 is an issue for source identifications.
3.2 Source Counts
Source counts at 170 (e.g. Kawara et al., 1998; Puget et al., 1999; Dole et al., 2001) exhibit a steep slope of between 180 and 500 mJy (lower left panel on Fig. 7) and, like in the MIR range, show sources in excess by a factor of 10 compared with no evolution scenario. This strong evolution was unexpected and quite difficult to reproduce with models. Matsuhara et al (2002) extended the source count analysis to fainter fluxes and still detected a strong evolution.
At 60 and 90 , the situation is less clear, but preliminary source counts (Kawara et al., 1998; Efstathiou et al., 2000; Linden-Voernle et al., 2000) are compatible with no evolution scenarios on their bright end, and begin to show evolutionary effects on their bright end. New processing techniques (see Sect. 5) will certainly allow to go deeper.
3.3 Nature of the Galaxies
Determining the nature of the FIR galaxies has been a longer process than in the MIR, mainly because of the difficulty to find the shorter wavelength counterparts in a large beam. Various techniques have been used to overcome this problem, one of the most successful being the identification using 20cm radio data (e.g. Ciliegi et al., 1999). Another technique is the FIR multiwavelength approach (Juvela et al., 2000) that helps constraining the position and the SED; it also helps to separate the cirrus structures from the extragalactic sources. A variation is to use ISOCAM and ISOPHOT data, like the ELAIS Survey (Oliver et al., 2000; Serjeant et al., 2000,2001). Finally, the Serendipity Survey (Stickel et al., 1998, 2000), by covering large and shallow areas, allows to detect many bright objects easier to follow-up or already known.
FIR ISO galaxies can be sorted schematically into two populations. First, the low redshift sources, typically (e.g Serjeant et al., 2001; Patris et al., 2002, Kakazu et al., 2002), have moderate IR luminosities, below , and are cold (Stickel et al., 2000). Second, sources at higher redshift, (Patris et al., 2002, see Fig. 5) and beyond, (Chapman et al., 2002) are more luminous, typically , and appear to be cold. Serjeant et al. (2001) derived the Luminosity Function at 90 , and started to detect an evolution compared to the local IRAS 100 sample.
3.4 Fluctuations of the CIB
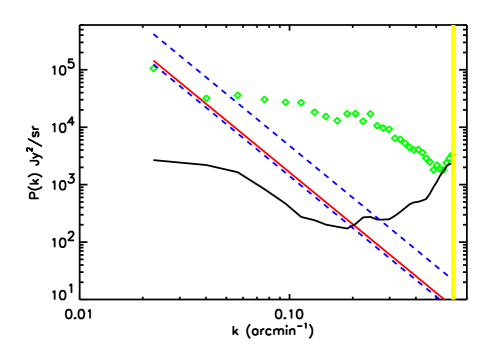
Sources below the detection limit of a survey create fluctuations. If the detection limit does not allow to resolve the sources dominating the CIB intensity, which is the case in the FIR with ISO, characterizing these fluctuations gives very interesting information on the spatial correlations of these unresolved sources of cosmological significance. An example of the modeled redshift distribution of the unresolved sources at 170 can be found in Fig. 12 of Lagache et al (2002); the sources dominating the CIB fluctuations have a redshift distribution peaking at . After the pioneering work of Herbstmeierer al (1998) with ISOPHOT, Lagache & Puget (2002) discovered them at 170 in the \objectFIRBACK data, followed by other works at 170 and 90 (Matsuhara et al., 2000; Puget & Lagache, 2000; Kiss et al, 2001). Fig. 6 shows the CIB fluctuations in the FN2 field by Puget & Lagache, (2000), at wavenumbers arcmin-1.
4 MODELS
ISO provided high quality data, taken in the frame of the cosmological survey programs, as well as nearby galaxies or serendipitous programs. The first observable to be widely used as a constraint on the models is the source counts at 15 and 170 , but also at 7 and 90 . The redshift distributions, mainly at 15 (and soon at 170 ) put additional constraints, as well as a better knowledge of the nature of the galaxies: AGN vs Starburst, luminosities, star formation rate. The global star formation rate, as derived in part from ISOCAM data, adds other constraints to the models. Finally, a few models use explicitly the constraint of the level of the CIB fluctuations in the far infrared.
These observables and constraints induced a burst in the development of new models in the late nineties, among which: Roche & Eales (1999), Tan et al. (1999), Devriendt & Guiderdoni (2000), Dole et al. (2000), Wang (2000), Chary & Elbaz (2001), Franceschini et al. (2001), Malkan & Stecker (2001), Pearson (2001), Rowan-Robinson (2001), Takeuchi (2001), Xu et al. (2001), Balland et al. (2002), Lagache et al. (2002), Totani & Takeuchi (2002), Wang (2002). This development was also made possible because of the better knowledge of the galaxies SED in the infrared (e.g. Dale et al., 2000; Helou et al., 2000; Lutz et al., 2000; Stickel et al., 2000, Tuffs & Popescu, 2002), with the availability of the SED of the CIB (Gispert et al., 2000; Hauser & Dwek, 2001), and of complementary data sets (X-rays, optical, NIR, submm, radio).
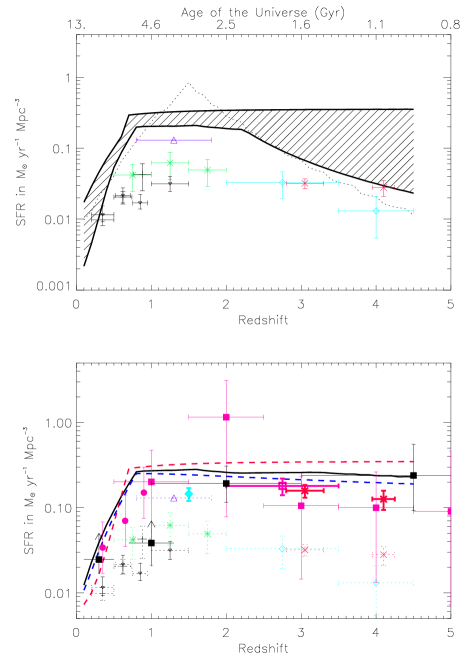
Even if there is no unique scenario reproducing all the observables, the models help now to have a more coherent picture of galaxy evolution. It is beyond the scope of this paper to review the models and their predictions, we thus give here only two examples. Fig. 7 shows the observed source counts at 15, 60, 170 and 850 and the fits by Lagache et al (2002). Using other kind but similar evolutions (pure density and pure luminosity evolutions in addition to the density+luminosity evolution), Chary & Elbaz (2001) predict the star formation rate and compare it with data and Xu et al (2001) (Fig. 8). Combined with the different approach of Gispert et al (2000), the SFR is well constrained in the redshift range .

5 POTENTIAL OF ISO DATA
Even if the ISO data led to an impressive scientific return with a high efficiency (about 62% of the data are published) in the field of the cosmological evolution of the galaxies, many other results are still to come, based on the amount of unpublished data available in the archive.
In addition, new techniques of data reduction are now available, thanks to a better understanding of detector behaviors, both for the Silicon Array (CAM)(Coulais & Abergel, 2000; Miville-Deschênes et al., 2000; Lari et al., 2001, 2002; Vaccari, 2002) and the Germanium detectors (PHOT) (Coulais et al., 2000). Processing unpublished data and/or reprocessing published data allows us to reach better sensitivity levels with a higher confidence (e.g. for ISOCAM HDF-N: Serjeant et al., 1997; Aussel et al., 1999; Désert et al., 1999. E.g. for ISOPHOT Lockman Hole: Kawara at al., 1998; Rodighiero et al., 2002).
Concerning the CIB and the cirrus foreground, a brilliant example of what can be done from the archive is the work of Kiss et al (2001,2002), detailed in this conference. Furthermore, the ISO data may induce discoveries in other data sets. A recent example concerns the fluctuations of the CIB in the far infrared. Lagache & Puget (2000) and Puget & Lagache (2000) measured the level of the fluctuations of the CIB at in the FIRBACK fields. Given the SED of the CIB, it was possible to predict the fluctuation level at 60 and 100 (e.g. Lagache, Dole, Puget, 2002), and show that this might be detectable in the IRAS data. As a consequence, Miville-Deschênes et al. (2002) recently reported the first detection of the CIB fluctuations at 60 and 100 in the IRAS data.
6 THE NEXT STEPS: SIRTF AND BEYOND
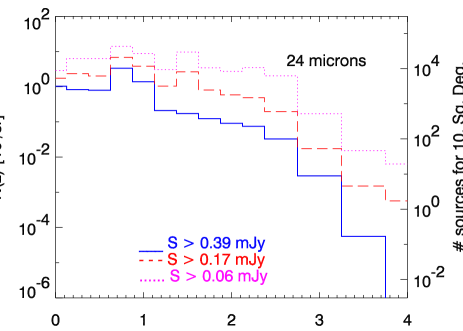
SIRTF, the Space Infrared Telescope Facility, to be launched in early 2003, is expected to improve our view of the IR universe over the next five years, thanks to the recent technological developments in IR detector arrays. A number of multiwavelength cosmological surveys are scheduled with MIPS (Multiband Imaging Photometer for SIRTF) at 24, 70 and 160 (Dole et al., 2003111see also http://lully.as.arizona.edu) and IRAC (Infrared Array Camera) at 3.6, 4.5, 5.8 and 8.0 . In the frame of the Guaranteed Time (GTO) or Legacy (GOODS and SWIRE) Surveys, about 80 Sq. Deg. will be observed at different depths. Probing the properties of the galaxies with samples of statistical significance up to redshifts of 2.5 or more will be possible. Fig. 9 (from Dole et al, 2003) shows predictions of the redshift distribution at 24 for MIPS surveys.
The next steps after ISO and SIRTF for understanding the infrared and submillimeter Universe from space will be ISAS’s ASTRO-F in 2004, ESA’s Herschel & Planck (around 2007), and NASA’s NGST (around 2010+), in addition to the ground-based ALMA (from 2005). These telescopes are the promise for a lot of exciting science to be done (at least) in the next 15 years !
Acknowledgements.
I warmly acknowledge the organizers for having invited me to give this review at this very interesting and enjoyable conference (especially for the tapas, the hot chocolate around the San Juan bonfire, and the cultural wonders). I also acknowledge the Programme National de Cosmologie and the Centre National d’Etudes Spatiales (CNES) for travel support for the work with my collaborators in France, and the funding from the MIPS project, which is supported by NASA through the Jet Propulsion Laboratory, subcontract # P435236.References
- [] Altieri B., Metcalfe L., Kneib J-P. et al., 1999, A&A, 343, L65
- [] Aussel H., Cesarsky C.J., Elbaz D., et al., 1999, A&A, 342, 313
- [] Balland C., Devriendt, J., Silk J., 2002, MNRAS, Submitted, astro-ph/0210030
- [] Bertin E., Dennefeld, M. & Moshir, M., 1997, A&A, 323, 685
- [] Casoli F., Lequeux J., David F., Eds, ’Infrared Space Astronomy, Today and Tomorrow’, Les Houches Summer School LXX, EDP Sciences, Springer-Verlag, 2000
- [] Cesarsky C., Abergel, A., Agnese P., et al., 1996, A&A, 315, L32
- [] Chapman, S. C., Smail I., Ivison R., et al., 2002, ApJ, 573, 66
- [] Chary R., & Elbaz D., 2001, ApJ, 556, 562
- [] Ciliegi P., McMahon R. G., Miley G., et al., 1999, MNRAS, 302, 222
- [] Clements D., Desert F-X., Franceschini A., et al., 1999, A&A, 346, 383
- [] Coulais A., & Abergel A., 2000, A&AS, 141, 533
- [] Coulais A., Fouks B. I., Giovannelli J. F., et al., 2000, A&A, SPIE
- [] Dale D., Silbermann, N., Helou, G., et al., 2000, AJ, 120, 583
- [] Désert F-X., Puget J-L., Clements D., et al., 1999, A&A, 342, 363
- [] Devriendt J.& Guiderdoni B., 2000, A&A, 363, 851
- [] Dole H., Gispert R., Lagache, G., et al., 2000, Springer Lect. Notes in Ph., v548, 54, astro-ph/0002283
- [] Dole H., Gispert R., Lagache, G., et al., 2001, A&A, 372, 364
- [] Dole H., Lagache G., Puget J-L., 2003, ApJ, in press, astro-ph/0211312
- [] Efstatiou A., Oliver S., Rowan-Robinson M., et al., 2000, MNRAS, 319, 1169
- [] Elbaz D., Cesarsky C., Fadda D., et al., 1999, A&A, 351, L37
- [] Elbaz D., Flores H., Chanial P., et al., 2002, A&A, 384, 848
- [] Ellis R. S., 1997, ARAA, 35, 389
- [] Flores H., Hammer F., Thuan T. X., et al., 1999, ApJ, 517, 148
- [] Franceschini A., Aussel H., Cesarsky C., et al., 2001, A&A, 378, 1
- [] Genzel R., & Cesarsky C., 2000, ARAA, 38, 761
- [] Gispert R., Lagache G., Puget J-L., 2000, A&A, 360, 1
- [] Gruppioni C., et al, 2002, MNRAS, 335, 831
- [] Guiderdoni B., Bouchet F. R., Puget J-L., et al., 1997, Nature, 390, 257
- [] Hauser M.,& Dwek E., 2001, ARAA, 37, 249
- [] Helou G., Lu N. Y., Werner M. W., et al., 2000, ApJ, 532, L21
- [] Herbstmeierer U., Abraham P., Lemke D., et al., 1998, A&A, 332, 739
- [] Juvela M., Mattila K., Lemke D., 2000, A&A, 360, 813
- [] Kakazu Y., Sanders D., Jpseph R., et al., 2002, A&A, IAU184, astro-ph/0201326
- [] Kawara K., Sato Y., Matsuhara H., et al., 1998, A&A, 336, L9
- [] Kiss C., Abraham P., Klaas, U., et al., 2001, A&A, 379, 1161
- [] Kiss C., et al., 2002, this conference
- [] Lagache G. & Puget J-L., 2000 , A&A, 355, 17
- [] Lagache G. & Dole H., 2001, A&A, 372, 702
- [] Lagache G., Dole H., Puget J-L., 2002, A&A, MNRAS, in press, astro-ph/0209115
- [] Lari C., Pozzi F., Gruppioni C., et al., 2001, A&A, 325, 1173
- [] Lari C., et al., 2002, this conference
- [] Lemke D., Klaas U., Abolins J., et al., 1996, A&A, 315, L64
- [] Linden-Voernle M. J. D., Norgaard-Nielsen H. U., Jorgensenet H. E., al., 2000, A&A, 359, L51
- [] Lutz D., 2000, New As. Rev., 44, L241
- [] Malkan M., & Stecker F., 2001, ApJ, 555, 641
- [] Matsuhara H., Kawara K., Sato Y., et al., 2000, A&A, 361, 407
- [] Miville-Deschênes M-A., Boulanger F., Abergel A., et al., 2000, 146, 519
- [] Miville-Deschênes M-A., Lagache G., Puget J-L., 2002, 393, 749
- [] Oliver S., Rowan-Robinson, M., Alexander D., et al., 2000, MNRAS, 316, 749
- [] Oliver S., Mann R. G., Carballo R., et al., 2002, MNRAS, 332, 536
- [] Patris J., Dennefeld M., Lagache G., et al., 2002, A&A, submitted
- [] Pearson C., 2001, MNRAS, 325, 1511
- [] Puget J-L., Abergel A., Bernard J-P., et al., 1996, A&A, 308, L5
- [] Puget J-L., Lagache G., Clements D., et al., 1999, A&A, 345, 29
- [] Puget J-L.,& Lagache G., 2000, A&A, IAU204, astro-ph/0101105
- [] Roche N., & Eales S., 1999, MNRAS, 307, 111
- [] Rodighiero G., et al., 2002, this conference
- [] Rowan-Robinson M., 2001a, New As. Rev., 45, 631
- [] Rowan-Robinson M., 2001b, ApJ, 549, 745
- [] Serjeant S., Eaton N., Oliver S., et al., 1997, MNRAS, 289, 457
- [] Serjeant S., Oliver S., Rowan-Robinson M., et al., 2000, MNRAS, 316, 768
- [] Serjeant S., Efstathiou A., Oliver S., et al., 2001, MNRAS, 322, 262
- [] Stickel M., Bogun S., Lemke D., et al., 1998, A&A, 336, 116
- [] Stickel M., Lemke D., Klaas U., et al., 2000, A&A, 359, 865
- [] Takeuchi T., Ishii T., Hirashita H., et al., 2001, PASJ, 53, 37
- [] Tan J., Silk J., Balland C., 1999, ApJ, 522, 579
- [] Taniguchi Y., Cowie L., Sato Y., et al., 1997, A&A, 328, L9
- [] Totani T., & Takeuchi T., 2002, ApJ, 570, 470
- [] Tuffs R., & Popescu C., 2002, this conference
- [] Vaccari M., et al., 2002, this conference
- [] Xu C., Lonsdale C., Shupe D., et al., 2001, ApJ, 562, 179
- [] Wang Y., Biermann P., 2000, A&A, 356, 808
- [] Wang Y., 2002, A&A, 383, 755