Cool bottom processes on the thermally-pulsing AGB and the isotopic composition of circumstellar dust grains
Abstract
We examine the effects of cool bottom processing (CBP) on the isotopic ratios 18O/16O, 17O/16O, 14N/15N, 26Al/27Al, C/O, and N/O in the convective envelope during the thermally-pulsing asymptotic giant branch (TP-AGB) phase of evolution in a 1.5 initial-mass star of solar initial composition. We use a parametric model which treats extra mixing by introducing mass flow between the convective envelope and the underlying radiative zone. The parameters of this model are the mass circulation rate () and the maximum temperature () experienced by the circulating material. The effects of nuclear reactions in the flowing matter were calculated using a set of static structures of the radiative zone selected from particular times in a complete stellar evolution calculation. The compositions of the flowing material were obtained and the resulting changes in the envelope determined. No major shifts in the star’s energy budget occur from the imposed CBP if . Using structures from several times on the TP-AGB, it was found that the results for all species except 26Al were essentially independent of the time chosen if . Abundant 26Al was produced by CBP for . While 26Al/27Al depends on , the other isotopic ratios depend dominantly on the circulation rate. The relationship is shown between models of CBP as parameterized by a diffusion formalism within the stellar evolution model and those using the mass-flow formalism employed here. They are shown to be effectively equivalent. In general, the CBP treatment readily permits calculation of envelope compositions as affected by different degrees of extra mixing, based on stellar structures computed by normal stellar evolution models. Using these results, the isotopic ratios under conditions of C/O and C/O are compared with the data on circumstellar dust grains. It is found that the 18O/16O, 17O/16O, and 26Al/27Al observed for oxide grains formed at C/O are reasonably well-understood. However, the 15N/14N, 12C/13C, and 26Al/27Al in carbide grains (C/O) require that many of their stellar sources must have had 14N/15N at least a factor of 4 lower than the solar value. This allows a self-consistent description of all these isotopes in most SiC grains. The rare grains with 12C/13C cannot be produced by any red-giant or AGB source, nor are they reconcileable with novae sources.
1 Introduction
The purpose of this study is to explore the effects of an extra circulation process on the 26Al/27Al, 17O/16O, 18O/16O, and 13C/12C ratios in the envelope of an AGB star of solar metallicity. By an extra circulation process we mean the transport of matter from the fully convective envelope into the underlying radiative region, down to the outer parts of the H-burning shell. The actual physical-dynamical basis for such penetration is not known. However, the requirement that some such mechanism must sometime occur has been amply demonstrated by observations on RGB stars and in studies of dust grains which formed in circumstellar envelopes (e.g. Huss et al. 1994; Boothroyd, Sackmann & Wasserburg 1994; Harris, Lambert & Smith 1985; Kahane et al. 1992). The isotopic effects of such extra transport on the abundances depend only on the degree of nuclear processing. This is directly related to the nuclear reaction rates, the rate of mass transfer and the depth to which the extra mixing mechanism penetrates. A detailed physical fluid-dynamical mechanism can not significantly affect the resulting abundances beyond determining the rate and depth. It is clear that any extra mixing mechanism that does not fractionate one set of elements relative to the other elements involved in the nuclear reactions will not change the resulting products that are added to the envelope from what is found here. The issue of how small amounts of extra mixing will change the stellar evolution is not known but will be commented on. The results, presented here with inter-relationships between the different isotopic ratios, are of use in discussing and understanding isotopic results obtained by extensive studies of recovered circumstellar dust grains. Insofar as a relationship may be found between the isotopic ratios listed above and the ratios of major elements in the AGB envelope (C/O and N/O), this may lead to understanding the chemical-physical origins of the grains and the nature of the stars around which they formed. Such results may also be of value in understanding the compositions of planetary nebulae.
It has been proposed that many short-lived nuclei present in the early solar system (ESS) were the products of an AGB star that injected freshly-synthesized nuclei into the interstellar medium (ISM) from which the solar system formed (Wasserburg et al. 1994). Because AGB stars are the site of -process nucleosynthesis, there is a rather thorough understanding of the yields of a large number of nuclides in their convective envelopes (cf. Busso, Gallino & Wasserburg 1999, hereafter BGW99). Among these nuclides, 26Al plays a critical role in evaluating the hypothesis that an AGB star supplied short-lived nuclei to the early solar system. While it is clear that 26Al should be produced in AGB stars by the reaction 25Mg()26Al (Forestini, Arnould & Paulus 1991; Mowlavi & Meynet 2000; Lattanzio, Forestini & Charbonnel 2000), the quantitative 26Al yield, taking into account the complexities of destruction of this nuclide, remains very uncertain. As shown by Wasserburg et al. (1994) and BGW99, 26Al is produced efficiently in the hydrogen shell, but most () of this is mixed into the He shell at the onset of intermittent He shell burning. The mixed material is then exposed to neutrons in the convective (He-burning) region formed during the He-burning pulse, where 80% to 100% of its 26Al content is consumed by the reaction . The neutrons that destroy 26Al are provided by the process , activated marginally in the relatively high temperatures ( K) of the thermal pulse. A value of 26Al/27Al ( number ratio) results in the envelope after mixing and is much less than the amount initially produced in the hydrogen shell. This is a factor of a few less than required if a single AGB star produced the 26Al and this material was then diluted to provide the amount found in the early solar system (26Al/27Al; Lee, Papanastassiou & Wasserburg 1977; Wasserburg et al. 1994, 1995). Although the discrepancy might be explained by a relatively small change in the fraction of 26Al destroyed (i.e., a small variation in the rate), the estimated 26Al yield is at best in marginal agreement with the yield required to provide the solar inventory. If the true yield is lower than , then an AGB source for solar 26Al is not reasonable. There is at present no way to improve the estimated 26Al yield. Mowlavi & Meynet (2000) recently carried out an extensive analysis of 26Al production in AGB stars. They explored the effects of recently-revised reaction rates, and computed the yields expected at varying metallicities and initial masses. The results of this work agree with the above expectations: normal, low-mass AGB stars were found to be probable sources of 26Al abundances observed in most (not all) SiC grains, with 26Al/27Al values in the same range discussed above. Mowlavi & Meynet also found more efficient production of 26Al in intermediate mass stars (hereafter IMS) experiencing hot bottom burning (HBB). This process was studied extensively by Frost et al. (1998), Lattanzio & Forestini (1999), and Lattanzio et al. (2000). However, uncertainties in the final fates of these stars (mainly in the number of thermal pulses experienced) prevent a quantitative estimate of their possible contributions to the ISM and to the Galactic inventory.
A direct challenge to standard AGB models arises from the discovery of circumstellar oxide grains recovered from meteorites, on which rather precise isotopic ratios are measured. Many of these grains reflect 26Al/27Al at their formation far above . Some oxide grains also have 18O/16O about 30% less than the solar value and 17O/16O much greater than the solar value. These oxygen data were interpreted to reflect stellar first dredge-up (e.g., Huss et al. 1994, Boothroyd, Sackmann & Wasserburg 1994). Studies by Nittler et al. (1994,1997) and Choi, Wasserburg & Huss (1999) found some oxide grains with very low or essentially no 18O. It was shown that such low 18O/16O could result from HBB (Boothroyd, Sackmann, & Wasserburg, 1995), but only in stars with masses . However, the data on many oxide grains were found to lie in a region of the 17O/16O and 18O/16O diagram that is not accessible by HBB. Direct observations of oxide molecules in the photospheres of some red giants had for some time indicated similar oxygen isotopic compositions, albeit with very large uncertainties (Harris, Lambert & Smith 1985; Harris et al. 1987). Similar modifications of oxygen isotopes were subsequently confirmed with a higher level of confidence in circumstellar envelopes (Kahane et al. 1992).
Discrepancies between oxide grain compositions and the compositions that result from simple dredge-up in low-mass stars were explained by the hypothesis of extra mixing of material through the zone of radiative energy transport above the hydrogen shell – referred to as “deep mixing” or “cool bottom processing” (CBP). Such a mixing process is not treated quantitatively in any stellar model with a stable and totally non-circulating radiative zone, but it cannot be ruled out on physical grounds; this extra mixing has been suggested by many authors (see below). Several abundance peculiarities besides the oxygen problem are explained by introducing CBP during at least the red giant branch (RGB) phase of evolution. Specifically, observed patterns of 7Li production and destruction, and of 13C production on the RGB require CBP (Gilroy & Brown 1991; Charbonnel 1995; Boothroyd & Sackmann 1999; Gratton et al. 2000). CBP also explains the evolution in time of the carbon isotope abundances along the RGB (Denissenkov & Weiss, 1996; Cavallo, Sweigart & Bell 1998). The actual mechanism that causes this mixing is not known. It is often ascribed to the shear instability in differentially rotating stars (Zahn 1992; Maeder & Zahn 1998), but other mechanisms, such as meridional circulation and convective overshoot (Sweigart & Mengel 1979; Herwig et al. 1997 and references therein), are available and equally likely. The specific mechanism will determine the actual depth and rate of mixing, but should not otherwise matter.
Deep mixing processes were shown to be especially important in low-metallicity stars, where deep mixing may involve relatively hot H-burning cycles. CBP was therefore suggested (e.g. by Langer, Hoffman & Sneden 1993, Weiss, Denissenkov & Charbonnel 2000) as an explanation for a collection of CNO, Ne-Na and Mg-Al anomalies observed in low-metallicity stars (reviewed in e.g. Kraft 1994, Da Costa 1998). These studies showed that when CBP becomes deep enough to involve the H shell itself, the stellar evolution is significantly altered by extensive He enrichment of the envelope (Sweigart 1997). Denissenkov & Weiss (2001), investigating elemental abundance anomalies in the globular clusters Cen and M4, found that at least some of the observed variations in [Al/Fe] could result from CBP occurring in RGB stars. These workers used a diffusive model of extra mixing with rate and depth of mixing determined to fit observational trends. They demonstrated the possibility of 26Al production in RGB stars undergoing CBP, at least in low-metallicity stars and with particular parameters. Very recently, observations of planetary nebulae were shown to require further addition of CN-cycle products into the envelope during the third dredge-up phase, even in stars with masses that are too low to permit HBB (Péquignot et al. 2000). The destruction of 3He that should accompany CBP would also help explain the apparently weak evolution of the Galactic 3He abundance since the big bang (Wasserburg, Boothroyd & Sackmann 1995; Balser et al. 1998; Gloeckler & Geiss 1998; Bania, Rood & Balser 2002).
For all the above reasons, CBP is now generally accepted as a significant process occurring in a second mixing episode late in the evolution of red giants (see e.g. Boothroyd & Sackmann 1999; Gratton et al. 2000). The main restriction on CBP is that there be no abrupt increase in mean molecular weight anywhere between the convective envelope and the hydrogen shell to prevent mixing (Charbonnel, Brown & Wallerstein 1998; Boothroyd & Sackmann 1999). This condition is known to be satisfied in stars on the RGB, at luminosities above that of the “bump” in the RGB luminosity function. It should also be satisfied throughout the subsequent AGB phase – and certainly during the thermally-pulsing AGB (TP-AGB) phases – for all low-mass stars. From all these considerations CBP therefore appears to be both possible and necessary in the evolution of low-mass stars.
2 The Model
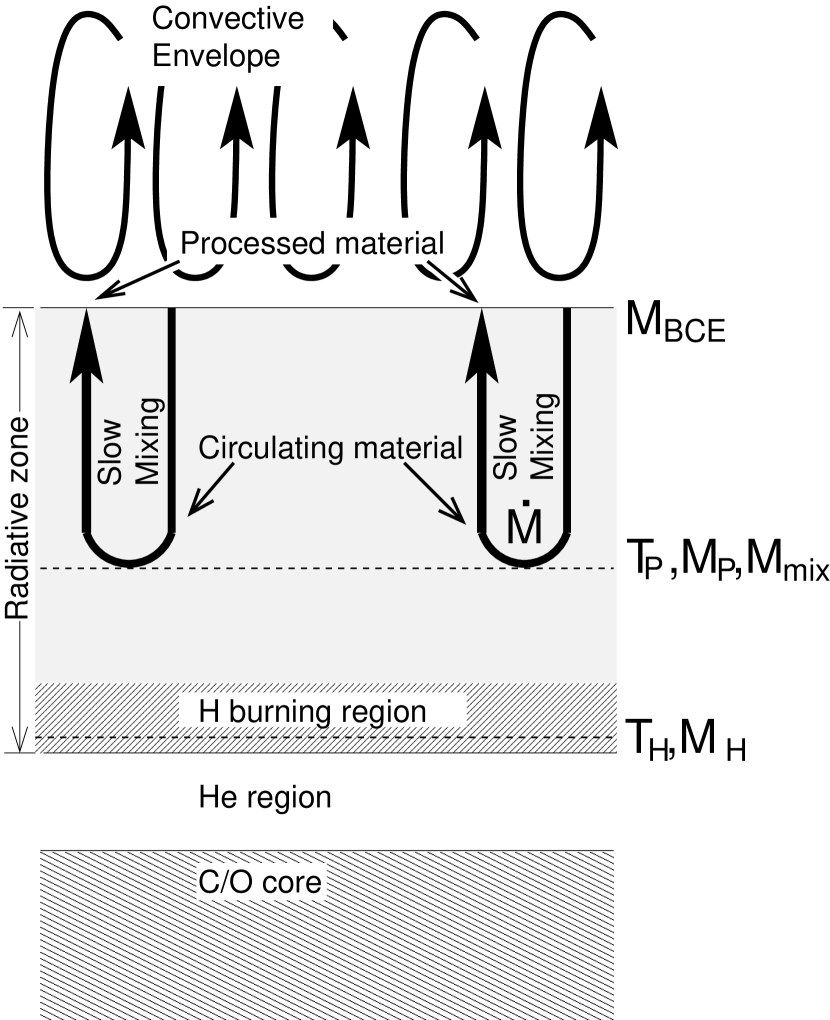
The general structure and evolution of AGB stars have been studied extensively (for a thorough introduction see Lattanzio 2001111John Lattanzio’s online stellar evolution tutorial available at http://www.maths.monash.edu.au/ johnl/stellarevoln/.). The structure of a low-mass star during this phase of evolution is schematically as follows (see Fig. 1): in the center is a degenerate carbon/oxygen core. Outside this is a helium region which cannot support steady nuclear burning. The next layer is a thin () region where hydrogen burning takes place, providing essentially all of the star’s luminosity. The outward advance of the H shell adds to the He region, which periodically undergoes nuclear burning (“thermal pulses”) in short ( yrs) bursts separated by long ( yrs) intervals. The H shell and the region immediately above it ( in total) are stable against convection, and we call these together the “radiative zone.” Finally, the outer region of the star is a large, fully convective envelope. When mass loss is included as described below, this envelope has mass at the start of the TP-AGB and shrinks as the H shell advances outward and as the star sheds envelope material in a wind. Late in the AGB evolution, each thermal pulse is followed by a brief disruption of the structure just described, during which material that has seen nuclear processing in the H and He shells is mixed into the envelope. This mixing is called “third dredge-up” (see review by BGW99). In the above description, the radiative zone contains no circulation. We will treat the problem of extra mixing following Wasserburg, Boothroyd & Sackmann (1995; hereafter WBS). Here a slow circulation is added by imposing transport of envelope material at a mass flow rate down to some depth inside the radiative zone specified by temperature and then back to the envelope. Typically, a small amount of nuclear processing takes place in the circulating material.
We use a numerical model of an AGB star with solar initial composition and 1.5 initial mass. The model was computed by Straniero et al. (1997) using the FRANEC code to follow the full evolution of the star from the zero-age main sequence through the TP-AGB phase, with no mass loss. The corresponding loss of envelope mass was subsequently computed using the Reimers (1975) prescription as discussed by Busso et al. (2001). The choice for the free parameter of the Reimers formula was adopted. Details of the mass loss and dredge-up are relatively unimportant for our conclusions: runs of the code at a fixed envelope mass of 0.5 produced the same results to , and variations in dredge-up efficiency will be discussed below. The detailed evolution on the AGB of the above model is summarized in Fig. 2 and Table 1. We will refer to the detailed structure and evolution of this model, including both dredge-up and mass loss, as the stellar evolution model, SEM(1.5). For our calculations, we assume that extra mixing may be modelled by studying circulation inside the radiative-zone structures previously computed in the SEM(1.5) model. The nuclear processing in CBP depends mainly on the variation of temperature and density as functions of position within these radiative-zone structures, and of time . These structures are the environment within which the circulating material moves and is processed. The SEM(1.5) model also provides us with the timescales for AGB evolution, the rate of mass loss from the envelope, and the changes to envelope composition due to third dredge-up (TDU). The SEM(1.5) model exhibits TDU after the 10th thermal pulse, and after each subsequent thermal pulse until the 26th (the interval from Stage 5 to Stage 6 in Fig. 2 and Table 1; two subsequent pulses produce negligible dredge-up). This dredge-up brings large quantities of newly-produced carbon and of s-process nuclides to the envelope, and as a result, the envelope of SEM(1.5) with no CBP has C/O from the 22nd pulse onward. The envelope begins CBP with a composition reflecting earlier first dredge-up, as discussed below for individual nuclides.
It is useful in discussing CBP to distinguish between three types of material. “Envelope material” (E) makes up the convective envelope and has abundance (in moles per gram) of nuclide . “Circulating material” (C) is that material moving through the radiative zone. It starts out as a representative sample of the envelope at a given time, and then moves down through the radiative zone and back as shown in Fig. 1. Abundances in the circulating material are changed by and reactions, as well as beta decays along the flow path. The circulating material just before returning to the envelope is the “processed material” (P), with composition denoted . We assume that mixing of processed material with the convective envelope is instantaneous.
The numerical CBP model follows the envelope abundances as material descends into the radiative zone and is replaced by newly-processed material. This corresponds to integrating
| (1) |
as , , and evolve together. The quantity is computed by following the position of a parcel of material as it starts at the bottom of the envelope, circulates downward through the SEM(1.5) stellar structure, and finally returns to the envelope with composition . The stellar structure and specify as functions of time the conditions of and seen by this material, and the numerical code integrates a nuclear reaction network (rates from Angulo et al. 1999; discussed in Appendix A) with these changing conditions. We do not calculate the detailed evolution by following every detail of development of the radiative zone with time. For a given calculation, we choose one of the times from the SEM(1.5) evolution listed in Table 1 (we call this a “stage”), and we hold the radiative-zone structure constant as specified by this stage. This amounts to an approximation that the processing is independent of the evolution of the radiative zone for the duration of CBP. A check of this assumption is given in Sec. 3. We consider the dominant extra processing to take place when the H shell temperature (defined as the temperature where the maximum energy generation takes place) exceeds and when TDU is active. This is restricted to the last yrs of AGB evolution of the 1.5 star. When considering CBP during the interval between Stages 5 and 6, we use the radiative-zone structure from Stage 5, and we include TDU by interrupting the evolution at the times of the thermal pulses and altering the envelope abundances to reflect dredge-up as computed for SEM(1.5). The CBP code is re-started after each pulse with the new composition as the intial state. We refer to the results of this calculation as the “numerical model.” We will also present analytical arguments to interpret the output. After an initial examination of the conditions necessary for 26Al production and incorporation into grains, we confine ourselves to evolution from Stage 5 to Stage 6, when TDU is active, and we use the radiative-zone structure from Stage 5. All of the results from the numerical model shown in the figures correspond to these calculations.
A fully self-consistent model of CBP using this “conveyor belt” model would involve calculating the abundances of the nuclides in the envelope at all times and following the evolution of stellar structure as conditions in the radiative zone change, as the H-shell advances into regions that have been processed by CBP, and as dredge-up and mass loss change the envelope. The most extreme assumption that we have made is that a radiative-zone structure from a fixed time provides a reasonable approximation to the radiative-zone structure for the next few yrs. We find below that this is true during the TP-AGB (excluding very brief interruptions by thermal pulses), and that C, N and O isotopes are insensitive to the specific radiative-zone structure chosen. We will show that for 26Al there is a strong dependence on this structure, dominantly due to the evolving . It will be shown that there are nonetheless clear general rules for 26Al that adequately describe the system. Note that the conditions of and in the envelope play no role in this problem as no nuclear processing occurs there.
The radiative zone is only thick at Stage 5, so if the envelope has a convective overturn time of yr, and the radiative zone turns over much less frequently than the envelope, then /yr, roughly. The other important constraint is that stellar energy generation not be disrupted too much, or approximately that . In principle, does not completely specify the speed of matter circulation. The speeds of the upward and downward streams may be expressed as in WBS by and , respectively the fraction of the area at fixed radius occupied by the upward and downward streams. We have fixed both parameters at , and they will not have any significant effect for fixed (see WBS). For each calculation we fix a value of and a maximum depth of penetration in the radiative zone corresponding to a temperature . There are no other independent parameters in the calculation.
2.1 26Al
We first consider 26Al which is the simplest case. The long-lived ground state of 26Al is produced in the circulating material by the process and destroyed by . The 26Al abundance in a sample of circulating material starts with the current composition of the envelope and then evolves during the time that it circulates through the radiative zone according to
| (2) |
where for the reaction labeled “rxn”, is mass density, Avogadro’s number, the thermally-averaged reaction rate, the 25Mg abundance, and the hydrogen abundance. The quantities on the right-hand side of this expression evolve as the material’s position in the radiative zone changes. The destruction term is negligible for two reasons: 1) for the presently-recommended rates (Appendix A and Angulo et al. 1999), the destruction cross section is two orders of magnitude smaller than the production cross section, and 2) never builds up to a level comparable to . The rate of 26Al decay during the time spent circulating through the radiative zone is negligible.
For most values of and for , the 26Al production rate is low enough that only a small fraction of the 25Mg burns on a single pass through the radiative zone. As a result, is almost constant, and the amount of 26Al in the processed material is approximately
| (3) | |||||
| (4) |
where we have taken advantage of the relationship between and the time-dependent position of the circulating matter to write the integral in mass coordinates with no explicit reference to time. is where and is the bottom of the convective envelope (see Fig. 1) – the time integral begins at the time when the circulating material leaves the envelope and ends at time when it returns to the envelope. (The factor of 2 arises because the circulating material passes each point twice: once on the way down, and once on the way back up.) Note that does not change with time, except to the extent that stellar evolution changes the path integral.
The abundance of 26Al in the envelope reflects the addition of processed material with the 26Al abundance to the envelope of mass , competing against free decay with mean lifetime yr and removal of material into the downward stream:
| (5) | |||||
| (6) | |||||
| (7) |
where the last two lines define the production rate per unit mass of the envelope. Note that all factors of have cancelled: the amount of processed material is proportional to , but the time it spends at high temperature is proportional to . If the envelope mass decreases with time and the reaction path integral over the circulation stays constant, then will increase with .
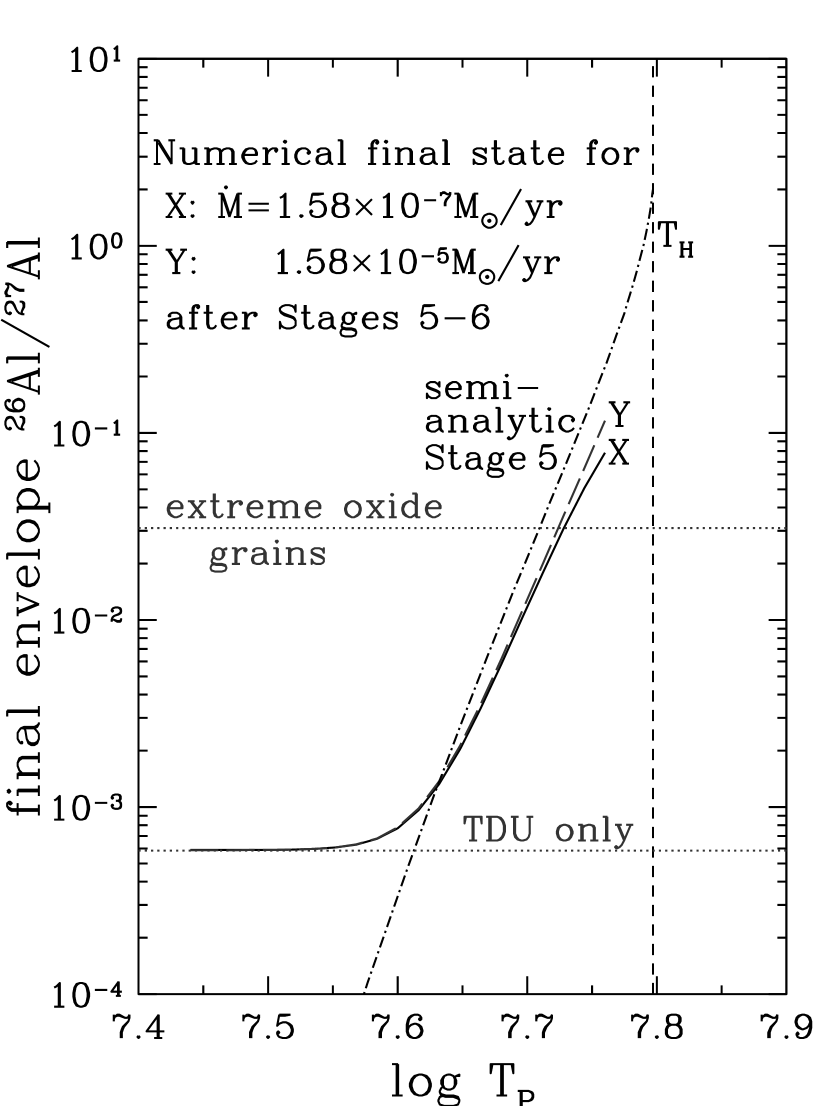
Calculations were done in the numerical model using the radiative-zone structure of Stage 5, with CBP occurring roughly for the duration of third dredge-up (from Stage 5 until Stage 6). The results for 26Al are shown in Fig. 3a as a function of . During this interval, 26Al/27Al is added gradually by normal third dredge-up, and this amount is shown as the “TDU only” line. As argued above (cf. Eqn. 6), there is no significant dependence on . We see that for (0.2 dex below ) there is no significant 26Al production. The term rises almost linearly with as increases toward . It is evident that CBP penetrating to temperatures above K during this phase of evolution can readily produce 26Al/27Al as high as found in extreme examples of circumstellar oxide grains.
In order to understand these numerical results, we consider analytic solutions to the approximate expression in Eqn. 6. Table 1 and Fig. 2 show the selected stages of AGB evolution on which we will now focus. Time zero is taken as the state when He core burning is just finished, and qualitative descriptions of the evolutionary stages are given in Table 1 along with characteristic parameters of the radiative zone. For the semi-analytic treatment, we neglect mass loss and dredge-up, and we assume that the stellar structure (i.e., the structure at a selected stage from Table 1) does not change with time. Using the solution to Eqn. 7 for a constant-mass envelope and a selected time-independent radiative-zone structure, we obtain
| (8) |
Let us now consider the steady-state abundance of 26Al that could be achieved in an AGB star fixed at the structure from a particular evolutionary stage. The results for Stage 5 are shown in Fig. 3a and are in good agreement with the corresponding numerical calculation. We consider the following additional times in the evolution: 1) The stellar structure at the immediate end of core He burning; 2) the middle of the early AGB; 3) just before the first thermal pulse; 4) just after the second mild pulse, etc.; and finally 6) just before the twenty-sixth thermal pulse (see Table 1 and Fig. 2). The 26Al/27Al ratios at steady state () for each of these stellar stages are shown in Fig 3b. There is no dependence on because of the cancellation noted above. The end points of the curves correspond to the extreme limiting case of . By the onset of the first thermal pulse, the production rates rise rapidly and 26Al production is possible only at these late stages. The critical parameter is , which is not a priori known. Values of are required to produce substantial amounts of 26Al. Inspection of Fig. 3b shows that to achieve the same value of 26Al/27Al requires different in for each choice of stellar structure (e.g., 26Al/27Al requires at Stage 3, 7.68 at Stage 4, 7.72 at Stage 5, and 7.73 at Stage 6). However, if we had chosen constant for each of the last three stages rather than fixing , then the 26Al/27Al production rate would be approximately constant. (See section 3 below.)
| Stage | Start Time (Myr) | Description | () | ||
|---|---|---|---|---|---|
| 1 | 0 | end core He burn | 7.423 | 0.376 | 0.587 |
| 2 | before H-shell re-ignition | 7.456 | 0.0329 | 0.900 | |
| 3 | before 1st pulse | 7.679 | 0.862 | ||
| 4 | after 2 mild pulses | 7.740 | 0.887 | ||
| 5 | before 10th pulse (start TDU) | 7.797 | 0.741 | ||
| 6 | after 26th pulse (end TDU) | 7.834 | 0.242 |
In general, high levels of 26Al/27Al can be achieved by CBP, essentially independent of , but completely dependent on . Thus, 26Al/27Al is a measure of the depth of penetration, independent of . Significant 26Al production can occur over all the late stages, but we expect it to be dominated by production over the last of time before the envelope is lost. It can be seen in Fig. 3a that the numerical model is very close to the simple analytical calculation. Most of the small discrepancy arises because the TDU period lasts only for yr, not long enough to reach steady state. Overall, the agreement is astoundingly good.
In summary, significant 26Al/27Al can result from CBP late on the AGB. The exact amount of 26Al produced depends on the depth of circulation as expressed by and the duration of CBP (limited by the AGB lifetime), but only very weakly on the circulation rate . To produce 26Al/ just before the star ejects its envelope, it appears necessary that . There is only small 26Al production in the early AGB phase and we infer that this also applies to any CBP during the preceding RGB phase because of the low at that time.
2.2 Oxygen
We now examine the implications for the oxygen isotopes of the conditions that produce 26Al. In contrast to 26Al, 18O is not produced but is destroyed. First dredge-up during the RGB phase provides the envelope with 18O/16O that is decreased from its initial value due to destruction during the main-sequence phase. This has been shown by Dearborn (1992), who recognized the significance of 18O and 17O as indices of interior stellar temperatures and mixing processes. These results have been confirmed by El Eid (1994), Boothroyd & Sackmann (1999), Gallino et al. (1998) and others. In contrast, the isotope 17O is produced in the interior and is then enriched in the envelope above the initial value as a result of first dredge-up. Neither 18O nor 17O is affected by thermal pulses. The major isotope in the envelope, 16O, is essentially unchanged throughout stellar evolution.
The results of the numerical model for 18O/16O and 17O/16O are shown in Figs. 4 and 5 as functions of . The curves show the final envelope composition after using the fixed radiative-zone structure of Stage 5 and processing through the length of the TDU period. Curves for various values of are given. It can be seen that for /yr, there is no substantial change in 18O for all . This is because very little material is processed over the lifetime of the AGB for these mixing rates. For /yr there is a sharp drop-off with a magnitude depending on . For rates above /yr, the destruction is almost complete when . The horizontal parts of the curves at higher are due to a small amount of 18O production balancing the destruction. For 17O there is a rise to higher 17O/16O by a factor of (dependent on ) above the value after first dredge-up. We find that if exceeds a low threshold, the calculation of the final composition as a function of does not change significantly. This threshold is 7.62 at Stage 5 and 7.60 at Stage 3. Therefore, the results are robust and a calculation of the full evolution with continuously changing structure and CBP will not significantly alter the results found here by assuming a fixed radiative zone.
In order to understand the results, we examine the transport equations as was done for 26Al. The basic results can be obtained almost quantitatively from an analytic treatment. As long as , the evolution of 18O in CBP is characterized by rapid destruction. (This applies for Stage 5; other stages are characterized by analogous thresholds, never lower than 7.60 or higher than 7.65.) This destruction occurs via , with 18O abundance in the circulating material evolving according to
| (9) |
(Production via is negligible). The 18O abundance in the processed material returning to the envelope is the time integral of this equation along the entire path taken by the material through the radiative zone, given by
| (10) | |||||
| (11) |
The exponential factor is typically very small for even modest values of ; for example, this expression gives if and /yr using the radiative zone of Stage 5. The result is 18O/16O as low as in the processed material. Higher or lower would further reduce , as would processing slightly earlier in the TP-AGB evolution when the threshold for destruction is lower (analogously with 26Al production). For example, using the radiative zone of Stage 5 with and /yr gives . Using the radiative zone at Stage 3 with /yr, only is needed to produce .
Because 18O destruction in the processed material is so thorough, the envelope abundance of 18O reflects only the removal of envelope material and its replacement with material containing essentially no 18O:
| (12) |
The result is exponential decay of 18O/16O with time, so if is constant,
| (13) |
In this analytical treatment, the destruction of 18O in the processed material is taken to be almost complete. This will apply to all stages of the evolution above the threshold discussed above. Hence the resulting 18O/16O in the envelope at the end of the AGB is given by Eqn. 13 where the only parameters are , and the time scale for AGB evolution. This is shown for yr (the length of the TDU period) and as the dashed curve in Figure 4. It can be seen that the semi-analytic treatment is almost indistinguishable from the numerical model over most of the range of interest. The flat region at /yr would have been obtained if we had not neglected the small 18O production.
Because of the low temperature at which 18O is destroyed, it is evident that low 18O/16O in the envelope is not necessarily related to 26Al production. As long as , 18O/16O in the envelope is completely independent of . This is illustrated by plotting in Fig. 6 for 18O/16O vs. 26Al/27Al the final compositions after CBP running through the TDU period. Compositions were computed with the numerical model. One can see that the curves of constant (dotted lines) are approximately curves of constant final 18O/16O, while the curves of constant (dashed lines) are approximately curves of constant 26Al/27Al. The departure of the constant- curves from constant 18O/16O is explained as follows: at low (low 26Al/27Al), 18O destruction on a single pass through the radiative zone is incomplete; at high (high 26Al/27Al), the situation is complicated by partial 16O destruction.
The final envelope compositions are the compositions most likely to be reflected in presolar grains; the most grain formation should occur with very high mass loss at the very end of AGB evolution (Table 1). The circles in Fig. 6 show the abundances found in oxide grains. It appears that the model can, in principle, explain simultaneously the 26Al and 18O contents of all the oxide grains found so far, and with reasonable values of and (however, see the 17O trends below). The largest value of 26Al/27Al indicates a maximum in the source stars of about K, while a wide range in is suggested if all the 18O/16O values are attributable to CBP. Not all grains formed from 1.5 stars. Moreover, inferred values of and are sensitive to exactly when CBP occurs and for how long; these values do provide qualitative insight into the actual mixing rate and depth. In any case, 18O/16O decreases at a rate dependent upon and not , so that there is no strong correlation with 26Al/27Al production except that 26Al/27Al and 18O/16O may be modified simultaneously by CBP. Low and high will produce small 18O depletions and abundant 26Al. High and high will produce major 18O depletion and high 26Al. Thus, a direct correlation between 26Al/27Al and 18O/16O should not be found, although Nittler et al. (1997) and Choi, Wasserburg & Huss (1999) have suggested that it might occur on an empirical basis.
The plateau of 17O/16O at /yr for all seen in Fig. 5 shows net increases above the dredge-up value ranging from 0% to 40%. This plateau value increases with temperature, but is at 0.0011 for all . Fig. 7a shows 18O/16O vs. 17O/18O for the final envelope composition, at various values of and . Generally speaking, the results lie in the space between point D (composition after first dredge-up) and the end point B. If we use Stage 3 instead of Stage 5 to specify the stellar structure, this changes the results by shifting the 17O/16O end point B to 0.0016. Results for Stages 4 and 6 are similar to those of Stage 5.
We now examine 17O/16O using the semi-analytic treatment. In the circulating material, 16O destruction is very small, and the 17O abundance is governed by competing production via and destruction via :
| (14) |
Starting from a low initial abundance, increases as matter moves through the radiative zone until the two terms on the right-hand side of Eqn. 14 cancel. The equilibrium ratio specified by this cancellation is determined completely by reaction rates so that processed material has
| (15) |
As a result,
| (16) |
The final envelope composition using this approximation is shown as a function of in the dashed curve in Fig. 5. As with the numerical results presented, this assumes the radiative zone of Stage 5 and yr. We chose for the analytic approximation. It is clear that at the condition of required to obtain equilibrium, the results are in close agreement with the numerical calculation. Thus, the envelope 17O/16O as a function of time reflects the replacement of envelope matter with material that has 17O/16O.
The steady-state 17O/16O is almost temperature-independent over the temperatures characteristic of the lower part of the radiative zone late on the AGB, as shown in Fig. 8. As a result, is approximately 0.0011 for all cases with , with an uncertainty of about 30% in the ratio arising from measurement errors on the cross section inputs (Blackmon et al. 1995; Angulo et al. 1999; see also Appendix A). We note that only in the last six years have cross sections been sufficiently well-measured to allow us to reach this conclusion, because of the measurement of the 66 keV resonance by Blackmon et al. (1995). At lower temperatures, the equilibrium 17O/16O increases, but the timescale to reach equilibrium also increases so that these higher values of 17O/16O are inaccessible after Stage 4. The highest value that we found at any time on the TP-AGB is 0.0016.
Since the envelope 17O/16O as a function of time reflects gradual replacement of envelope material with material that has fixed 17O/16O = 0.0011, and the processed material also has extremely low 18O/16O, we now recognize the numerical results in Fig. 7a as mostly falling on a two-component mixing curve.
We also carried out calculations using radiative-zone structures from other stages, and the results were almost indistiguishable as long as . As explained in the analytical treatment, the dominant effect for is to produce an envelope that is a mixture of the envelope composition after first dredge-up and the end point B that represents the equilibrium value. For all values of , the numerical results lie on the mixing line at positions depending almost exclusively on as indicated in the figure. For lower temperatures, () the final compositions fall in a space bounded on the one side by the mixing curve and on the other by the curve with /yr. More generally, as the oxygen isotopic evolution resulting from CBP depends on the value of 18O/16O and 17O/16O after first dredge-up and not on the detailed stellar evolution, we may readily infer the results of CBP for low-mass AGB stars of generally solar chemical abundances but with arbitrary oxygen isotopic composition: the end point B is the natural final composition for material that has been near the H shell in any AGB star of low mass (), because all of these stars have H shell temperatures near K.
The results for two initial compositions are shown in Fig. 7b. The upper point represents ratios in the envelope at the end of first dredge-up for some star. For , the trajectory is a mixing line between and B, where the position only depends on . If is substantially less than , but greater than , it will be a curve that drops from (due to 18O destruction) and then swings toward as increases. This same rule applies to or any other point, insofar as the initial stellar mass does not exceed 4–5, where HBB may occur (Iben & Renzini 1983). As the initial oxygen isotopic composition of the star which produced a particular oxide grain is not in general known, we will use this construction in discussing the data on grains in Section 4.1.1.
In light of the above considerations, the production of 17O/16O by first dredge-up is explained because material in the stellar mantle is processed during the main-sequence phase at much lower temperatures than those present on the AGB. The relevant reaction rates are much slower and the equilibrium ratio larger (see Fig. 8), while the duration of the main-sequence phase is much longer than that of the AGB phase.
2.3 Carbon
The evolution of carbon in CBP is more complex than that of 26Al, 17O, or 18O, since the nuclides discussed so far are negligibly affected by TDU. The abundance of 12C in the envelope is altered at each dredge-up episode. Consequently, the 13C/12C ratio is shifted. The change in C/O in the envelope at each thermal pulse in SEM(1.5) is shown in Figure 9a along with the change in the mass of the envelope with time. In the numerical model, we assume that CBP starts immediately after the first thermal pulse that produces dredge-up (Table 1 and Fig. 2). This is the same calculation used for 26Al, 18O, and 17O.
Figure 9a shows the evolution of C/O for SEM(1.5) as a function of time up until the end of TDU and includes the cases of CBP with /yr and for comparison. Note that C/O = (12C + 13C)/16O. In Figure 9b we show the evolution of 12C/13C in the envelope versus 26Al/27Al with time for three cases. As already stated, it is evident that high values of give high 26Al/27Al. However, to obtain low 12C/13C at high 26Al/27Al requires high (e.g. /yr). In the latter case, the 12C content of the envelope is so low that every thermal pulse gives a spike in 12C/13C which is then destroyed by rapid CBP. The final envelope compositions in terms of C/O and 26Al/27Al are shown in Figure 10. It can be seen that the approximate boundary for C/O is /yr. The relationship between 12C/13C and C/O is shown in Figure 11. The solid triangle represents the final envelope composition of the AGB star computed by SEM(1.5) with no CBP. The results for CBP are shown as curves of constant with the values of varying with position along these curves. It can be seen that to obtain both C/O and low 12C/13C ( ) requires conditions that are very restrictive ( ). Low 12C/13C may readily occur for higher but with C/O .
In the material circulating through the radiative zone, the 12C and 13C abundances are governed by the equations
| (17) | |||||
| (18) |
As a sample of circulating material descends into the radiative zone and its temperature rises, the negative term on the right-hand side of Eqn. 17 grows and 12C is destroyed. The 12C that is destroyed is converted to 13C, so that quickly both the production and destruction terms in Eqn. 18 balance. The condition that 12C/13C in this material does not change with time then gives the steady-state ratio
| (19) |
which depends only on cross sections. For the temperatures in the radiative zone, it is about 3. As processing continues, 12C continues to burn while 12C/13C remains approximately constant, producing 14N. Finally, if is sufficiently high, enough 14N is made to close the CN cycle with the reaction chain , and the amounts of 12C and 13C become steady with 12C/13C and . Thus, CBP destroys 12C, mixing 12C-depleted and 13C-enhanced material into the envelope. This explains the strong dependence of the C isotopes on : because at most temperatures, sets the rate at which processed material of the new 12C/13C composition is mixed into the envelope.
The effects of CBP can be seen as follows for a given . The ratio 12C/13C first decreases with increasing due to increasing input of processed material, approaching 12C/13C. For , most of the C is converted to 14N in the processed material, so that processed material contains only small amounts of 12C and 13C. As a consequence, 12C/13C in the envelope remains near the value it would have without CBP. For /yr, the processing at is so effective that a substantial amount of carbon is converted to N and C/O becomes less than one.
2.4 C-rich vs. O-rich envelopes
The conversion of a large fraction of the carbon in the stellar envelope into nitrogen has important observational effects: the C/O ratio determines whether the signs of related nucleosynthesis should be expected in S stars versus carbon stars, or in oxide grains versus carbon and carbide grains. As seen in Figs. 9a and 10, when (and whether) this ratio exceeds unity depends on competition between third dredge-up and CBP in the invervals between dredge-up events. To look at this competition, we now examine the problem analytically.
The rate of addition of 12C to the envelope by TDU is some function of time, . CBP removes material from the envelope and replaces it with material in which some of the 12C has been destroyed. The time evolution of the envelope 12C abundance is then governed by the equation
| (20) |
We wish to find the condition on such that the envelope is carbon-rich at the end of the TP-AGB. If (where is the fraction of 12C destroyed in a single pass), we then have
| (21) |
is essentially a sum of delta functions from dredge-up, but we will approximate it by its mean value, (see Fig. 9a). The solution to Eqn. 21 is
| (22) |
At the end of the TDU phase, yr. The condition that the envelope is carbon-rich is that . Inserting this condition along with into Eqn. 22, dividing by , and solving for gives
| (23) |
The value of the fraction destroyed () depends strongly on and weakly on . A reasonable mean value of during the TDU period is . If , then /yr for C/O , within a factor of a few of what we find numerically. If /yr, the maximum CBP rate we considered, then C/O in the envelope requires , or very little carbon destruction per pass. The combination of high and C/O is therefore restricted to very low .
If the true efficiency of dredge-up is different from that for SEM(1.5), then differs from the value used here (for a possible mechanism, see Herwig et al. 1997). If is doubled, then the that divides C/O from C/O (Eqn. 23) increases by a factor of three; we find that the relationship between the two parameters is approximately linear over this range of . Since dredge-up does not have a strong effect on the other abundances, the only influence on our results is to change which lie on which side of C/O. The abundance changes found above for the O and below for the N isotopes take place over wider ranges in than factors of three, so we do not expect qualitative changes in our results if the dredged-up compositions change.
2.5 Nitrogen
The effect of CBP on nitrogen is to efficiently destroy 15N and to greatly increase 14N in the envelope. The increase in 14N is due to the conversion of 12C into 14N by CBP at . Complete conversion of 12C in the envelope from the initial C inventory in the absence of TDU would increase the 14N abundance to over three times the original main sequence value. As TDU considerably increases the amount of available carbon in the envelope, even more 14N will be produced. This can, at the end of the stellar lifetime, give (with values above 1.7 involving destruction of oxygen). Such large amounts could constitute an important source of primary (scaling linearly with metallicity) nitrogen in the Galaxy.
The relationship between 15N/14N and 26Al/27Al is shown in Fig. 12a for the final envelope composition as a function of and for the numerical model. It is seen that there is a rapid drop in 15N/14N with increasing for all . For , the 15N/14N ratio is essentially constant for a given . Comparing with Fig. 10, we see that a wide range in 15N/14N (from about to ) may occur if C/O. If C/O then /yr and and 15N/14N. See the discussion of SiC grains in Section 4.1.2.
In Fig. 12b we show N/O vs. C/O for the final composition of the envelope in the numerical model. The curves for different and are indicated. It can be seen that CBP will produce high N/O for /yr and . We note that C/O requires /yr for the same .
3 Self-consistency and relation to other models
3.1 Effects on energy generation
We now examine the self-consistency of the post-processing approach with the basic AGB stellar model. Since we assume an underlying stellar model [SEM(1.5)] without CBP, it is important that the additional processing not affect the energy generation in a way that would significantly alter the evolution. The important issue is to determine what values of and plausibly allow a self-consistent calculation.
For , we have considered the range to /yr. The low end is comparable to the rate of advance of the H shell, and too slow to turn over the radiative region between two successive thermal pulses. At the high end, the rate at which the radiative zone turns over corresponds to times per year. If the CBP circulation is to be distinct from envelope convection, its turnover rate should be at least an order of magnitude less than that of the convective envelope ( per year). Concerning the effective penetration depth , we chose the lower limit of 7.44 for negligible processing and the upper limit of 7.76 to produce 26Al/27Al. With this range in parameters we now examine the effects on the energy production rate and luminosity. The energy generation in the parts of the stellar interior where CBP takes place occurs at very nearly the same rate with and without CBP. This is because CBP never changes the H mass fraction on a single pass through the radiative zone by more than in the CBP models. It was calculated that CBP will change the H mass fraction in the envelope over the whole evolution by a total of only 4.6% even at the highest we considered. Since we have assumed that CBP changes neither the physical conditions in the radiative zone nor the total number of C and N catalyst nuclei, the energy generation rate can change by at most 4.6%. An estimate of the energy generated in the matter undergoing CBP is computed as follows: we examine the H mass fraction of the envelope at the end of the numerical calculation and find the difference from the final mass fraction in the original SEM(1.5) model in the absence of CBP. We multiply this difference by an average envelope mass of 0.6 and then by 7 MeV/nucleon, and divide by the yrs that CBP was active. This yields an effective luminosity, shown in Fig. 13 as a function of . For /yr, this luminosity is independent of (because, just as in the case of 26Al, only a small amount of processing occurs on each passage through the radiative zone). Also plotted in Fig. 13 is the evolving luminosity of the SEM(1.5) model for comparison.
For , the CBP flow yields at most 25% of the star’s total energy generation rate during the TP-AGB phase. However, this amount is very close to the energy generation that would occur in the same radiative layers without CBP; the difference is 1.3% of the star’s total energy output. Our proposal to explain 26Al/27Al ratios by CBP requires extending only to ; this corresponds to 5% of the total energy generation occurring in the CBP flow and depletes about 1.2% of the envelope hydrogen. It follows that the CBP necessary to produce 26Al/27Al as found in some grains does not have a major effect on the luminosity or the energy generation rate.
3.2 Extra mixing by diffusion parametrization
We now wish to compare models in which extra mixing is modelled as diffusive transport with those in which it is modelled as a mass flow (the present work; Boothroyd, Sackmann & Wasserburg 1994, 1995; WBS; Boothroyd & Sackmann 1999; Sackmann & Boothroyd 1999; Messenger 2000). The mass-flow models have only two parameters, and . In the case of diffusive models, the mixing is modelled either by post-processing calculations which include time evolution of the radiative zone, or by inclusion in a full stellar evolution code. In either case, a term is added to the stellar evolution model for diffusion between the convective envelope and a region of the radiative zone. The parameters used are a diffusion coefficient and a maximum depth of diffusive mixing . The parameter is defined in terms of the deepest mass coordinate penetrated, , the convective-envelope boundary , and the base of the H shell (see Fig. 1) as
| (24) |
To obtain adequate nuclear processing, the diffusive penetration must extend into the upper part of the H shell. To prevent the catastrophe of interference with the region of maximum energy generation, a barrier boundary is assumed across which no diffusion is permitted to occur: this is specified as (cf. Denissenkov & Weiss 1996; Denissenkov et al. 1998; Weiss, Denissenkov & Charbonnel 2000). The two versions of transport – mass flow and diffusive mixing – are thus closely related and have similar effects. The relationships between and and between and may be seen as follows. The parameters and are directly related through the temperature at the position where the diffusive mixing is stopped. This is fixed by the basic stellar model. The relationship between and may be seen as follows. The length scale and time scale for mixing must satisfy , so that . For mass flow, the velocity corresponding to at radial position in the star is , where is the mass density. This yields
| (25) | |||||
| (26) |
We have taken for reference the values of and at the H shell and the thickness of the radiative zone, all at Stage 5. This is the basic relationship between and to an order of magnitude. For comparison, the value estimated by Denissenkov & Weiss (1996) is /s in their study of a low-metallicity RGB star. The relations between and for the evolutionary stages that we considered for CBP are shown in Fig. 14. In the parametric diffusion treatments of Denissenkov and co-authors, was chosen to be where the H mass fraction was 5–20% below the envelope value before the onset of mixing. We indicate the corresponding points in Fig. 14. Their prescription results in similar mixing depths to those that we have examined in this paper.
3.3 The problem of 26Al production and
There remains the issue of whether the calculated effects of CBP for a star may be reasonably carried out by choosing a given and and using a selected radiative-zone structure from a single time (stage) during the TP-AGB. A complete calculation of CBP would require inclusion of the detailed evolution with time as the stellar structure evolves. Again let us consider a semi-analytic treatment to understand the results. The temperature dependence of the processing is unimportant for carbon, nitrogen, and oxygen isotopes for all . The results for these nuclides are thus almost independent of which stellar structure is chosen. We verified this by calculations with the numerical model, utilizing radiative-zone structures from Stages 3, 4, 5 and 6. This is not the case for 26Al, as can be seen by examining Fig. 3b. For a given , we see that the equilibrium 26Al/27Al for different times along the evolution (Eqn. 6) decreases with increasing time. This rapid decrease occurs because as the H shell advances outward, the thickness (in mass coordinates) of the radiative zone decreases sharply, while the ratio of temperatures at the bottom and top of this region, (where is the temperature at the bottom of the convective envelope), remains relatively fixed at about 24. The region in which 26Al is produced accordingly becomes thinner very rapidly as the star evolves, and the amount of 26Al produced drops. Another contributing factor is that the density in the radiative zone drops steadily during the AGB phase, depressing all reaction rates. The final 26Al/27Al value calculated for a given is thus drastically altered by the choice of reference state used to provide the radiative-zone conditions. That significant 26Al production would occur is not an issue. Rather, the question is how does one pick an appropriate combination of stellar reference state and for 26Al production. Fig. 15 shows a graph of steady-state 26Al/27Al ratios in the envelope as a function of for the different stellar reference states considered. It can be seen that there is a congruent value of for each reference state that will produce essentially the same (within a factor of 3) 26Al/27Al if the value of is scaled with as the star evolves. It follows that the required for 26Al production is within this framework well-constrained and that a CBP model covering all the isotopes of C, N, O, Mg, and Al can be reliably calculated for a given reference state. The particular value of is simply congruent to some effective value of and is not otherwise fixed. This is in accord with the approach taken by Boothroyd & Sackmann (1999) and Messenger (2000) for the RGB, but with the congruence made evident by 26Al production rates.
4 Experimental consequences
We have constructed above a model that should be a good description of AGB stars undergoing cool bottom processing, using only two parameters. We now examine the consequences of the rules established by this model for observed isotopic abundances.
4.1 Circumstellar grains
4.1.1 Regime of C/O
Fig. 16 exhibits the relationships between 18O/16O and 17O/16O in the envelope after first dredge-up (curve AF) and after CBP (thin dashed and dotted curves). The available data on oxide grains are also shown. A substantial population of the oxide grains can be seen to lie generally close to the curve AF for AGB evolution after first dredge-up for stars of varying mass, starting from initial solar isotopic composition. (Data are those summarized in Choi et al. 1998, and come from Hutcheon et al. 1994, Huss et al. 1994, Nittler et al. 1994, Nittler et al. 1997, Nittler & Cowsik 1997 and Nittler et al. 1998; curve AF from Boothroyd & Sackmann 1999). Some points lie above the curve AF and are plausibly explained by normal AGB evolution without CBP from initial states with elevated 18O/16O (Choi et al. 1998). The trajectories for CBP of 18O/16O and 17O/16O for a 1.5 star of solar composition are given by the line from point D to point B, and the bounding curve for high following Fig. 7a. It is seen that there is a population of data that lies on this trend and a concentration of data approaching and near to the equilibrium value at point B. Following the rules shown in Fig. 7b we see that data in the region labelled H may be explained by stars of up to 1.8 initial mass. They might equally be explained by an initial state of somewhat lower 18O/16O without CBP. Lower-mass stars with solar oxygen ratios directly modified by CBP would yield grains which lie in the region bounded to the left by the curve AJB and the line AB, corresponding to a range in and . However, the data in region G can not be explained by AGB evolution from solar initial composition, with or without CBP; these must involve sources with very low to supersolar initial 18O/16O values and subsolar 17O/16O values – presumably representing different stages of Galactic evolution. The issue of how the abundances of the rare isotopes 17O and 18O evolve over time in local material and in an average over the Galaxy is complex (see Timmes & Clayton 1996; Nittler & Cowsik 1996; Alexander & Nittler 1999). It is evident that the wide variety of oxygen isotopic abundances found in circumstellar oxides preserved in meteorites requires a diverse set of stellar sources with quite different initial isotopic abundances and metallicities. Inspection of Figure 10 shows that for C/O in the stellar envelopes, there is a wide range of that produces the oxygen compositions shown in Figure 16, allowing a plausible explanation of a wide range of 26Al/27Al abundances. The production of 26Al is quite adequate to obtain values of 26Al/27Al up to , the governing parameter being . The values of 26Al/27Al cannot be achieved within the framework of standard AGB evolution (BGW99) unless there are cases in which essentially negligible 26Al production in the H shell is possible and the stellar lifetime is still short enough to contribute to the solar-system grains.
4.1.2 Regime of C/O
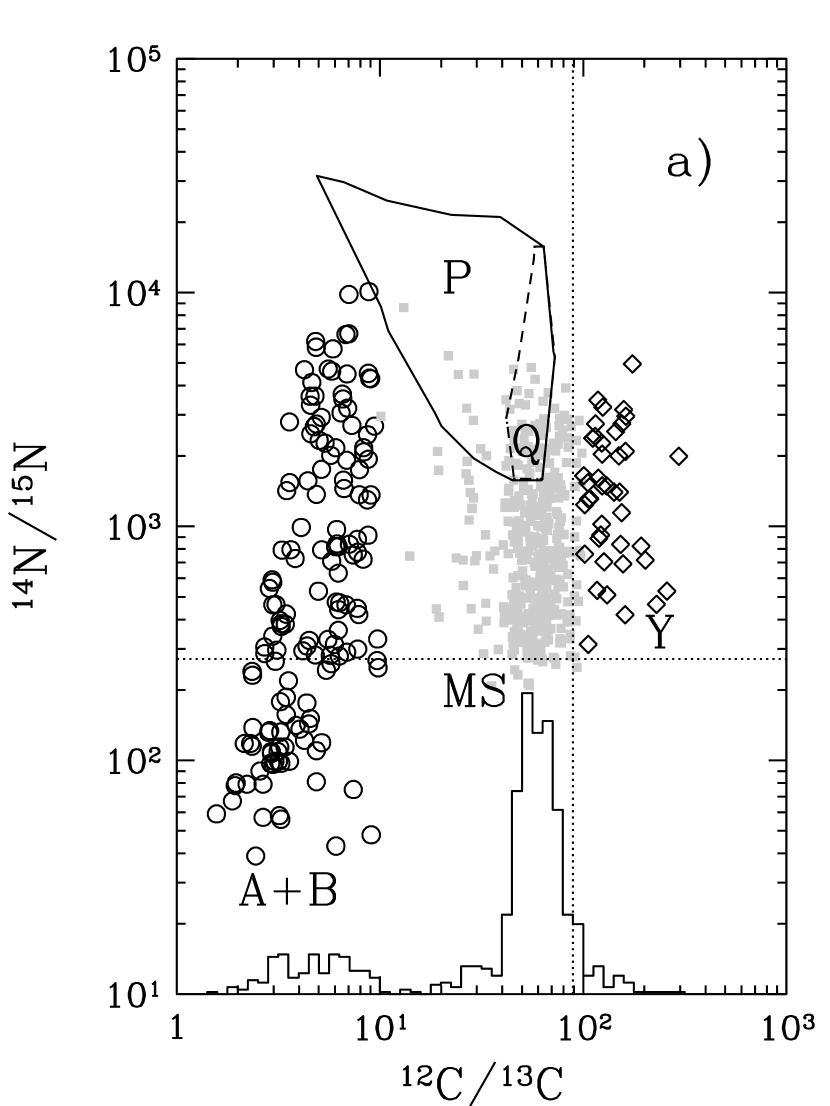
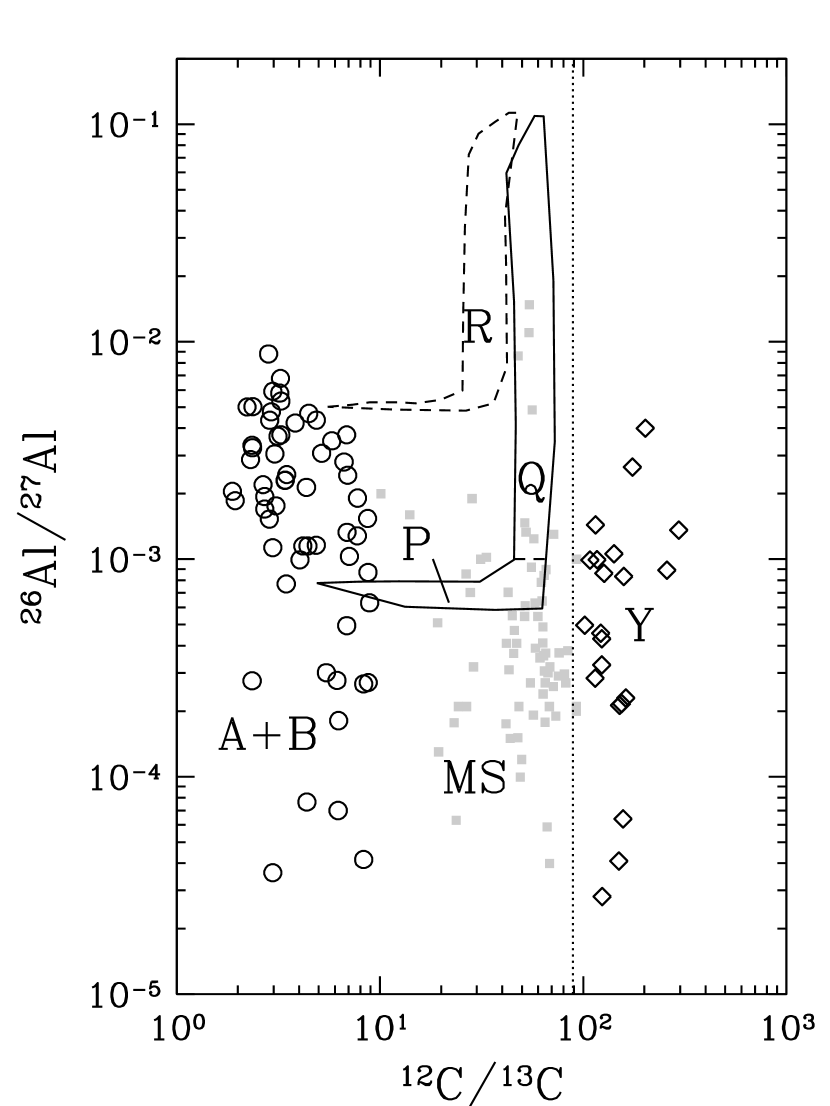
The regime where carbon or carbide grains may form under equilibrium conditions requires C/O . There are abundant data on 12C/13C and 26Al/27Al in circumstellar carbides recovered from meteorites (e.g., Amari, Lewis & Anders 1994; Hoppe et al. 1994; Hoppe & Ott 1997; Huss, Hutcheon & Wasserburg 1997). Most recently the results have been summarized and discussed by Amari et al. (2001a,b). In addition to the 12C/13C and 26Al/27Al data, there are results on 14N/15N as well as on Ti and Si isotopes. In the following discussion, we will focus on the so-called “mainstream” (MS) grains, “A and B” grains and “Y” grains. These classifications are dominantly based on the ratios 12C/13C and 14N/15N (see Amari et al. 2001b for more extensive discussion). The mainstream grains are overwhelmingly the most abundant of the circumstellar SiC grains found. Figure 17a shows the distribution of grains in the 12C/13C, 14N/15N diagram. We first consider the mainstream grains. As noted by many previous workers, the 12C/13C of mainstream (MS) grains lies in the region expected for the envelopes of AGB stars of approximately solar metallicity. The spread of 12C/13C extends from slightly above the solar value of 89 down to 20, with most grains between 40 and 80. We also show the whole region (labelled P and Q) that is accessible by CBP in the numerical model with C/O .
The observed 26Al/27Al versus 12C/13C is shown in Fig. 18. The horizontal segment P with low 12C/13C corresponds to the high-14N/15N region also labelled P in Fig. 17a. This is also the region in Fig. 11 of low and C/O, running from the solid triangle (no CBP) down to 12C/13C at /yr. There is no 26Al produced as is low along this segment of the curve. The value of 26Al/27Al in region P of Fig. 18 corresponds to the total 26Al produced in the conventional treatment of third dredge-up (BGW99; see Fig. 3a). If we include an earlier episode of CBP (prior to TDU) sufficient to give 26Al/27Al , then the envelope that is accessible for C/O is region R of Fig. 18. The observed 26Al/27Al for the range of 12C/13C found in the MS grains is well represented by CBP. However, the samples with 26Al/27Al cannot be explained by the model (independent of C/O). A substantial fraction of these grains (and of oxide grains) thus has less 26Al than predicted for conventional AGB evolution in stars of (BGW99; Mowlavi & Meynet 2000). It is possible that this reflects the normal AGB evolution at somewhat lower stellar masses, or that there is some variability in the non-CBP 26Al production in AGB stars as discussed in Sec. 1.
A fundamental problem with the SiC grains is exhibited by the 14N/15N data shown in Fig. 17a. Here the majority of MS grains lie below 14N/15N , and the lower values are near the solar value. This is exceedingly difficult to explain with AGB stars in any evolution model that assumes solar abundances as the initial state. First dredge-up will destroy roughly half of the 15N in the envelope and double the 14N, so that the resulting value of 14N/15N should be . Then any CBP will only destroy more 15N and produce more 14N, increasing the ratio. To explain the high 15N, it has been proposed by Huss, Hutcheon & Wasserburg (1997) that the N reaction rates are far greater than the accepted values. If this is the case, then all of the 15N calculations presented here are in error. The nuclear data suffer from poorly-known parameters for a low-energy resonance, but the most recent work (Champagne & Pitt 1986) contradicts earlier indications of an additional large subthreshold resonance that would produce the much higher rate advocated by Huss et al. (1997). If we assume that the calculations presented here are correct and that the MS grains represent RGB and AGB evolution, then it is necessary to provide an alternative hypothesis. If the MS grains with 14N/15N were the products of evolution on the RGB prior to first dredge-up then to produce grains with no change from the initial N composition, this would require RGB stars that have C/O and have done nothing to their N isotopes. No evidence for such stars, either theoretical or observational, has been found. If we consider that the stars which produced the grains with low 14N/15N were the products of normal first dredge-up (DU) and subsequent AGB evolution, then it is necessary that the stars’ intial composition have 14N/15N far less than the solar value. In all cases, first DU increases 14N/15N by a factor of . If we assume that the typical initial state had 14N/15N , then first DU would give the solar value and subsequent CBP would essentially fill the region of the mainstream grains.
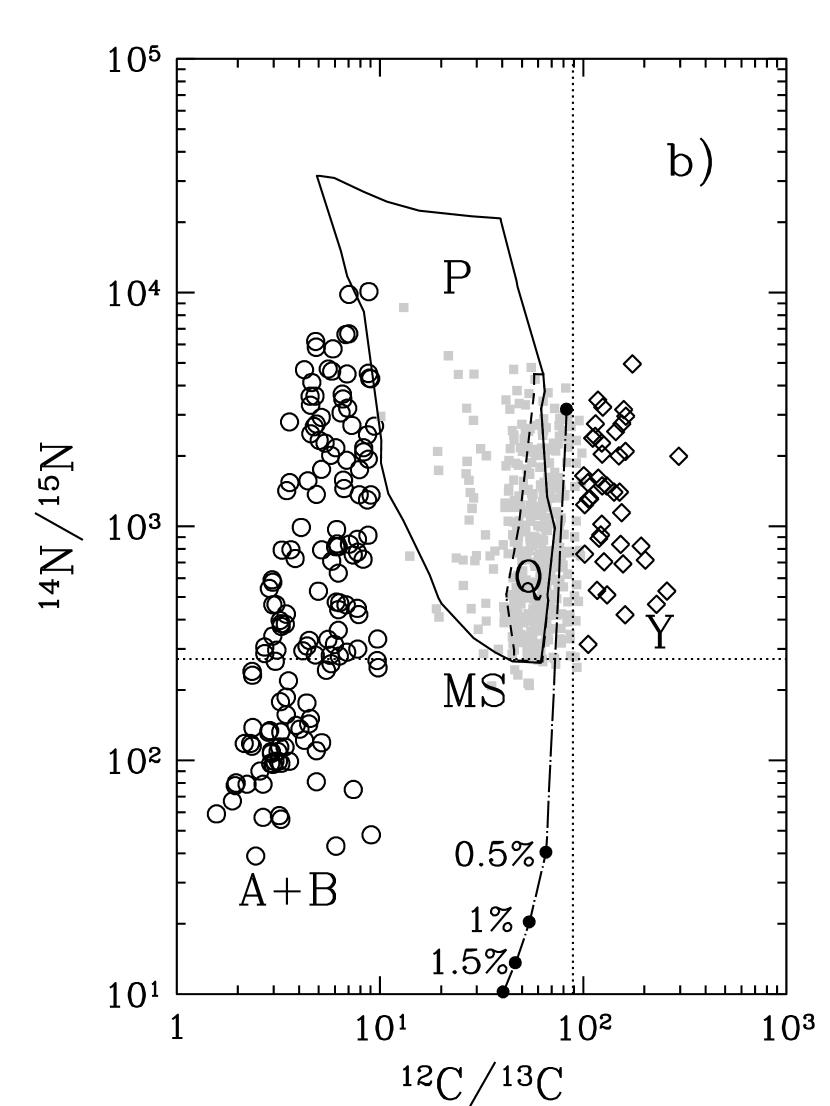
Following these considerations, we carried out calculations in which we increased the assumed initial 15N inventory so that 14N/15N (the solar value) when the star arrives on the AGB. We obtained results for all the pertinent isotopes with this initial composition in the numerical model. The results for O, C, and Al are of course not affected. The results for 14N/15N and 12C/13C are shown in Fig. 17b. It can be seen that the whole mainstream region (not just the upper part) is covered with this shift in initial 14N/15N. We note that adjusting the initial 14N/15N by decreasing the amount of 14N while holding all else fixed cannot provide the same adjustment of the final 14N/15N. This is because first dredge-up with initially solar abundance ratios among the metals doubles the 14N mass fraction in the envelope. Adjustments to the initial 14N inventory do not affect the 14N gained at first dredge-up, so they can reduce 14N/15N on the AGB by no more than a factor of two below the standard models. The SiC grains require a reduction by almost a factor of 4.
It is not clear that the solar 14N/15N value is in any way the proper choice for the ISM sampled in forming the stars which are the source of the MS grains. The data on oxide grains clearly demonstrate that the stellar sources must come from different molecular clouds which represent a wide range in degree of chemical evolution. The requirement that the bulk solar values represent a mix of diverse sources is found in many examples. This is particularly the case for rare isotopes such as 13C, 15N, 17O, and 18O. We recall that 17O/18O in the ISM (Penzias 1981) has been found to be distincly different from the solar value (factor of ). We consider that there has been evolution of these isotopic abundances over Galactic history, that the abundances of some isotopes are quite different today than at the time the solar nebula formed, and that the abundances, particularly of very rare or low-abundance isotopes will be distinctly different in different places, even at the same time. As is the case for oxygen, the 14N/15N values in the mainstream grains are clear indications that the initial values for some sources cannot be the solar value but must be greatly enhanced in 15N. This conclusion is unavoidable if the grains are produced by AGB stars.
Many grains assigned to the MS group exhibit clear -process signatures in several heavy elements which are attributed to nucleosynthesis in AGB stars as noted by Hoppe & Ott (1997) and Gallino, Busso, & Lugaro (1997). The more abundant isotopic data on Si and Ti in SiC grains show that these elements are dominated by effects associated with galactic evolution (Gallino et al. 1994) with small modifications attributed to -processing. The Si and Ti data are not useful for our arguments because they do not strongly reflect the s process. However, the important new generation of measurements on individual mainstream SiC grains for many elements show clear -process signatures in several isotopes of different elements (Nicolussi et al. 1997; Nicolussi et al. 1998; Pellin et al. 2000). In summary, there are compelling reasons to assign MS grains to AGB stars, as recognized by many workers. The largest problem with this assignment appears to be the 14N/15N data. We conclude that this can most simply be resolved by assuming that the initial 14N/15N typically available in molecular clouds yr ago must have ranged from 14N/15N upward. The “solar” value is considered to be the result of a sampling of material that had previously undergone some prior processing in AGB stars.
The N isotopic compositions determined for the ISM seem to support the idea that 14N/15N increases from low values in regions of low astration to higher values in regions of high astration. Chin et al. 1999 find for the Large Magellanic Cloud, while higher values of 270 in the solar system, 200–600 in the Galactic disk, and at the Galactic center are found in places with presumably increasing astration (see Wilson & Rood 1994 and references therein). It is thus plausible that 14N/15N was typically much lower at earlier times and certain that it is variable. On the other hand, it is generally claimed (e.g. Wilson & Rood 1994) that there is a gradient of 14N/15N with galactocentric distance in the Galactic disk, in a direction suggesting that 14N/15N decreases with astration.
Inspection of Figs. 17a,b and 18 shows the data on Y grains, which are classified as distinctive almost solely because their 12C/13C is greater than the solar value. The distributions of these grains in both 14N/15N vs. 12C/13C and 26Al/27Al vs. 12C/13C are otherwise the same as those for the MS grains. If one considers 12C dredge-up in models of AGB stars, it is evident that an increase in the amount of dredge-up by a factor of 2 or 3 for a small proportion of AGB stars would yield a carbon star with Y-grain-like composition. In this case, the Y grains are not distinguishable from the more general population of grains produced by AGB stars but reflect some variation in C dredge-up. Our preferred interpretation is that they simply reflect the high-end tail of the C/O distribution resulting from dredge-up, which may or may not result from variation of metallicity (i.e., variation of intial O). The extent to which the variability of 12C dredge-up is possible within the framework of AGB models remains to be tested. Other proposals to explain the Y grains are based on the dependence of dredge-up on metallicity, as argued by, e.g., Amari et al. (2001b) and references therein on the basis of anomalies in the Si isotopic composition.
We now consider the A and B grains. As discussed by Amari et al. (2001b), these grains are defined by low 12C/13C. They are also found to exhibit 14N/15N ranging over more than two orders of magnitude and extending to below the solar value. We consider them here as representing a group of grains produced by a generic process. It is evident that AGB stars can produce 12C/13C as low as 4 at low but they can not produce a wide range in 14N/15N and 26Al/27Al and simultaneously have 12C/13C and C/O . It follows that an AGB source at approximately solar metallicity can not be the origin of such grains. Further, we do not consider that this condition can be directly related to low metallicity. It should also be noted that a considerable number of these grains have 12C/13C , ranging down to 12C/13C and (Amari et al., 2001b). From the existing knowledge of reaction rates, values below 3 can not be achieved on either the RGB or the AGB with or without CBP. It follows that either there is some significant () error in the reaction rates or that these grains were produced under conditions quite different than the CNO burning outlined in Section 2.3 and as discussed by other workers. A considerable number of the grains have 14N/15N extending down to 14N/15N , far below the solar value. It was suggested by Amari et al. (2001b) that this may be produced by hot H-burning (far above AGB shell-burning temperatures), possibly associated with novae. While it is reported that many CO novae condense carbon dust, it should be noted that only three of the 31 recent novae listed by Gehrz et al. (1998) have been observed to have C/O . The formation of different types of grains (e.g., carbides or silicates) in the same nova may reflect sequential condensation (see Gehrz et al.). The calculated yields for thermonuclear runaways (TNR) in novae almost exclusively have C/O (Starrfield et al. 2001, and S. Starrfield 2001, personal communication). The most recent calculations (S. Starrfield 2001, personal communication and Starrfield et al., in preparation) show that C/O for white dwarf masses of 1.25 and 1.35 . An extremely high 17O/16O ratio () is predicted in all cases. A search for implanted oxygen with such extreme 17O enrichments in graphite or SiC grains would therefore be very important. It is known that extreme values of 12C/13C and 14N/15N (), as well as substantial 26Al are predicted for novae yields (cf. Starrfield et al., 2001). Nonetheless, it is difficult to connect the A and B grains as a group to novae sources. There are only two reported cases of high 26Al/27Al in SiC grains with extremely low 12C/13C and 14N/15N. They belong to the very small class (6 known) of carbon-rich grains attributed to novae on the basis of C, N, and Si isotopic compositions, and they are not A and B grains (Amari et al. 2001c). No models of novae give 14N/15N far above unity. The yields of C, N and O isotopes are all very roughly commensurate (factor-of-ten) so that the wide spread in 14N/15N cannot be achieved with low 12C/13C. Thus, the high 14N/15N values found for some A and B grains cannot be attributed to novae. The A and B grains appear to suggest some connection with novae; however, this cannot be due to the TNR on ONeMg white dwarf models for which nucleosynthesis is usually computed. One possibility for a direct nova connection would be if the fragile 15N could be destroyed during the later stages of the explosion. The models of novae so far considered have mostly high accretion rates, and it is conceivable that low accretion rates which do not initiate full TNR could produce partially processed material with isotopic characteristics resembling A and B grains. The true novae represent extremely energetic bursts punctuating a slower, ongoing accretion process. If we assume that the A and B grains were produced by a mixture of accreting AGB matter that is not processed in TNR and a component that was produced through TNR, then we immediately face the problem that the nova yield ratio is typically , while the AGB matter with which it is mixed has almost no 15N. A mixing trajectory between AGB compositions and nova compositions would therefore move rapidly from the AGB values to those with very low 14N/15N, but at high 12C/13C (see Fig. 17b). Such a mixing curve would not pass through the A and B grains. Region P of Fig. 17a,b contains AGB compositions with extensive CBP that could mix with a nova composition to produce a mixing curve passing through the A and B grains, but only for a small corner of the parameter space where CBP produces 12C/13C and 14N/15N. Since this composition corresponds to low , any 26Al found in the grains would have to come from the novae. In summary, we have no self-consistent mechanism to propose for A and B grains. They appear to reflect different mechanisms than are currently available in stellar models. If we assume the classification of A and B grains into a single group to be invalid and consider instead subsets of the A and B grains, the problem is not removed.
4.2 Astronomical implications
We now consider what evidence concerning cool bottom processing on the AGB should be accessible to astronomical observations. As in the case of the pre-solar grains, the potential for converting large amounts of C to N is crucial, and we divide up the results into those expected for AGB stars with C/O and with C/O. This discussion applies to stars that have been on the AGB long enough to have become C stars without CBP; for the SEM(1.5) model, this corresponds to the star exceeding a luminosity of .
Fig. 10 shows that for almost any value of , /yr can prevent carbon-star formation. Low values of are therefore required if CBP occurs in C stars. Low requires oxygen isotopes with little or no change from the values set by first dredge-up; this means 18O/16O and wide variation of 17O/16O with stellar mass (along the thick-dashed curve of Fig. 7). It may further be expected that and that incomplete conversion of C to N in the envelope produces (cf. Figs. 12a,b) as well as 12C/13C. In principle, it is possible to obtain a carbon star with 12C/13C if and is high, but this case constitutes a very small part of the parameter space. Any level of 26Al enrichment is compatible with a C-rich star, depending on . We thus find that contrary to usual expectations (e.g. Arnould and Prantzos 1999; Mowlavi & Meynet 2000), normal low-mass C stars with low could produce abundant 26Al and they are reasonable targets for gamma-ray line observations by high-energy satellite experiments like INTEGRAL. However, low 12C/13C requires low that is not compatible with significant 26Al/27Al.
If C/O in the envelope of an evolved TP-AGB star or planetary nebula, it requires /yr. All of the signs of CBP that become more pronounced with greater should then be present: 18O/16O (Fig. 6), 15N/14N (Fig. 12a), and (Fig. 11). The large quantity of carbon destroyed also requires N/O (Fig. 12b). All of this processing should simultaneously destroy 3He. Individual objects may be found with N/O if is very high. Again, since 26Al production is independent of , it should occur equally often in O-rich as in C-rich environments if CBP is active.
Large enrichments of N/O in planetary nebulae may be important signs of cool bottom processing on the AGB. High N/O is frequently observed and is a defining characteristic of the Type I planetary nebulae (cf. Corradi & Schwarz 1995) that make up some 20–25% of observed planetary nebulae. Past expectations have been that N enrichment requires HBB (Peimbert & Serrano 1980; van den Hoek & Groenewegen 1997) and thus intermediate-mass stars. CBP would permit N-rich planetary nebulae to be made from low-mass () stars. A search of planetary nebulae for other signs of CBP at high (those associated with O-rich AGB stars), combined with good stellar mass estimates, would indicate whether the N originated in CBP. Measurements of 14N/15N, N/O, 18O/16O, 17O/16O, and 12C/13C would provide clear tests of CBP. Evidence for moderate N enrichment in a single low-mass planetary nebula has already been found by Péquignot et al. (2000). It would be of great interest if more of these objects are found. Since the same H-burning cycles that characterize CBP are also active in HBB, it would be necessary to determine initial masses of the observed stars and nebulae in order to distinguish CBP and HBB.
4.3 Galactic inventories
The extensive processing of stellar envelopes discussed above may have consequences for the overall Galactic inventories of at least two nuclides: 3He and 26Al. Observations of 3He are difficult, and have so far been confined to the local ISM and some planetary nebulae (Gloeckler & Geiss 1998; Balser et al. 1998; Bania, Rood & Balser 2002). The results indicate that the Galaxy contains no more 3He than one would expect from its primordial inventory plus the result of pre-main-sequence deuterium burning. It is presently not understood why so little 3He has apparently been made over the lifetime of the Galaxy. Low- and intermediate-mass stars should produce large amounts of 3He during their main-sequence evolution (e.g., Sackmann & Boothroyd 1999). First dredge-up should bring much of this 3He into the stellar envelopes, where subsequent mass loss allows its escape into the interstellar medium. Conventional stellar evolution provides no way to destroy this dredged-up 3He. It has been noted in earlier work (WBS; Charbonnel 1995) that cool bottom processing on the red giant branch could provide a path to destroy 3He, using the reactions and . When we include these reactions in our nuclear-reaction network, we find that extensive 3He destruction also occurs in the AGB cool bottom processing scenario presented here. The results of CBP for 3He are directly analogous to those for 18O: there is a threshold temperature above which destruction can become rapid. We find a threshold temperature for thorough 3He destruction of ; factor-of-ten depletion may be reached for . Just as for 18O, the final abundance of 3He in the stellar envelope then depends on the rate and duration of mixing, with duration limited by the stellar lifetime. For both 3He and 18O, essentially complete (more than a factor of 10) destruction occurs at /yr as long as the threshold temperature is exceeded. As a result, low-mass stars that undergo cool bottom processing on the AGB may not be net producers of 3He over their lifetimes, and this may help explain the apparently small amount of 3He production that has occurred.
An observational test of whether 3He is destroyed in this way may be obtained by spectroscopic measurements of 18O/16O in CO lines from AGB stars or planetary nebulae, since both 18O and 3He destruction should occur simultaneously. The threshold for 18O destruction is lower than that for 3He destruction, so 18O destruction is required if 3He is destroyed. The connection between 3He and 18O destruction is also important for another reason: 3He destruction by CBP must occur in essentially all low-mass stars if CBP is to account for the lack of evolution of the 3He inventory. This implies that essentially all low-mass stars should destroy most of the 18O in their envelopes, and in turn that the preponderance of oxide grains originating in these stars should have 18O/16O . Examination of Fig. 16 shows that a large fraction of the sources sampled by the oxide grains have higher values, suggesting that there might not be sufficient CBP to destroy the extra 3He produced in low-mass stars. This problem requires further attention.
The Galactic inventory of 26Al is also of interest. The Galaxy contains of 26Al, as inferred from observations of the gamma-ray line from its decay (Mahoney et al. 1984; Knödlseder et al. 1996). Since 26Al has a mean lifetime of 1 Myr, this requires ongoing nucleosynthesis. The sites of this nucleosynthesis remain uncertain (e.g., Knödlseder et al. 1999). If the sources of the 26Al are AGB stars (which neither create nor destroy 27Al) and if the rate of injection of 26Al into the ISM matches the rate of decay, then the material being ejected into the ISM must have 26Al/27Al satisfying
| (27) |
where is the Galactic 26Al inventory, ’s are mass fractions, is the mass of ejecta from a single AGB star, and is the death rate (stars per year) of AGB stars. If is solar, then
| (28) |
in the ejecta (see Dearborn, Lee & Wasserburg 1988). It is quite difficult to estimate . Consider two cases, with stellar death rates based first on the local density of giant stars and then on an estimate of the local white-dwarf birth rate. In either case, we must extrapolate local stellar populations into totals for the Galaxy; since the 26Al gamma-ray line emission seems to be concentrated in the Galactic disk, we assume that the Galaxy consists only of the thin-disk component described in Binney & Merrifield (1998), and we assume that the dying stars (i.e., those shedding their envelopes into the ISM and evolving into white dwarfs) make up the same fraction of stars everywhere in the Galaxy as they do locally. Using the local density of red giant stars from Binney & Merrifield (1998) and assuming that each of these stars sheds its envelope after a lifetime of years, we find . If these stars each eject , then the ejecta must have 26Al/27Al, from Eqn. 28. Fig. 3a shows that this level could be produced by CBP with . Extensive CBP at high might permit AGB stars to be a significant source of the Galactic 26Al. However, the preponderance of circumstellar grains appear to be produced in environments where 26Al/27Al is much below . If we use the white-dwarf birth rate of Drilling & Schönberner (1985) and we extrapolate the local rate of to a total Galactic rate, we obtain to . This is far too low to contribute to the Galactic inventory. We conclude that it is unlikely that a significant fraction of the 26Al observed in gamma-ray line emission in the Galaxy was made in AGB stars. This conclusion has also been reached on the basis of the apparently clumpy distrubution of 26Al in the Galaxy (Diehl and Timmes 1998). However, cool bottom processing in AGB stars may provide sufficient 26Al to permit detection in selected AGB stars with very low 18O/16O and high N/O.
5 Conclusion
The work presented in this paper demonstrates that extensive predictions of the possible range of envelope compositions and isotopic abundances of AGB stars may be made in a model of cool bottom processing parametrized only by a mass-flow rate and a maximum temperature using a simple calculation.
This calculation uses results from a stellar evolution model calculated without CBP to provide the basic conditions needed to determine the results of additional processing by extra mixing. It appears that significant composition changes have negligible feedback on the stellar luminosity. As a result, the post-processing approach adopted here – in which CBP is calculated separately from stellar evolution – appears to be reasonable. Post-processing calculations allow the range of possible effects of extra mixing to be determined easily by exploring the space of and values once stellar structures have been determined for an arbitrary star. The results reported in this work are based on a grid of 231 pairs of the two parameters. This covers the entire range that is both plausible and potentially interesting, using an unsophisticated code and about one day of processing time on a personal computer with 930 MHz clock speed. Moreover, given only the stellar structure and reaction rates, one can obtain almost quantitatively correct analytical approximations to these results as functions of and for C/O (Eqn. 22 and Fig. 10), 26Al/27Al (Eqn. 6 and Fig. 3a), 18O/16O (Eqn. 13 and Fig. 4), and 17O/16O (Eqn. 16 and Fig. 5). Given the uncertainties concerning the exact mass, evolutionary state, mass-loss rate, and extra-mixing parameters corresponding to the star that produced an observed presolar grain or planetary nebula, the analytic approximations are reasonably accurate and display in a clear way the rules that govern the outcome of CBP.
We found also that given the uncertainties (particularly the unknown mixing mechanism, which will set the mixing depth), the detailed evolution of the stellar structure below the stellar envelope (e.g., the radiative zone) is relatively unimportant. The results from a complete stellar evolution code without extra mixing are necessary to specify the timescales, the evolution of envelope mass, the action of dredge-up, and a representative structure for the region in which nuclear processing takes place in the CBP model. However, the detailed evolution of this region need not be followed to obtain useful results. The major effect of the evolution of this region is to change the that corresponds to a given amount of processing; holding both the structure of this region and fixed is equivalent to holding fixed in a model that follows the detailed evolution, provided that both follow evolution of the envelope in the same way.
The effects of CBP on stars of different masses or metallicities (particularly low metallicity) can readily be determined once a conventional non-CBP stellar model and radiative-zone structure are obtained from conventional codes.
Appendix A Reaction Rate Uncertainties
Most of the reaction rates used in this paper are known to within 5–40%, according to the NACRE evaluation (Angulo et al. 1999). There are a few cases of larger uncertainty, which we now examine. In cases where more or less reliable error estimates exist, the NACRE upper and lower limits to the reaction rates are often found by multiplying by two the size of the statistical error bars one derives directly from the experimental reports. We consider the rates at a temperature of as representative of the crucial temperature range.
First, the NACRE compilation quotes uncertainties of a factor of two for the rate of . This affects only the rate of 18O destruction at low ( K). Above this temperature, increasing the destruction rate changes nothing because even with the recommended rates, a single pass through the radiative zone suffices to greatly reduce the 18O abundance in the circulating matter. Likewise, decreasing this rate will have no effect as long as the lower rate still suffices to destroy all 18O in a single pass; the threshold for this condition is also about K. Below , factor-of-two changes in the 18O-destruction rate translate into factor-of-two changes in the final 18O/16O.
The most important uncertainties are those concerning reactions which produce and destroy 26Al. The NACRE compilation quotes upper and lower limits for the rate of which are a factor of 47 higher and a factor of 86 lower, respectively, than the recommended rate. It should be kept in mind that the NACRE recommended rate at these temperatures was determined mainly by setting resonance strengths to be 1/10 of upper limits derived from the shell-model calculation of Champagne, Brown & Sherr (1993; these are considerably lower than the experimental upper limits). Changing from the NACRE recommended rate to the NACRE upper-limit rate reduces the equilibrium 26Al/25Mg in circulating material from near 100 to around unity. As a result, low then allows this ratio to equilibrate in the circulating material, so that the proportionality of 26Al production to in Eqn. 4 breaks down, and the amount of 26Al returning to the surface becomes both lower and independent of . Although the final 26Al/27Al in the envelope is smaller in this case, it still remains high enough to account for all oxide grains with only a very slight increase in the maximum .
The rate of the 26Al production reaction, , is quoted with an upper limit 75% above the recommended rate and a lower limit 41% below the recommended rate. The NACRE rate and uncertainties for this reaction are based on resonance strengths extracted by Iliadis et al. (1996) from pre-existing data using improved DWBA methods. Except at /yr, where the independence of the envelope 26Al enrichment rate from breaks down, the result of varying the rate within the NACRE limits is to scale the final 26Al/27Al downward by as much as 40% or upward by up to 75%.
The only other large uncertainties (greater than a factor of two) in the reaction rates included in our code are for the 27Al-producing and -destroying reactions , , and . The first of these reactions has an upper limit in the NACRE compilation which is 15 times the recommended rate (derived mainly from experimental work by Champagne et al. 1990) and a lower limit which is 1/27 the recommended rate. The upper and lower limits to the destruction rate differ from the recommended rate by factors of 10 and 5, respectively. To examine the allowed effect on 26Al/27Al due to 27Al production and destruction (which is negligible when using the recommended rates), we ran models with all of the 27Al-producing reaction rates (including the 26Al-destroying set to the NACRE upper limits and the 27Al-destroying reaction rates set to their NACRE lower limits. This made virtually no difference to the final 26Al/27Al beyond the effects of on 26Al production described above. The corresponding calculation with the limits switched to minimize the final 27Al abundance showed no significant difference from that using the recommended rates.
References
- (1) Alexander, C. M. O. & Nittler, L. R., 1999, ApJ 519, 222
- (2) Amari, S., Gao, X., Nittler, L. R., Zinner, E., José, J., Hernanz, M. & Lewis, R. S. 2001c, ApJ 551, 1065
- (3) Amari, S., Lewis, R. S. & Anders, E. 1994, Geochim. Cosmochim. Acta, 58, 459
- (4) Amari, S., Nittler, L. R., Zinner, E., Gallino, R., Lugaro, M. & Lewis, R. S. 2001a ApJ 546, 248
- (5) Amari, S., Nittler, L. R., Zinner, E., Lodders, K & Lewis, R. S. 2001b ApJ 559, 463
- (6) Angulo et al. 1999 Nucl. Phys. A656, 3
- (7) Arnould, M. and Prantzos, N. 1999, New Astronomy 4, 283
- (8) Balser, D. S., Bania, T. M., Rood, R. T., & Wilson, T. L. 1998, ApJ, 510, 759–783
- (9) Bania, T. M., Rood, R. T. & Balser, D. S.2002, Nature 415, 54
- (10) Binney, J. & Merrifield, M. 1998, Galactic Astronomy (Princeton: Princeton University Press)
- (11) Blackmon, J. C., Champagne, A. E., Hofstee, M. A., Smith, M. S., Downing, R. G. & Lamaze, G. P. 1995, Phys. Rev. Lett. 74, 2642
- (12) Boothroyd, A.I., Sackmann, I.-J. & Wasserburg, G. J. 1994, ApJ 430, L77
- (13) Boothroyd, A. I., Sackmann, I.-J. & Wasserburg, G. J. 1995, ApJ 442, L21
- (14) Boothroyd, A.I. & Sackmann, I.-J. 1999, ApJ 510, 232
- (15) Busso, M., Gallino, R., Lambert, D.L., Travaglio, C., Smith, V.V. 2001, ApJ 557, 802.
- (16) Busso, M., Gallino, R. & Wasserburg, G. J. 1999, ARAA 37, 239 (BGW99)
- (17) Cavallo, R., Sweigart, A., Bell, R. 1998, ApJ 492, 575
- (18) Champagne, A. E., Brown, B. A & Sherr 1993, Nucl. Phys. A556, 123
- (19) Champagne, A. E., Magnus, P. V., Smith, M. S. and Howard, A. J. 1990, Nucl. Phys. A512, 317
- (20) Champagne, A. E. & Pitt, M. L. 1986 Nucl. Phys. A457, 367
- (21) Charbonnel, C., Brown, J. A. & Wallerstein, G. 1998, A&A 332, 204
- (22) Charbonnel, C. 1995, ApJ 453, L41
- (23) Chin, Y.-N., Henkel, C., Langer, N. & Mauersberger, R. 1999, ApJ 512, L143
- (24) Choi, B.-G., Huss, G. R., Wasserburg, G. J. & Gallino, R. 1998, Science 282, 1284
- (25) Choi, B.-G., Wasserburg, G. J. & Huss, G. R. 1999, ApJ 522, 133
- (26) Corradi, R. L. M. & Schwarz, H. E. 1995, A&A 293, 871
- (27) Da Costa G.S. 1998, in “Fundamental Stellar Properties: the interaction between observation and theory”, Bedding, T.R., Booth, A.J. & Bavis (J) eds. IAU Symp. 189, Kluwer: Dordrecht, p. 193
- (28) Dearborn, D. S. P. 1992, Phys. Report 210, 367
- (29) Dearborn, D. S. P., Lee, T. & Wasserburg, G. J. 1989, Proc. Lunar Planet. Sci. Conf. 19, 257
- (30) Denissenkov, P. A., Da Costa, G. S., Norris, J. E. & Weiss, A. 1998, A&A 333, 926
- (31) Denissenkov, P.A. & Weiss, A. 1996, A&A 308, 773
- (32) Denissenkov, P.A. and Weiss, A.. 2001, ApJ 559, L115
- (33) Diehl, R and Timmes, F. 1998, PASP 110, 637
- (34) Drilling, J. S. and Schönberner, D. 1985, A&A 146, L23
- (35) El Eid, M. 1994, A&A 285, 915
- (36) Forestini, M., Arnould, M., & Paulus, G. 1991, A&A 252, 597
- (37) Frost C. A., Cannon R. C., Lattanzio J. C., Wood P. R., & Forestini M. 1998, A&A 332, L17
- (38) Gallino, R., Arlandini, C., Busso, M., Lugaro, M., Travaglio, C., Straniero, O., Chieffi, A., and Limongi, M. 1998, ApJ 497, 388
- (39) Gallino, R., Busso, M. & Lugaro, M. 1997, in AIP Conf. Proc. 402, Astrophysical Implications of the Laboratory Study of Presolar Materials, ed. T. J. Bernatowicz & E. Zinner (New York:AIP), 115
- (40) Gallino, R., Raiteri, C. M., Busso, M. & Matteucci, F. 1994, ApJ 430, 858
- (41) Gehrz, R. D., Truran, J. W., Williams, R. E. & Starrfield, S. 1998, PASP 110, 3
- (42) Gilroy, K.K., & Brown, J.A. 1991, ApJ 371, 578
- (43) Gloeckler, J. & Geiss, G. 1998, Space Sci. Rev. 84, 239
- (44) Gratton, R., Sneden, C., Caretta, E., & Bragaglia, A. 2000, A&A 354, 169
- (45) Harris, M. J., Lambert, D. L., Hinkle, K. H., Gustafsson, B. & Eriksson, K. 1987, ApJ, 316, 294
- (46) Harris, M. J., Lambert, D. L. & Smith, V. V 1985, ApJ, 299, 375
- (47) Herwig, F., Blöcker, T., Schönberner, D., & El Eid, M. 1997, A&A 324, L81
- (48) Hoppe, P., Amari, S., Zinner, E., Ireland, T. & Lewis, R. S. 1994, ApJ 430, 870
- (49) Hoppe, P. & Ott, U. 1997 in AIP Conf. Proc. 402, Astrophysical Implications of the Laboratory Study of Presolar Materials, ed. T. J. Bernatowicz & E. Zinner (New York:AIP), 27
- (50) Huss, G. R., Fahey, A. J., Gallino, R. & Wasserburg, G. J 1994, ApJ 430, L81
- (51) Huss, G. R., Hutcheon, I. D. & Wasserburg, G. J. 1997 Geochim. Cosmochim. Acta 61, 5117
- (52) Hutcheon, I. D., Huss, G. R., Fahey, A. & Wasserburg, G. J. 1994, ApJ 425, L97
- (53) Iben, I. Jr. & Renzini, A. 1983, ARAA 21, 271
- (54) Iliadis, C., Buchmann, L, Endt, P. M., Herndl, H. & Wiescher, M. 1996, Phys. Rev. C 53, 475
- (55) Kahane, C., Cernicharo, J., Gómez-González, J. & Guélin, M. 1992, A&A, 256, 235
- (56) Knödlseder, J., Prantzos, N., Bennett, K., Bloemen, H., Diehl, R., Hermsen, W., Oberlack, U., Ryan, J. & Schönfelder, V. 1996 A&AS 120, 335
- (57) Knödlseder, J., Bennett, K., Bloemen, H., Diehl, R., Hermsen, W. , Oberlack, U., Ryan, J., Schönfelder, V., & von Ballmoos, P. 1999, A&A 344, 68
- (58) Kraft R.P. 1994, PASP 106, 553
- (59) Langer, G.E., Hoffman, R.D., Sneden, C. 1993, PASP 105, 301
- (60) Lattanzio, J. C. 2001, Stellar Evolution Tutorial
- (61) Lattanzio, J. C. & Forestini M. 1999, in IAU Symp. 191, Asymptotic Giant Branch Stars, ed. T. LeBertre, A. Lèbre & C. Waelkens (San Francisco:ASP) p. 447
- (62) Lattanzio, J., Forestini, M. & Charbonnel, C. 2000, Mem. Soc. Astron. Italia 71, 737, astro-ph/9912298
- (63) Lee, T., Papanastassiou, D., & Wasserburg, G. J. 1977, ApJ 211, L107
- (64) Maeder, A. & Zahn, J.P. 1998, A&A 334, 1000
- (65) Mahoney, W. A., Ling, J. C., Wheaton, Wm. A. & Jacobson, A. S. 1984, ApJ 286, 578
- (66) Messenger, B. 2000, Ph.D. Thesis, Monash University
- (67) Mowlavi, N. & Meynet G. 2000, A&A 361, 959
- (68) Nicolussi, G. K., Davis, A. M., Pellin, M. J., Lewis, R. S., Clayton, R. N. & Amari, S. 1997, Science 277, 1281
- (69) Nicolussi, G. K., Pellin, M. F., Lewis, R. S., Davis, A. M., Amari, S. & Clayton, R. N. 1998, Gechim. Cosmochim. Acta 62, 1093
- (70) Nittler, L.R., Alexander, C. M. O’D., Gao, X., Walker, R. M. & Zinner, E 1994, Nature 370, 443
- (71) Nittler, L.R., Alexander, C. M. O’D., Gao, X., Walker, R. M. & Zinner, E. 1997, ApJ 483, 475
- (72) Nittler, L.R., Alexander, C. M. O’D., Wang, J. & Gao, X. 1998, Nature 393, 222
- (73) Nittler, L. R. & Cowsik, R. 1996, Meteoritics & Planetary Sci. 31, A100
- (74) Nittler, L. R. & Cowsik, R. 1997, Phys. Rev. Lett 78, 175
- (75) Peimbert, M. & Serrano, A. 1980, Rev. Mex. Astron. y Astrof. 5, 9
- (76) Pellin, M. J., Calaway, W. F., Davis, A. M., Lewis, R. S., Amari, S. & Clayton, R. N. 2000, Proc. Lunar Planet. Sci. Conf. 31, 1917
- (77) Penzias, A. A. 1981, ApJ 249, 518
- (78) Péquignot, D., Walsh, J. R., Zijltra, A. A., & Didziak, G. 2000, A&A 361, L1
- (79) Reimers, D. 1975, in Problems in Stellar Atmospheres and Envelopes, ed. A. Unsöld, B. Baschek, W. H. Kegel, & G. Traving (Berlin:Sprinter), 229
- (80) Sackmann, I.-J. & Boothroyd, A. I. 1999, ApJ 510, 217
- (81) Starrfield, S., Iliadis, C., Truran, J. W., Wiescher, M. & Sparks, W. M. 2001, Nucl. Phys. A688, 110c
- (82) Straniero, O., Chieffi, A., Limongi, M., Busso, M., Gallino, R. & Arlandini, C. 1997, ApJ 478, 332
- (83) Sweigart, A. V. 1997, ApJ 474, L23
- (84) Sweigart, A. V. & Mengel, J. G. 1979, ApJ 229, 624
- (85) Timmes, F. X. & Clayton, D. D., 1996 ApJ 472, 723
- (86) van den Hoek, L.B. & Groenewegen, M.A.T. 1997, A&AS 123, 305
- (87) Wasserburg, G. J., Busso, M., Gallino, R. & Raiteri, C. M. 1994, ApJ 424, 412
- (88) Wasserburg, G. J., Boothroyd, A. I. & Sackmann, I.-J. 1995, ApJ 447, L37 (WBS)
- (89) Wasserburg, G. J., Gallino, R., Busso, M., Goswami, J. N. & Raiteri, C. M. 1995, ApJ 440, L101
- (90) Weiss, A., Denissenkov, P.A. & Charbonnel, C. 2000, A&A 356, 181
- (91) Wilson, T. L. & Rood, R. T. 1994, ARA&A 32, 191
- (92) Zahn, J.P. 1992, A&A 265, 115