Radio sources in the 2dF Galaxy Redshift Survey: AGN, starburst galaxies and their cosmic evolution
Abstract
Radio continuum surveys can detect galaxies over a very wide range in redshift, making them powerful tools for studying the distant universe. Until recently, though, identifying the optical counterparts of faint radio sources and measuring their redshifts was a slow and laborious process which could only be carried out for relatively small samples of galaxies.
Combining data from all–sky radio continuum surveys with optical spectra from the new large–area redshift surveys now makes it possible to measure redshifts for tens of thousands of radio–emitting galaxies, as well as determining unambiguously whether the radio emission in each galaxy arises mainly from an active nucleus (AGN) or from processes related to star formation. Here we present some results from a recent study of radio–source populations in the 2dF Galaxy Redshift Survey, including a new derivation of the local star–formation density, and discuss the prospects for future studies of galaxy evolution using both radio and optical data.
School of Physics, University of Sydney, NSW 2006, Australia
Research School of Astronomy and Astrophysics, The Australian National University, Weston Creek, ACT 2611, Australia
Anglo–Australian Observatory, PO Box 296, Epping, NSW 2121, Australia
1. Introduction
Most astronomical objects evolve on timescales which are orders of magnitude longer than a human lifetime, so that we effectively view them frozen at a single moment in their life cycle and at a fixed orientation. To piece together the evolutionary history of such objects, we therefore need to observe a sample which is large enough to cover the full range of luminosity, size, age and orientation which exists in nature.
Advances in technology and data processing power mean that surveys of very large numbers of astronomical objects are now becoming feasible. Van den Bergh (2000) recently concluded that “.. the astronomy of the twenty–first century will be dominated by computer–based manipulation of huge homogeneous surveys of various types of astronomical objects…”.
The powerful radio emission from some galaxies acts as a beacon which allows them to be seen at very large distances (the median redshift of galaxies detected in radio surveys is typically ; Condon 1989). Radio source counts can be used to study the cosmological evolution of active galaxies (e.g. Longair 1966, Jauncey 1975, Wall et al. 1980) but their interpretation is strongly model–dependent. This is especially true at the faint flux densities probed by the new generation of all-sky radio imaging surveys (NVSS, Condon et al. 1998; FIRST, Becker, White & Helfand 1995; WENSS, Rengelink et al. 1997; SUMSS, Bock, Large & Sadler 1999), where AGN and ‘normal’ star–forming galaxies both contibute significantly (e.g. Condon 1989, 1992).
The scientific return from
large radio surveys is enormously increased if the optical counterparts
of the radio sources can be identified, their optical spectra classified
(as AGN, starburst galaxy, etc.) and their redshift distribution measured.
Here, we describe some first results from a study of radio–source populations
in the 2dF Galaxy Redshift Survey. Much of this work is discussed in more
detail in Sadler et al. (1999, 2002).
2. The 2dF Galaxy Redshift Survey
The 2dF Galaxy Redshift Survey (2dFGRS) is described by Colless et al. (2001), and has also been discussed at this meeting by Peterson. It used two multi–fibre spectrographs at the prime focus of the 4 m Anglo–Australian Telescope (AAT) to measure redshifts for more than 220,000 galaxies in 1700 deg2 of sky. The main goal of the 2dFGRS team was to study large–scale struture over the redshift range to 0.2, but the high quality of the spectra in the public 2dFGRS database means that they have also been used for many other studies, such as measuring optical luminosity functions for galaxies of different Hubble types (Madgwick et al. 2002) and examining the effects of environment on the star formation rate in galaxies (Lewis et al. 2002).
3. Radio imaging surveys in the 2dFGRS area
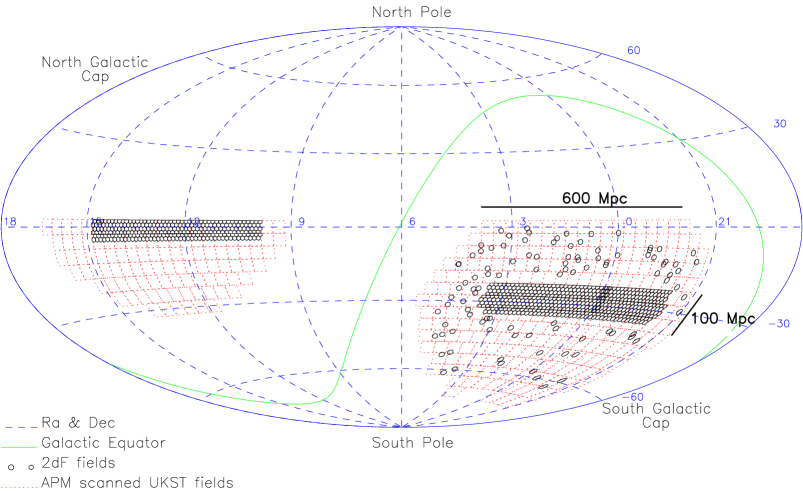
The 1.4 GHz NRAO VLA Sky Survey (NVSS; Condon et al. 1998) overlaps both the 2dFGRS strips shown in Figure 1, and the southern (dec ) part of the SGP strip is also covered by the 843 MHz Sydney University Molonglo Sky Survey (SUMSS, Bock et al. 1999). Part of the northern 2dFGRS strip is overlapped by the higher–resolution 1.4 GHz FIRST survey (Becker et al. 1995), and the properties of the faint 2dFGRS radio sources in this region have been discussed by Magliocchetti et al. (2002).
NVSS and SUMSS have similar resolution ( arcsec) and sensitivity, so in the overlap declination zone to they can be combined to measure a radio spectral index for sources in common (see Figure 2). The NVSS and SUMSS source positions are also accurate enough that we can make unambiguous optical identifications down to at least B mag.

The NVSS source density is 60 deg-2 above 2.5 mJy, and the typical 2dFGRS galaxy density is 180 deg-2 above the survey cutoff magnitude of . The intersection of the two surveys is small, with less than 1.5% of the 2dFGRS galaxies detected as radio sources by NVSS (see Table 1), but the size of the 2dFGRS means that this is still the largest and most homogeneous set of optical spectra of radio galaxies so far observed.

4. Radio source populations in the 2dFGRS
2dFGRS spectra of each of the radio–source IDs were classified visually as either ‘AGN’ or ‘star–forming’ (SF). AGN galaxies have either (i) an absorption–line spectrum like that of a giant elliptical galaxy, (ii) an absorption–line spectrum with weak LINER–like emission lines, or (iii) a stellar continuum dominated by nebular emission lines such as [OII] and [OIII] which are strong compared with any Balmer–line emission. In SF galaxies, strong, narrow emission lines of H and (usually) H dominate the spectrum.
As can be seen from Table 1, the 2dFGRS radio–source population is a roughly equal mixture of star–forming and active galaxies. The two classes overlap in radio luminosity (though the active galaxies are on average both more distant and more luminous), and in many cases can only be distinguished by examining their optical spectra. Because both populations are well–represented in the 2dFGRS/NVSS data set, we can measure accurate radio luminosity functions for both AGN and star–forming galaxies as a local benchmark for future studies at higher redshift.
| Analysed so far: | |
|---|---|
| 58,454 | 2dFGRS spectra (25% of total) |
| 757 | matched with NVSS radio sources (1.3%) |
| 441 | radio galaxies (=AGN) |
| 272 | star–forming galaxies (=IRAS galaxies) |
| 44 | unclassified spectra (low S/N) |
4.1. Star–forming galaxies
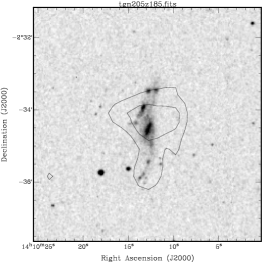
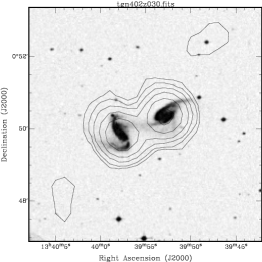
The 1.4 GHz radio emission from star–forming galaxies has both a thermal component from individual HII regions and a (dominant) large–scale non–thermal component arising from synchrotron emission in the disk (Condon 1992). Figure 4 shows two star–forming 2dFGRS galaxies which were also detected as NVSS radio sources.
Most of the star–forming 2dFGRS galaxies are also detected as far–infrared (FIR) sources in the IRAS Faint Source Catalogue (FSC: Moshir et al. 1990) and follow the well–known FIR–radio correlation (e.g. de Jong et al. 1985; Helou, Soifer & Rowan–Robinson 1985). The radio luminosity of these galaxies gives an independent estimate of their current star–formation rate (e.g. Sullivan et al. 2001), and by integrating over the radio luminosity function for 2dFGRS/NVSS galaxies we can estimate the star–formation density in the local universe in a way which is unaffected by dust.


The integrated star–formation density of M⊙ yr-1 Mpc-3 derived from the 2dFGRS radio data (Sadler et al. 2002) is slightly higher than the value of derived optically by Gallego et al. (1995). The main reason for the difference is that the 2dF sample has an excess of galaxies with star formation rates above 50 M⊙ yr-1 (see Figure 5). Condon, Cotton & Broderick (2002) suggest that this difference is due to evolution of the galaxies with the highest star–formation rates within the 2dFGRS sample volume. They also note that the data are consistent with luminosity evolution of the form for star–forming galaxies.
4.2. Active galaxies
The radio luminosity function of 2dFGRS active galaxies (see Figure 5) has a power–law spectrum of the form over almost five decades in radio luminosity from 1020.5 to 1025 W Hz-1.
Franceschini, Vercellone & Fabian (1998) examined the relation between galaxy luminosity, black hole mass and radio power in nearby active galaxies, and concluded that the radio power of an AGN is both a good indicator of the presence of a supermassive black hole and an estimator of its mass; though Laor (2000) noted that the correlation between radio power and black hole mass has a large scatter. Using a larger data set, Snellen et al. (2002) confirm the relation found by Francescini et al. (1998) but note that it applies only for “relatively passive” elliptical galaxies (i.e. those with radio powers below W Hz-1).
If we apply the relation found by Francescini et al. to the 2dFGRS active galaxies, we derive a value of for the total mass density of supermassive (M M⊙) black holes in the local universe. This is close to the value of derived for QSOs by Chokshi & Turner (1992), suggesting that local low–power radio galaxies may be the remnants of most or all of the high–redshift QSOs.
5. PKS 0019–338, a post–starburst radio galaxy
Among the 2dFGRS radio galaxies, we recently discovered the remarkable object PKS 0019–338 at . Its optical spectrum (Figure 6) shows both strong emission lines characteristic of an AGN and an underlying blue stellar continuum with strong hydrogen Balmer–line absorption. The strength of the H absorption line implies that this galaxy had a massive starburst which finished only years ago (K. Bekki & W.J. Couch, private communication).
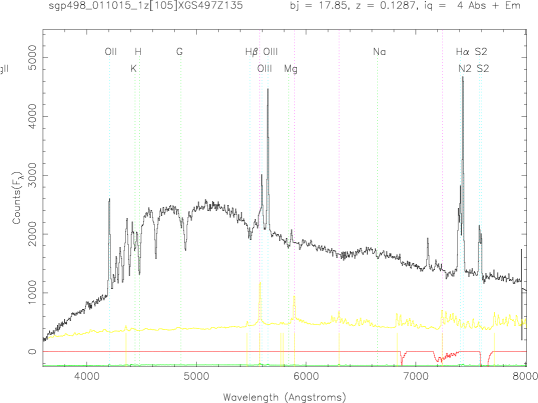
PKS 0019–338 belongs to the class of ‘eA’ galaxies, with an old stellar population overlaid with a substantial younger population created in a massive starburst much less than 1 Gyr ago (e.g. Dressler & Gunn 1983; Zabludoff et al. 1996). The radio source lies within the optical galaxy and has a steep () sepctrum, placing it in the class of compact steep–spectrum (CSS) radio galaxies. This implies an age of less than 106 years for the radio source (e.g. de Silva et al. 1999). If the starburst and AGN in this galaxy are causally connected, there is a large time lag ( years) between the peak of the starburst and the onset of radio emission.
6. Future work
We have so far analysed only 25% of the 2dFGRS radio sample. Adding the rest will give us a large enough sample to measure the evolution of both AGN and star–forming galaxies out to . The 6dF Galaxy Survey described at this meeting by Wakamatsu (see also Watson et al. 2001) will yield roughly 12,000 more radio–source spectra to , allowing a detailed investigation of the faint end of the radio luminosity function, and will also have high enough resolution to measure stellar velocity dispersions. By using the velocity dispersion as an independent measure of the mass of the central black hole, we should be able to investigate in more detail the correlation between black hole mass and radio power in nearby elliptical galaxies.
Acknowledgments.
EMS thanks the meeting organisers for financial support, and Dr Kenji Bekki and Prof. Warrick Couch for helpful discussions on the ages of ‘post–starburst’ galaxies.
References
Becker, R.H., White, R.L., Helfand, D.J. 1995, ApJ, 450, 559
Bock, D.C-J., Large, M.I., Sadler, E.M. 1999, AJ, 117, 1593
Chokshi, A., Turner, E.L. 1992, MNRAS, 259, 421
Colless, M. et al. 2001, MNRAS, 328, 1039
Condon, J.J. 1989, ApJ, 338, 13
Condon, J.J. 1992, ARAA, 30, 575
Condon, J.J., Cotton, W.D., Greisen, E.W., Yin, Q.F., Perley, R.A., Taylor, G.B., Broderick, J.J. 1998, AJ, 115, 1693
Condon, J.J, Cotton, W.D., Broderick, J.J. 2002, AJ, 124, 675
de Jong, T., Klein, U., Wielebinski, R., Wunderlich, E. 1985, A&A, 147, L6
de Silva, E., Saunders, R., Baker, J., Hunstead, R. 1999. In The Hy-Redshift Universe, ed. A. J. Bunker & W.J.M. van Breugel, ASP Conference Series, p. 79
Dressler, A., Gunn, J.E. 1983, ApJ 270, 7
Franceschini, A., Vercellone, S., Fabian, A.C. 1998, MNRAS, 297, 817
Gallego, J., Zamorano, J., Aragon–Salamanca, A., Rego, M. 1995, MNRAS, 455, L1
Helou, G., Soifer, B.T., Rowan–Robinson, M. 1985, ApJ, 298, L7
Jauncey, D.L. 1975, ARAA, 13, 23
Laor, A. 2000, ApJ, 543, L111
Lewis, I. et al. 2002, MNRAS, 334, 673
Longair, M.S. 1966, MNRAS, 133, 421
Madgwick, D.S. et al. 2002, MNRAS, 333, 133
Magliocchetti, M. et al. 2002, MNRAS, 333, 100
Mauch, T. et al. 2002, in preparation
Moshir, M., et al. 1990, IRAS Faint Source Catalogue Version 2.0
Rengelink, R.B., Tang, Y., de Bruyn, A.G., Miley, G.K., Bremer, M.N., Röttgering, H.J.A., Bremer, M.A.R. 1997, A&AS, 124, 259
Sadler, E.M., Jenkins, C.R., Kotanyi, C.G. 1989, MNRAS, 240, 591
Sadler, E.M., McIntyre, V.J., Jackson, C.A., Cannon, R.D. 1999, PASA, 16, 247
Sadler, E.M. et al. 2002, MNRAS, 329, 227
Snellen, I.A.G., Lehnert, M.D., Bremer, M.N., Schilizzi, R. 2002, MNRAS, submitted (astro–ph/0209380)
Sullivan, M., Mobasher, B., Chan, B., Cram, L., Ellis, R., Treyer, M., Hopkins, A. 2001, ApJ, 558, 72
van den Bergh, S. 2000, PASP, 112, 4
Wall, J.V., Pearson, T.J., Longair, M.S. 1980, MNRAS, 193, 683
Watson, F.G. et al. 2001. In The New Era of Wide Field Astronomy, ed. R. Clowes, A. Adamson & G. Bromage, ASP Conference Series, p. 421
Zabludoff, A.I. et al. 1996, ApJ 466, 104