A Search for H2 Outflow Signatures from Massive Star Formation Regions Containing Linearly Distributed Methanol Masers
Abstract
I present here the summary of results from a survey by De Buizer (2003) searching for outflows using near-infrared imaging. Targets were massive young stellar objects associated with methanol masers in linear distributions. Presently, it is a widely held belief that these methanol masers are found in (and delineate) circumstellar accretion disks around massive stars. A way to test the disk hypothesis is to search for outflow signatures perpendicular to the methanol maser distributions. The main objective of the survey was to obtain wide-field near-infrared images of the sites of linearly distributed methanol masers using a narrow-band 2.12 m filter which is centered on the H2 =1–0 S(1) line. This line is a shock diagnostic that has been shown to successfully trace CO outflows from young stellar objects. Twenty-eight sources in total were imaged with eighteen sources displaying H2 emission. Of these, only two sources showed emission found to be dominantly perpendicular to the methanol maser distribution. These results seriously question the hypothesis that methanol masers exist in circumstellar disks.
keywords:
masers – stars: formation – ISM: lines and bands – ISM: molecules – infrared: ISM1 Introduction
| Target | IRAS Name | Right Ascension | Declination | Maser | H2 |
|---|---|---|---|---|---|
| (J2000) | (J2000) | p.a. | |||
| G305.21+0.21 | 13079-6218 | 13 11 13.72 | -62 34 41.6 | 25\degr | parallel? |
| G308.918+0.123 | 13395-6153 | 13 43 01.75 | -62 08 51.3 | 137\degr | parallel |
| G309.92+0.48 | 13471-6120 | 13 50 41.76 | -61 35 10.1 | 30\degr | no detection |
| G312.11+0.26 | 14050-6056 | 14 08 49.30 | -61 13 26.0 | 166\degr | no detection |
| G313.77-0.86 | 14212-6131 | 14 25 01.62 | -61 44 58.1 | 135\degr | parallel |
| G316.81-0.06 | 14416-5937 | 14 45 26.44 | -59 49 16.4 | 1\degr | not outflow |
| G318.95-0.20 | 15 00 55.40 | -58 58 53.0 | 151\degr | parallel | |
| G320.23-0.28 | 15061-5814 | 15 09 51.95 | -58 25 38.1 | 86\degr | parallel |
| G321.031-0.484 | 15122-5801 | 15 15 51.64 | -58 11 17.4 | 0\degr | parallel? |
| G321.034-0.483 | 15122-5801 | 15 15 52.52 | -58 11 07.2 | 85\degr | parallel? |
| G327.120+0.511 | 15437-5343 | 15 47 32.71 | -53 52 38.5 | 150\degr | no detection |
| G327.402+0.445 | 15454-5335 | 15 49 19.50 | -53 45 13.9 | 62\degr | no detection |
| G328.81+0.63 | 15520-5234 | 15 55 48.61 | -52 43 06.2 | 86\degr | parallel |
| G331.132-0.244 | 16071-5142 | 16 10 59.74 | -51 50 22.7 | 90\degr | parallel |
| G331.28-0.19 | 16076-5134 | 16 11 26.60 | -51 41 56.6 | 166\degr | perpendicular |
| G335.789+0.174 | 16 29 47.33 | -48 15 52.4 | 136\degr | parallel? | |
| G336.43-0.26 | 16303-4758 | 16 34 20.34 | -48 05 32.5 | 163\degr | no detection |
| G337.705-0.053 | 16348-4654 | 16 38 29.61 | -47 00 35.7 | 137\degr | no detection |
| G339.88-1.26 | 16484-4603 | 16 52 04.66 | -46 08 34.2 | 137\degr | ? |
| G339.95-0.54 | 16455-4531 | 16 49 07.99 | -45 37 58.5 | 122\degr | no detection |
| G344.23-0.57 | 17006-4215 | 17 04 07.70 | -42 18 39.1 | 117\degr | no detection |
| G345.01+1.79 | 16533-4009 | 16 56 47.56 | -40 14 26.2 | 78\degr | parallel? |
| G345.01+1.80 | 16533-4009 | 16 56 46.80 | -40 14 09.1 | 30\degr | parallel? |
| G348.71-1.04 | 17167-3854 | 17 20 04.02 | -38 58 30.0 | 152\degr | not outflow |
| G353.410-0.360 | 17271-3439 | 17 30 26.17 | -34 41 45.6 | 153\degr | not outflow |
| G00.70-0.04 | 17441-2822 | 17 47 24.74 | -28 21 43.7 | 51\degr | no detection |
| G10.47-0.03 | 18056-1952 | 18 08 38.21 | -19 51 49.6 | 98\degr | no detection |
| G11.50-1.49 | 18134-1942 | 18 16 22.13 | -19 41 27.3 | 174\degr | perpendicular |
Methanol maser emission has been well studied in the last decade and is thought to be a good indicator of recent massive star formation. These masers occur in spatially localized regions or spots and serve as powerful probes of the small-scale structure, dynamics, and physical conditions of the environments near forming stars. Radio observations by Norris et al. (1993) first showed that methanol (CH3OH) maser spots are frequently distributed in linear structures, with projected dimensions typically spanning 2500 AU. Furthermore, some of these linearly distributed methanol masers exhibit a gradient in velocity along the spot distribution. Norris et al. (1993) argue that such a velocity gradient is indicative of orbital motion, and suggest that these methanol maser spots occur in, and directly delineate, rotating circumstellar disks. Several authors have written papers on radio studies of these methanol masers and their motions (e.g. Norris et al. 1998; Phillips et al. 1998; Minier, Booth & Conway 2000) trying to decipher from this limited data the mass of the central protostars and sizes of circumstellar disks in which these methanol masers reside.
But do methanol masers really trace disks? More proof is needed than a line of masers displaying (perhaps) orbital motion. Direct detection of these disks would certainly be conclusive, however observations have proven to be problematic. Observations in the near-infrared suffer from the great extinction towards these regions. It has also been argued that in the mid-infrared it is difficult to tell if one is observing dust emission from a circumstellar accretion disk or dust emission from the placental envelope (Vinković et al. 2000). The far-infrared and sub-millimeter can probe the cool thermal emission from a dust disk with minimal contamination from the placental envelope, however no far-infrared facility exists that has the sub-arcsecond resolution to observe disks around these sources. Angular resolution presently is a problem for the sub-millimeter as well, however the construction of SMA (Submillimeter Array) and ALMA (Atacama Large Millimeter Array) are underway, and are presently 5 to 10 years away from carrying out these types of observations. Corroborative evidence that linearly distributed methanol masers exist in circumstellar disks, therefore, needs to come from something other than direct detection of the accretion disks.
Fortunately, there is an indirect way of testing whether or not linearly distributed methanol masers exist in accretion disks. According to the standard model of accretion, during the phase of stellar formation where the star is being fed by an accretion disk, it is also undergoing mass loss through a bipolar outflow. This bipolar outflow is perpendicular to the plane of the accretion disk, along the axis of rotation. Therefore, one can search these sources of linearly distributed methanol masers for evidence of outflow perpendicular to the methanol maser position angle. Such evidence would create an extremely solid case for the hypothesis that these methanol masers exist in circumstellar disks, without the need for their direct detection.
I present here the results of the survey of De Buizer (2003), the purpose of which was to image the regions around sites of linearly distributed methanol masers in the near-infrared with a narrow-band 2.12 m filter. This filter is centered on the H2 =1–0 S(1) line, which is a shock indicator, and was convincingly shown to successfully trace CO outflows from young stellar objects by Davis & Eislöffel (1995). Each site was also observed with a continuum filter which yields a measure of the continuum-only flux from all the sources in the field. By subtracting the continuum image from the image with the hydrogen line, structures associated only with hydrogen emission emanating from the locations of the methanol masers were found.
2 Summary of Results
The full results of this survey are presented in De Buizer (2003). The target list consisted of 28 sites compiled mostly from the articles by Walsh et al. (1998), Phillips et al. (1998), and Norris et al. (1998). The coordinates for all of these sources are shown in the Table 1. These sites all contain groups of linearly distributed methanol masers, many with velocity gradients along their distributions indicative of rotation, and therefore represent the best circumstellar disk candidates.
Of the 28 maser targets observed by De Buizer (2003), H2 emission was detected from 18 sites (64%). The distribution of the H2 emission from these sites takes on three forms: 1) extended diffuse areas of H2-dominated emission; 2) individual knots or blobs of H2-only emission that range in number, sometimes cometary-shaped; and 3) some combination of extended H2-dominated emission with knots of H2-only sources.
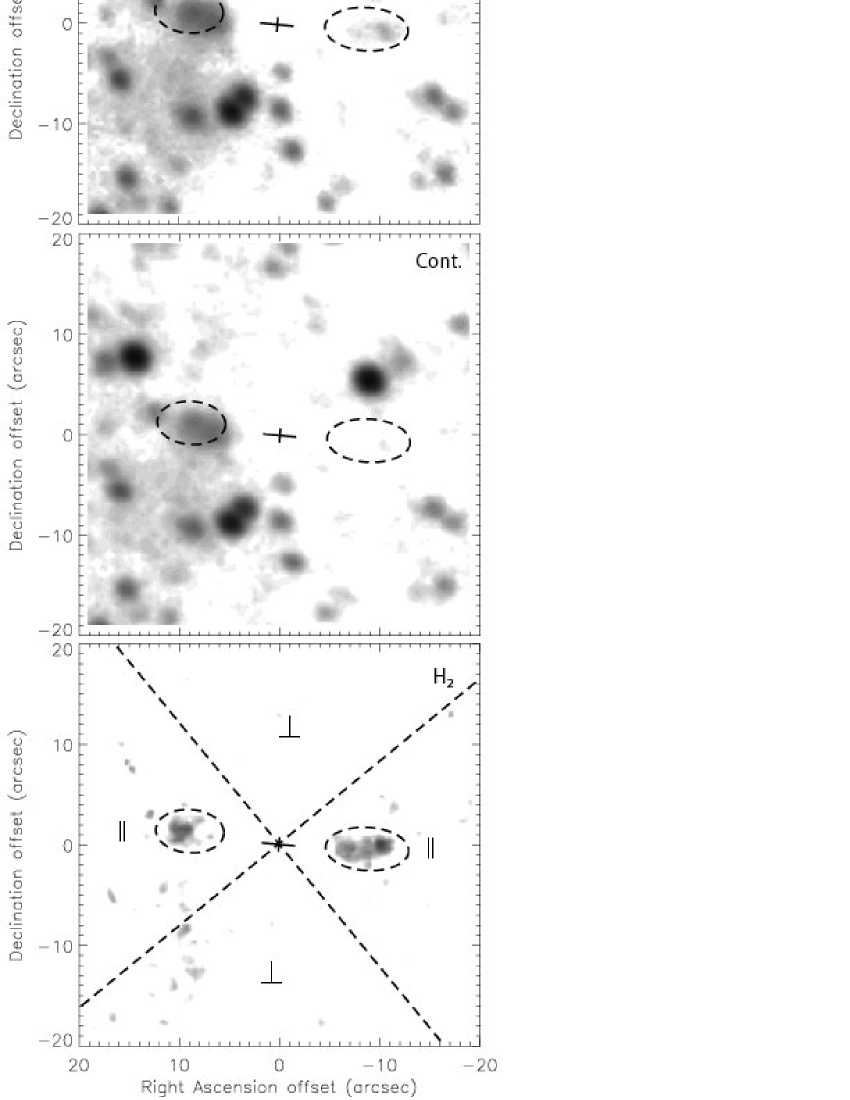
The purpose of these observations was to try to confirm the hypothesis that linearly distributed methanol masers exist in, and directly delineate, circumstellar disks by searching for shock excited H2 outflow signatures perpendicular to the methanol maser position angle. Of the 18 maser locations observed to have H2 emission, only two displayed this morphology. The majority had H2 emission found to be dominantly distributed within 45\degr of being parallel to their maser position angle (see Figure 1 for an example). H2 emission can also be due to UV florescence, so for any one source in this survey, follow-up observations (in say, 12CO or HCO+) would be needed to confirm the outflow nature. However, regardless of the nature of the H2 emission, these results are unequivocally contrary to the circumstellar disk hypothesis. If the H2 emission is indeed from outflows, then a likely explanation is that at least some linearly distributed methanol masers may be directly associated with outflows. The methanol masers appear to be located coincident with a stellar source at the center of the outflows in most cases. Perhaps the masers trace the jets or outflow surfaces near the central (proto-)stellar source.
References
- [\astronciteDavis & Eislöffel1995] Davis, C. J. & Eisloeffel, J. 1995, A&A 300, 851
- [\astronciteDe Buizer2003] De Buizer, J. M. 2003, MNRAS, in press
- [\astronciteMinier, Booth & Conway2000] Minier, V., Booth, R., Conway, J. E. 2000, A&A 362, 1093
- [\astronciteNorris et al.1993] Norris, R. P., Whiteoak, J. B., Caswell, J. L., Wieringa, M. H., Gough, R. G. 1993, ApJ 412, 222
- [\astronciteNorris et al.1998] Norris, R. P., et al. 1998, ApJ 508, 275
- [\astroncitePhillips et al.1998] Phillips, C. J., Norris, R. P., Ellingsen, S. P., McCulloch, P. M. 1998, MNRAS 300, 1131
- [\astronciteVinković et al.2000] Vinković, D., Miroshnichenko, A., Ivezić, Ž., Elitzur, M. 2000, in ASP Conf. Ser. 196, Thermal Emission Spectroscopy and Analysis of Dust, Disks, and Regoliths, ed. M. L. Sitko, A. L. Sprague, & D. K. Lynch (ASP: San Francisco), 71
- [\astronciteWalsh et al.1998] Walsh, A. J., Burton, M. G., Hyland, A. R., Robinson, G. 1998, MNRAS 301, 640