Broadband modeling of GRB 021004
Abstract
We present a broadband modeling of the afterglow of GRB 021004. The optical transient of this burst has been detected very early and densely sampled in several bands. Its light curve shows significant deviations from a simple power law. We use the data from the X-ray to the band gathered in the first month of observations, and examine three models. Two involve variations in the energy of the shock. The first (energy injection) allows only increases to the shock energy, while the second (patchy shell) allows the energy to increase or decrease. In the final model (clumpy medium) the energy of the shock is constant while the density varies. While all three models reproduce well the optical bands, the variable density model can best account for the X-ray data, and the energy-injection model has the poorest fit. None of the models can account for the modest color variations observed during the first few days of the burst.
1 Introduction
The gamma-ray burst GRB 021004 was detected by HETE II at 12:06 UT on the 4th of October 2002 (Shirasaki et al. 2002). Observations after about 9 minutes from the trigger revealed a fading optical transient (Fox 2002), which was densely sampled in several bands, especially at early times. An X-ray counterpart has also been reported by Sako & Harrison (2002).
The afterglow of GRB 021004 has shown several unusual features. Absorption lines from high velocity material have been detected in the spectrum (Mirabal et al. 2002; Salamanca et al. 2002; Moller et al. 2002), evidence of short time scale variability has been presented (Bersier et al. 2002), and the light curves in various bands display significant deviations from a simple power law decay, with several bumps and flattenings. A first, pronounced bump around sec was modeled by Lazzati et al. (2002) with a density contrast in the ambient medium density, while Kobayashi & Zhang (2002) interpreted it as due to emission from the reverse shock. Nakar et al. (2002) fitted the R band data and found that several models provide good fits to the data, both with varying density (at fixed energy) and with varying energy (at fixed density). Determining the appropriate physical model is crucial in order to understand what the progenitors of GRBs are, and the large wealth of data available for GRB 021004 in several bands allows detailed modeling.
In this Letter, we present a modeling of the light curve of GRB 021004 from the X-ray to the band. We find that a model in which the bumps are produced by density fluctuations (and not by energy injection) best accounts for both the optical and the X-ray data. We derive the density profile that best fits the data and discuss its implications for GRB progenitor scenarios.
2 Models
To calculate the emission from the afterglow we have used the models of Sari et al. (1998) as extended by Nakar et al. (2002) for a varying density or energy111Note that these models assume that all of the emission originates along the line of sight. The emission actually comes from a surface of equal arrival times, so the actual lightcurve should be somewhat smoother than predicted by these models.. Although both the energy of the afterglow and the density of the surrounding medium can vary, we will consider a GRB shock whose energy changes while propagating through a wind with a constant mass-loss rate or a constant-density ISM. The calculations show that the former model requires the energy of the shock to increase monotonically so we will call it the “the energy-injection model”. The latter cases requires a shock whose energy varies up and down so we will call it “the patchy-shell model”. The third model we consider is a shock of constant energy traveling through medium with varying density (the clumpy-medium model).
We refer the reader to Nakar et al. (2002) for the necessary equations, and we summarize their results here. If (fast cooling), the flux density is proportional to between and , to below and to above . In both models for the assumed values of the electron and magnetic field energy fractions of 0.1 and 0.01, fast cooling lasts for about the first thousand seconds after the burst; therefore, only the data of Fox (2002) lies in the fast-cooling regime. If (slow cooling), the flux density goes as between and , below and above . passes through the optical and near infrared a few thousand seconds after the burst. On the other hand, changing the energy of the visible portion of the afterglow either through energy injection or a patchiness changes the flux density proportionally at all frequencies.
3 Results
We compare the three models with the broadband optical culled from the GCN and the literature for the first day after the burst (Fox 2002; Uemura et al. 2002; Weidinger et al. 2002; Oksanen et al. 2002; Matsumoto et al. 2002; Barsukova et al. 2002; Klotz et al. 2002; Holland et al. 2002; Pandey et al. 2002), the X-ray data obtained by Sako & Harrison (2002) and reanalyzed ourselves, and the later optical data from Bersier et al. (2002), Holland et al. (2002) and Pandey et al. (2002) . We adjust either the energy injection or the density of the surrounding medium to fit the -band data. The Chandra observations of Sako & Harrison (2002) constrain the electron-injection power-law exponent to be about . Matheson et al. (2002) give a redshift of 2.323 for the optical transient. Assuming the cosmographic parameters and km s-1Mpc-1 yields a luminosity distance of cm to the gamma-ray burst. This distance results in an isotropic energy for the afterglow of about ergs during the Chandra observation Sako & Harrison (2002). We account for the cosmological time dilation and correction.
Because we varied either the energy of the forward shock or the density of the surrounding medium to obtain a good fit to the observations in the band and adjusted the extinction to fix the average flux in the other bands, the key diagnostic between the two models is that density variations only affect the flux between the cooling frequency (Lazzati et al. 2002; Nakar et al. 2002) and and are achromatic in this regime. Variations in the energy change the flux achromatically throughout the near infrared, optical and X-ray regimes.
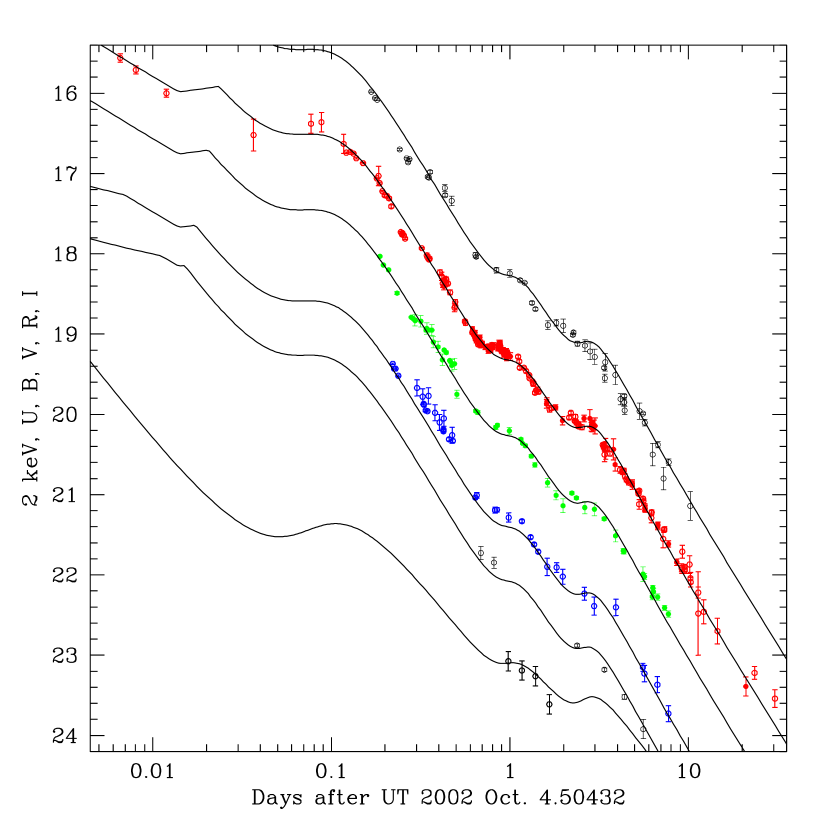
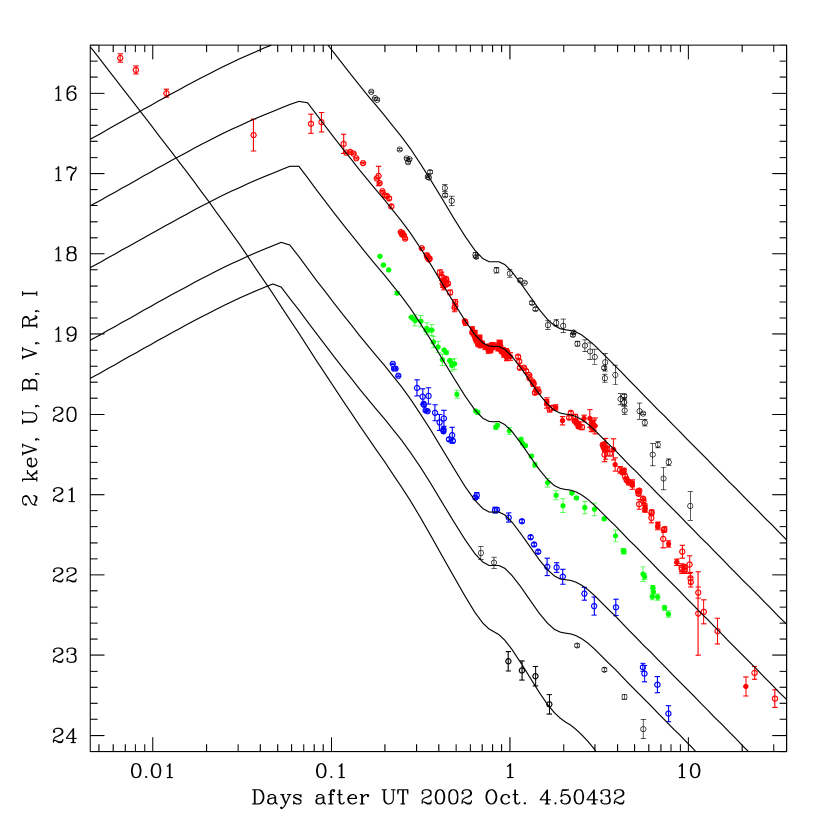
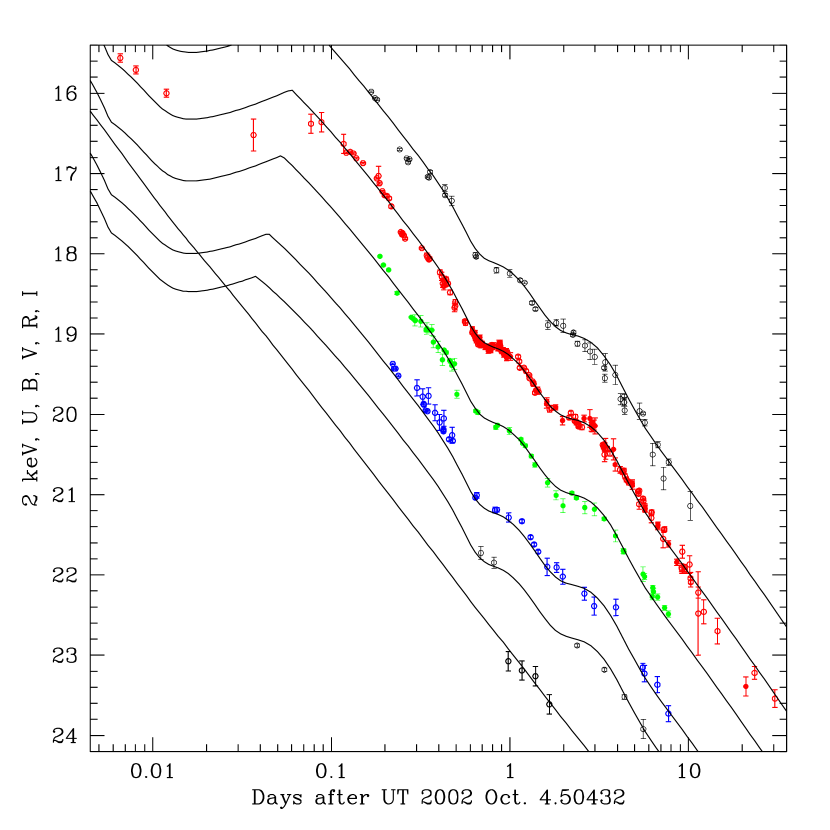
Fig. 1 compares the two energy-variation models with the data from the first month after the burst. For the energy-injection model we have assumed a wind density profile that corresponds to a mass-loss rate of M⊙yr-1, assuming a wind velocity of 1000 km s-1. The local extinction is , where is the local band. The patchy-shell model has a constant density medium with cm-3 and a local extinction of . Fig. 2 depicts the clumpy-medium model. In this model, the isotropic energy of the ejecta is ergs and the local extinction is . This energy agrees with the isotropic energy in gamma rays of the GRB itself (Lamb et al. 2002), ergs if one assumes that twenty-percent of the energy in the ejecta is converted to prompt gamma rays (Frail et al. 2001). For all three models the Galactic value of is taken to be 0.21 in the direction of the burst (Bersier et al. 2002). We used the Milky-Way and LMC extinction models of Pei (1992) to model the Galactic and host dust respectively. For comparison Holland et al. (2002) find using Pei’s SMC model.
All three models provide excellent fits to the optical and near infrared data from one hour until about six days after the burst. The patchy-shell model fails to predict the flux during the first hour of the burst and overpredicts the flux from the afterglow after six days. The initial points may be explained by emission from a reverse shock (e.g. Pandey et al. 2002) or an increase in the density of the medium near the progenitor. Holland et al. (2002) argue that the jet break occurs at about six days, so because our models assume an isotropic afterglow, the presence of a jet can account for this discrepancy. The energy-injection and clumpy-medium models can fit the entire band light curve up to one month after the burst.
Fig. 3 depicts the required variation in the energy of the visible portion of the fireball in the energy-variation models and Fig. 4 depicts the run of density in the clumpy-medium model. In the clumpy-medium and patchy-shell models, the required variations are modest so we are justified in neglecting the contribution of reverse shocks to the emission (Lazzati et al. 2002). The energy-injection model requires the energy of the shock to increase by a factor of forty, so the simple models of Nakar et al. (2002) may not be applicable. Note that, in the clumpy-medium model, the rise of the density at small radii derives from fitting the early optical data (Fox 2002) such a rise would not be required if that emission were originated in the reverse shock as claimed by (Pandey et al. 2002) or if the early data were also in the slow cooling regime due to a different choice of the parameters and (Lazzati priv. comm). Although the transition from fast cooling to slow cooling is dependent on and , during either regime changes in and are degenerate with changes in the energy of the shock and the density of the medium.


The largest difference between the models is at frequencies above . The Chandra observations (Sako & Harrison 2002) are contemporaneous with optical and near infrared measurements (Bersier et al. 2002; Holland et al. 2002; Pandey et al. 2002). The optical/NIR observations show significant variation from power-law decay during this epoch. The X-ray observations are consistent with the power-law decay . In the clumpy-medium model, the X-ray flux follows a strict power-law decay during this epoch because the cooling frequency lies below the X-rays. On the other hand, the energy-variation model results in complicated behavior in the X-rays which is absent in the data.
We have reanalyzed the data obtained by Sako & Harrison (2002) to obtain better constraints on the departures to the power-law evolution of the flux in the X-ray band as they are crucial for discriminating among the various models. We looked at only the zeroth order image which Sako & Harrison (2002) have argued is consistent with the HETG spectrum. We fit the ACIS spectrum for the entire observation with an absorbed power-law energy distribution and obtained values consistent with the results of Sako & Harrison (2002). We then compared the distribution of photon arrival times for all those photons above the median energy with those below the median energy. Both these distributions are consistent with the distribution of all of the photon arrival times. This indicates that there was little spectral evolution during the observation, so we divided the observation into four intervals each with the same number of counts and fit the resulting spectrum with absorbed power-law energy distributions with the power-law index and absorption column fixed, yielding the points depicted in Figs. 1 and 2.
To test our models robustly we used them to predict the distribution of photon arrival times during the X-ray observations. We compared these distributions with the observed distribution using the Kolmogorov-Smirnov statistic. We found that the density-variation model is preferred (K-S probability of 3%) over the patchy-shell model (K-S probability of 0.3%). The energy-injection model was highly disfavored with a K-S probability of .
If we examine in further detail, the color of the emission in the optical and near infrared varies significantly from day to day (Bersier et al. 2002; Matheson et al. 2002). Because all of these bands lie below the cooling frequency, both the density-variation and energy-variation models cannot reproduce these color changes. This is apparent from Figs. 1 and 2.
4 Discussion
We find that the broadband emission from GRB 021004 can be well described by a relativistic fireball propagating into a clumpy medium. This model can account for the observed variability in the optical and near infrared while producing a power-law decay in the X-rays. Varying the energy in the observed portion of the fireball results in a variation in the X-ray flux as well which was not seen.
The patchy-shell model provides a poorer explanation. In this model, the mean energy of the observed portion of the fireball can both increase or decrease (Nakar et al. 2002) as it travels through a constant density medium. This model can account for the near infrared through ultraviolet data, but it predicts a departure from power-law decay in the X-rays. It cannot account for the earliest data or for the fluxes more than five days after the burst. This time coincides with the jet break found by Holland et al. (2002). Because our models do not account for jet emission, the jet provides a natural explanation for the discrepancy. In both the clumpy-medium and the patchy-shell models at this time. Using the formula of Frail et al. (2001) gives a jet-opening angle of 0.09 consistent with the value of . This yields a total energy of the ejecta of approximately erg and erg in the gamma-ray burst itself, somewhat less than the mean found by Frail et al. (2001).
The least likely model is energy injection. Because of the steep decline in the second half of the first day, a wind density model is required to fit the data in this scenario. Without some significant energy injection during this period, the model underpredicts the flux later on. Furthermore, the energy-injection model exhibits dramatic evolution in the X-rays as well. This was not seen.
We find that the afterglow of GRB 021004 was most likely produced in a clumpy wind flowing into a low-density, typical ISM medium. The mean density during most of the afterglow phase is about 0.1 cm-3. If this value is typical also at scales larger larger than those in which the afterglow is produced, no variability in the absorption lines in the spectra (associated with the host galaxy) should be expected (Perna & Loeb 1998). The typical density that we infer could be very well typical of mergers of two compact objects as found in numerical simulations (Perna & Belczynski 2002), but in this case we do not expect a particularly bumpy environment (besides the small scale fluctuations due to ISM turbulence, see Wang & Loeb 2000), while this seems to be the case for GRB 021004. Therefore, the association with the collapse of a massive star is a more likely scenario. A lumpy, low-density background could suggest an explosion which occurred inside the remnant of a previous supernova explosion, such as in the Supranova model of (Vietri & Stella 1998).
Besides the magnitude of the density, the density profile itself in the immediate environment of the burst can be be used to discern among various progenitor models (see e.g. Lazzati et al. 2001). We find that, if we fit the early optical data points within the same forward shock model that is used to model the later emission222This might not necessarily be the case according to (Pandey et al. 2002)., then the overall density profile resembles that of a wind from a massive star, as one would expect in the collapsar scenario MacFadyen et al. (2001). We have computed the mass loss rate that is needed to produce the derived density assuming a wind velocity of 1000 km s-1. Although the density that we find is somewhat lower than that assumed by Ramirez-Ruiz et al. (2001), it is typical for high-mass stars at subsolar metallicity (Kudritzki 2002).
GRB 021004 exhibited several color changes during its decay (Bersier et al. 2002; Matheson et al. 2002). None of the models that we have considered can explain these changes. Furthermore, it is impossible to reproduce the color change within the broken-power-law spectral model of Sari et al. (1998) even by integrating over an heterogeneous fireball (e.g. Nakar et al. 2002), unless the inhomogeneities are sufficiently large to shift the values of or across the bands of interest. Because the latter possibility is unlikely, we conclude that they are most likely either external to the fireball or a result of the approximations used in current afterglow models.
References
- Barsukova et al. (2002) Barsukova, E. A., Goranskij, V. P., Beskin, G. M., Plokhotnichenko, V. L., & Pozanenko, A. S. 2002, GCN, 1606
- Bersier et al. (2002) Bersier, D. et al. 2002, ApJ, submitted (astro-ph/0211130)
- Fox (2002) Fox, D. 2002, GCN, 1564
- Frail et al. (2001) Frail, D. A. et al. 2001, ApJ, 562, L55
- Holland et al. (2002) Holland, S. T. et al. 2002, AJ, submitted (astro-ph/0211094)
- Klotz et al. (2002) Klotz, A., Boer, M., & Thuillot, W. 2002, GCN, 1615
- Kobayashi & Zhang (2002) Kobayashi, S. & Zhang, B. 2002, ApJ, submitted (astro-ph/0210584)
- Kudritzki (2002) Kudritzki, R. P. 2002, ApJ, 577, 389
- Lamb et al. (2002) Lamb, D. et al. 2002, GCN, 1600
- Lazzati et al. (2001) Lazzati, D., Perna, R., & Ghisellini, G. 2001, MNRAS, 325, L19
- Lazzati et al. (2002) Lazzati, D., Rossi, E., Covino, S., Ghisellini, G., & Malesani, D. 2002, A&A, submitted (astro-ph/0210333)
- MacFadyen et al. (2001) MacFadyen, A. I., Woosley, S. E., & Heger, A. 2001, ApJ, 550, 410
- Matheson et al. (2002) Matheson, T. et al. 2002, ApJ, submitted (astro-ph/0210403)
- Matsumoto et al. (2002) Matsumoto, K., Kawabata, T., Ayani, K., Y.Urata, Yamaoka, H., & Kawai, N. 2002, GCN, 1594
- Mirabal et al. (2002) Mirabal, N., Armstrong, E. K., Halpern, J. P., & Kemp, J. 2002, GCN, 1602
- Moller et al. (2002) Moller, P. et al. 2002, A&A, in press (astro-ph/0210654)
- Nakar et al. (2002) Nakar, E., Piran, T., & Granot, J. 2002, New Astr., submitted (astro-ph/0210631)
- Oksanen et al. (2002) Oksanen, A., Aho, M., Rivich, K., Rivich, K., West, D., & Durig, D. 2002, GCN, 1591
- Pandey et al. (2002) Pandey, S. B. et al. 2002, Bull. Astr. Soc. India, submitted (astro-ph/0211108)
- Pei (1992) Pei, Y. C. 1992, ApJ, 395, 130
- Perna & Belczynski (2002) Perna, R. & Belczynski, K. 2002, ApJ, 570, 252
- Perna & Loeb (1998) Perna, R. & Loeb, A. 1998, ApJ, 501, 467
- Ramirez-Ruiz et al. (2001) Ramirez-Ruiz, E., Dray, L. M., Madau, P., & Tout, C. A. 2001, MNRAS, 327, 829
- Sako & Harrison (2002) Sako, M. & Harrison, F. A. 2002, GCN, 1624
- Salamanca et al. (2002) Salamanca, I., Rol, E., Wijers, R., Ellison, S., Kaper, L., & Tanvir, N. 2002, GCN, 1611
- Sari et al. (1998) Sari, R., Piran, T., & Narayan, R. 1998, ApJ, 497, L17
- Shirasaki et al. (2002) Shirasaki, Y. et al. 2002, GCN, 1565
- Uemura et al. (2002) Uemura, M., Ishioka, R., Kato, T., & Yamaoka, H. 2002, GCN, 1566
- Vietri & Stella (1998) Vietri, M. & Stella, L. 1998, ApJ, 507, L45
- Wang & Loeb (2000) Wang, X. & Loeb, A. 2000, ApJ, 535, 788
- Weidinger et al. (2002) Weidinger, M. et al. 2002, GCN, 1573