A Submillimeter and Radio Survey of Gamma-Ray Burst Host Galaxies: A Glimpse into the Future of Star Formation Studies
Abstract
We present the first comprehensive search for submillimeter and radio emission from the host galaxies of twenty well-localized -ray bursts (GRBs). With the exception of a single source, all observations were undertaken months to years after the GRB explosions to ensure negligible contamination from the afterglows. We detect the host galaxy of GRB 000418 in both the sub-mm and radio, and the host galaxy of GRB 000210 only in the sub-mm. These observations, in conjunction with the previous detections of the host galaxies of GRB 980703 and GRB 010222, indicate that about of GRB host galaxies are ultra-luminous ( L⊙) and have star formation rates of about M⊙ yr-1. As an ensemble, the non-detected hosts have a star formation rate of about M⊙ yr-1 () based on their radio emission. The detected and ensemble star formation rates exceed the optically-determined values by an order of magnitude, indicating significant dust obscuration. In the same vein, the ratio of bolometric dust luminosity to UV luminosity for the hosts detected in the sub-mm and radio ranges from , and follows the known trend of increasing obscuration with increasing bolometric luminosity. We also show that, both as a sample and individually, the GRB host galaxies have bluer colors as compared with galaxies selected in the sub-mm in the same redshift range. This possibly indicates that the stellar populations in the GRB hosts are on average younger, supporting the massive stellar progenitor scenario for GRBs, but it is also possible that GRB hosts are on average less dusty. Beyond the specific results presented in this paper, the sub-mm and radio observations serve as an observational proof-of-concept in anticipation of the upcoming launch of the SWIFT GRB mission and SIRTF. These new facilities will possibly bring GRB host galaxies into the forefront of star formation studies.
1 Introduction
One of the major thrusts in modern cosmology is an accurate census of star formation and star-forming galaxies in the Universe. This endeavor forms the backbone for a slew of methods (observational, analytical, and numerical) to study the process of galaxy formation and evolution over cosmic time. To date, star-forming galaxies have been selected and studied mainly in two observational windows: the rest-frame ultraviolet (UV), and rest-frame radio and far-infrared (FIR). For galaxies at high redshift these bands are shifted into the optical and radio/sub-mm, allowing observations from the ground. Still, the problem of translating the observed emission to star formation rate (SFR) involves large uncertainty. This is partly because each band traces only a minor portion of the total energy output of stars. Moreover, the optical/UV band is significantly affected by dust obscuration, thus requiring order of magnitude corrections, while the sub-mm and radio bands lack sensitivity, and therefore uncover only the most prodigiously star-forming galaxies.
The main result that has emerged from star formation surveys over the past few years is exemplified in the so-called Madau diagram. Namely, the SFR volume density, , rises steeply to , and seemingly peaks at . There is still some debate about the how steep the rise is, with values ranging from (Wilson et al., 2002) to (e.g. Madau et al. 1996). The evolution beyond is even less clear since optical/UV observations indicate a decline (Madau et al., 1996), while recent sub-mm observations argue for a flat to higher redshift, (Barger, Cowie & Richards, 2000). Consistency with this trend can be obtained by invoking large dust corrections in the optical/UV (Steidel et al., 1999). For general reviews of star formation surveys we refer the reader to Kennicut (1998), Adelberger & Steidel (2000), and Blain et al. (2002).
Despite the significant progress in this field, our current understanding of star formation and its redshift evolution is still limited by the biases and shortcomings of current optical/UV, sub-mm, and radio selection techniques. In particular, despite the fact that the optical/UV band is sensitive to galaxies with modest star formation rates (down to a fraction of a M⊙ yr-1) at high redshift, these surveys may miss the most dusty, and vigorously star-forming galaxies. Moreover, it is not clear if the simple, locally-calibrated prescriptions for correcting the observed un-obscured SFR for dust extinction (e.g. Meurer, Heckman & Calzetti 1999), hold at high redshift; even if they do, these prescriptions involve an order of magnitude correction. Finally, the optical/UV surveys are magnitude limited, and therefore miss the faintest sources.
Sub-mm surveys have uncovered a population of highly dust-extincted galaxies, which are usually optically faint, and have star formation rates of several hundred M⊙ yr-1 (e.g. Smail, Ivison & Blain 1997). However, unlike optical/UV surveys, sub-mm surveys are severely sensitivity limited, and only detect galaxies with L⊙. More importantly, current sub-mm bolometer arrays (such as SCUBA) have large beams on the sky ( arcsec) making it difficult to unambiguously identify optical counterparts (which are usually faint to begin with), and hence measure the redshifts (Smail et al., 2002); in fact, of the sub-mm galaxies identified to date, only a handful have a measured redshift. Finally, translating the observed sub-mm emission to a SFR requires significant assumptions about the temperature of the dust, and the dust emission spectrum (e.g. Blain et al. 2002).
Surveys at decimeter radio wavelengths also suffer from low sensitivity, but the high astrometric accuracy afforded by synthesis arrays such as the VLA allows a sub-arcsec localization of the radio-selected galaxies. As a result, it is easier to identify the optical counterparts of these sources. Recently, this approach has been used to pre-select sources for targeted sub-mm observations resulting in an increase in the sub-mm detection rate (Barger, Cowie & Richards, 2000; Chapman et al., 2002) and redshift determination (Chapman et al., 2003). However, this method is biased toward finding luminous (high SFR) sources since it requires an initial radio detection. An additional problem with radio, even more than with sub-mm, selection is contamination by active galactic nuclei (AGN). An examination of the X-ray properties of radio and sub-mm selected galaxies reveals that of the order of can have a significant AGN component (Barger et al., 2001).
The most significant problem with current star formation studies, however, is that the link between the optical and sub-mm/radio samples is still not well understood. The Hubble Deep Field provides a clear illustration: the brightest sub-mm source does not appear to have an optical counterpart (Hughes et al., 1998), and only recently a detection has been claimed in the near-IR ( mag; Dunlop et al. 2002). Along the same line, sub-mm observations of the optically-selected Lyman break galaxies have resulted in very few detections (Chapman et al., 2000; Peacock et al., 2000; Chapman et al., 2002), and even the brightest Lyman break galaxies appear to be faint in the sub-mm band (Baker et al., 2001). In addition, there is considerable diversity in the properties of optical counterparts to sub-mm sources, ranging from galaxies which are faint in both the optical and near-IR (NIR) to those which are bright in both bands (Ivison et al., 2000; Smail et al., 2002).
As a result of the unclear overlap, and the sensitivity and dust problems in the sub-mm and optical surveys, the fractions of global star formation in the optical and sub-mm/radio selected galaxies is not well constrained. It is therefore not clear if the majority of star formation takes place in ultra-luminous galaxies with very high star formation rates, or in the more abundant lower luminosity galaxies with star formation rates of a few M⊙ yr-1. Given the difficulty with redshift identification of sub-mm galaxies, the redshift distribution of dusty star forming galaxies remains highly uncertain.
One way to alleviate some of these problems is to study a sample of galaxies that is immune to the selection biases of current optical/UV and sub-mm/radio surveys, and which may draw a more representative sample of the underlying distribution of star-forming galaxies. The host galaxies of -ray bursts (GRBs) may provide one such sample.
The main advantages of the sample of GRB host galaxies are: (i) The galaxies are selected with no regard to their emission properties in any wavelength regime, (ii) the dust-penetrating power of the -ray emission results in a sample that is completely unbiased with respect to the global dust properties of the hosts, (iii) GRBs can be observed to very high redshifts with existing missions (; Lamb & Reichart 2000), and as a result volume corrections for the star formation rates inferred from their hosts are trivial, (iv) the redshift of the galaxy can be determined via absorption spectroscopy of the optical afterglow, or X-ray spectroscopy allowing a redshift measurement of arbitrarily faint galaxies (the current record-holder is the host of GRB 990510 with mag and ; Vreeswijk et al. 2001), and (v) since there is excellent circumstantial evidence linking GRBs to massive stars (e.g. Bloom, Kulkarni & Djorgovski 2002, the sample of GRB hosts is expected to trace global star formation (Blain & Natarajan, 2000).
Of course, the sample of GRB hosts is not immune from its own problems and potential biases. The main problem is the relatively small size of the sample in comparison to both the optical and sub-mm samples111Currently, the sample of GRB hosts numbers about sources, and grows at a rate of about one per month. The upcoming SWIFT mission is expected to increase the rate to one per days. (although the number of GRB hosts with a known redshift exceeds the number of sub-mm galaxies with a measured redshift). As a result, at the present it is not possible to assess the SFR density that is implied by GRB hosts, or its redshift evolution. A bias towards sub-solar metallicity for GRB progenitors (and hence their environments) has been discussed (MacFadyen & Woosley, 1999; MacFadyen, Woosley & Heger, 2001), but it appears that very massive stars (e.g. M⊙) should produce black holes even at solar metallicity. The impact of metallicity on additional aspects of GRB formation (e.g. angular momentum, loss of hydrogen envelope) is not clear at present. Finally, given the observed dispersion in metallicity within galaxies (e.g. Alard 2001; Overzier et al. 2001), it is likely that even if GRBs require low metallicity progenitors, this does not imply that the galaxy as a whole has a lower than average metallicity.
To date, GRB host galaxies have mainly been studied in the optical and NIR bands. With the exception of one source (GRB 020124; Berger et al. 2002), every GRB localized to a sub-arcsecond position has been associated with a star-forming galaxy (Bloom, Kulkarni & Djorgovski, 2002). These galaxies range from mag, have a median redshift, , and are generally typical of star-forming galaxies at similar redshifts in terms of morphology and luminosity (Djorgovski et al., 2001), with star formation rates from optical spectroscopy of M⊙ yr-1. At the same time, there are hints for higher than average ratios of [Ne III] 3869 to [O II] 3727, possibly indicating the presence of massive stars (Djorgovski et al., 2001). Only two host galaxies have been detected so far in the radio (GRB 980703; Berger, Kulkarni & Frail 2001) and sub-mm (GRB 010222; Frail et al. 2002).
Here we present sub-mm and radio observations of a sample of GRB host galaxies, ranging in redshift from about to (§2); one of the 20 sources is detected with high significance in both the sub-mm and radio bands, and an additional source is detected in the sub-mm (§3). We compare the detected sub-mm and radio host galaxies to local and high- ultra-luminous galaxies in §4, and derive the SFRs in §5. We then compare the inferred SFRs of the detected host galaxies, and the ensemble of undetected hosts, to optical estimates in §6. Finally, we compare the optical properties of the GRB host galaxies to those of sub-mm and radio selected star-forming galaxies (§7).
2 Observations
2.1 Target Selection
At the time we conducted our survey, the sample of GRB host galaxies numbered 25, twenty of which had measured redshifts. These host galaxies were localized primarily based on optical afterglows, but also using the radio and X-ray afterglow emission. Of the 25 host galaxies we observed eight in both the radio and sub-mm, seven in the radio, and five in the sub-mm. The galaxies were drawn from the list of 25 hosts at random, constrained primarily by the availability of observing time. Thus, the sample presented here does not suffer from any obvious selection biases, with the exception of detectable afterglow emission in at least one band.
Sub-mm observations of GRB afterglows, and a small number of host galaxies have been undertaken in the past. Starting in 1997, Smith et al. (1999) and Smith et al. (2001) have searched for sub-mm emission from the afterglow of thirteen GRBs. While they did not detect any afterglow emission, these authors used their observations to place constraints on emission from eight host galaxies, with typical rms values of 1.2 mJy. Since these were target-of-opportunity observations, they were not always undertaken in favorable observing conditions.
More recently, Barnard et al. (2002) reported targeted sub-mm observations of the host galaxies of four optically-dark GRBs (i.e. GRBs lacking an optical afterglow). They focused on these particular sources since one explanation for the lack of optical emission is obscuration by dust, which presumably points to a dusty host. None of the hosts were detected, with the possible exception of GRB 000210 (see §3.4), leading the authors to conclude that the hosts of dark bursts are not necessarily heavily dust obscured.
Thus, the observations presented here provide the most comprehensive and bias-free search for sub-mm emission from GRB host galaxies, and the first comprehensive search for radio emission.
2.2 Submillimeter Observations
Observations in the sub-mm band were carried out using the Sub-millimeter Common User Bolometer Array (SCUBA; Holland et al. 1999) on the James Clerk Maxwell Telescope (JCMT222The JCMT is operated by the Joint Astronomy Centre on behalf of the Particle Physics and Astronomy Research Council of the UK, the Netherlands Organization for Scientific Research, and National Research Council of Canada). We observed the positions of thirteen well-localized GRB afterglows with the long (850 m) and short (450 m) arrays. The observations, summarized in Table 1, were conducted in photometry mode with the standard nine-jiggle pattern using the central bolometer in each of the two arrays to observe the source. In the case of GRB 000301C we used an off-center bolometer in each array due to high noise levels in the central bolometer.
To account for variations in the sky brightness, we used a standard chopping of the secondary mirror between the on-source position and a position 60 arcsec away in azimuth, at a frequency of 7.8125 Hz. In addition, we used a two-position beam switch (nodding), in which the beam is moved off-source in each exposure to measure the sky. Measurements of the sky opacity (sky-dips) were taken approximately every two hours, and the focus and array noise were checked at least twice during each shift.
The pointing was checked approximately once per hour using several sources throughout each shift, and was generally found to vary by arcsec (i.e. less than one quarter of the beam size). All observations were performed in band 2 and 3 weather with .
The data were initially reduced with the SCUBA Data Reduction Facility (SURF) following the standard reduction procedure. The off-position pointings were subtracted from the on-position pointings to account for chopping and nodding of the telescope. Noisy bolometers were removed to facilitate a more accurate sky subtraction (see below), and the data were then flat-fielded to account for the small differences in bolometer response. Extinction correction was performed using a linear interpolation between skydips taken before and after each set of on-source scans.
In addition to the sky subtraction offered by the nodding and chopping, short-term sky contributions were subtracted by using all low-noise off-source bolometers (sky bolometers). This procedure takes advantage of the fact that the sky contribution is correlated across the array. As a result, the flux in the sky bolometers can be used to assess the sky contribution to the flux in the on-source bolometer. This procedure is especially crucial when observing weak sources, since the measured flux may be dominated by the sky. We implemented the sky subtraction using SURF and our own routine using MATLAB. We found that in general the SURF sky subtraction under-estimated the sky contribution, and as a result over-estimated the source fluxes. We therefore used the results of our own analysis routine. For this purpose we calculated the median value of the two (three) outer rings of bolometers in the 850 m (450 m) array, after removing noisy bolometers (defined as those whose standard deviation over a whole scan deviated by more than 5 from the median standard deviation of all sky bolometers).
Following the sky subtraction, we calculated the mean and standard deviation of the mean (SDOM) for each source in a given observing shift. Noisy data were eliminated in two ways. First, the data were binned into 25 equal time bins, and the SDOM was calculated step-wise, i.e. at each step the data from an additional bin were added and the mean and SDOM were re-calculated. In an ideal situation where the data quality remains approximately constant, the SDOM should progressively decrease as more data are accumulated. However, if the quality of the data worsens (due to deteriorating weather conditions for example) the SDOM will increase. We therefore removed time bins in which the SDOM increased. Following this procedure, we recursively eliminated individual noisy data points using a sigma cutoff level based on the number of data points (Chauvenet’s criterion; Taylor 1982) until the mean converged on a constant value. Typically, two or three iterations were required, with only a few data points rejected each time. Typically, only a few percent of the data were rejected by the two procedures.
Finally, flux conversion factors (FCFs) were applied to the resulting voltage measurements to convert the signal to Jy. Using photometry observations of Mars and Uranus, and/or secondary calibrators (OH 231.8+4.2, IRC+10216, and CRL 618), we found the FCF to vary between Jy/V at 850 m, consistent with the typical value of . At 450 m, the FCFs varied between Jy/V.
2.3 Radio Observations
Very Large Array (VLA333The VLA is operated by the National Radio Astronomy Observatory, a facility of the National Science Foundation operated under cooperative agreement by Associated Universities, Inc.): We observed GRB afterglow positions with the VLA from April 2001 to February 2002. All sources were observed at 8.46 GHz in the standard continuum mode with MHz bands. In addition, GRB 000418 was observed at 1.43 and 4.86 GHz, and GRB 0010222 was observed at 4.86 GHz. In Table 2 we provide a summary of the observations.
In principle, since the median spectrum of faint radio sources between 1.4 and 8.5 GHz is (Fomalont et al., 2002), the ideal VLA frequency for our observations (taking into account the sensitivity at each frequency) is 1.43 GHz. However, we chose to observe primarily at 8.46 GHz for the following reason. The majority of our observations were taken in the BnC, C, CnD, and D configurations, in which the typical synthesized beam size is arcsec at 1.43 GHz, compared to arcsec at 8.46 GHz. The large synthesized beam at 1.43 GHz, combined with the larger field of view and higher intrinsic brightness of radio sources at this frequency, would result in a significant decrease in sensitivity due to source confusion. Thus, we were forced to observe at higher frequencies, in which the reduced confusion noise more than compensates for the typical steep spectrum. We chose 8.46 GHz rather than 4.86 GHz since the combination of higher sensitivity and lower confusion noise, provide a more significant impact than the typical decrease in intrinsic brightness. The 1.43 GHz observations of GRB 000418 were undertaken in the A configuration, where confusion does not play a limiting role.
For flux calibration we used the extragalactic sources 3C 48 (J0137+331), 3C 147 (J0542+498), and 3C 286 (J1331+305), while the phases were monitored using calibrator sources within of the survey sources.
We used the Astronomical Image Processing System (AIPS) for data reduction and analysis. For each source we co-added all the observations prior to producing an image, to increase the final signal-to-noise.
Australia Telescope Compact Array (ATCA444The Australia Telescope is funded by the Commonwealth of Australia for operations as a National Facility managed by CSIRO.): We observed the positions of four GRB afterglows during April 2002, in the 6A configuration at and MHz. Using the 6-km baseline resulted in a significant decrease in confusion noise, thus allowing observations at the most advantageous frequencies. The observations are summarized in Table 2.
We used J1934638 for flux calibration, while the phase was monitored using calibrator sources within of the survey sources. The data were reduced and analyzed using the Multichannel Image Reconstruction, Image Analysis and Display (MIRIAD) package, and AIPS.
3 Results
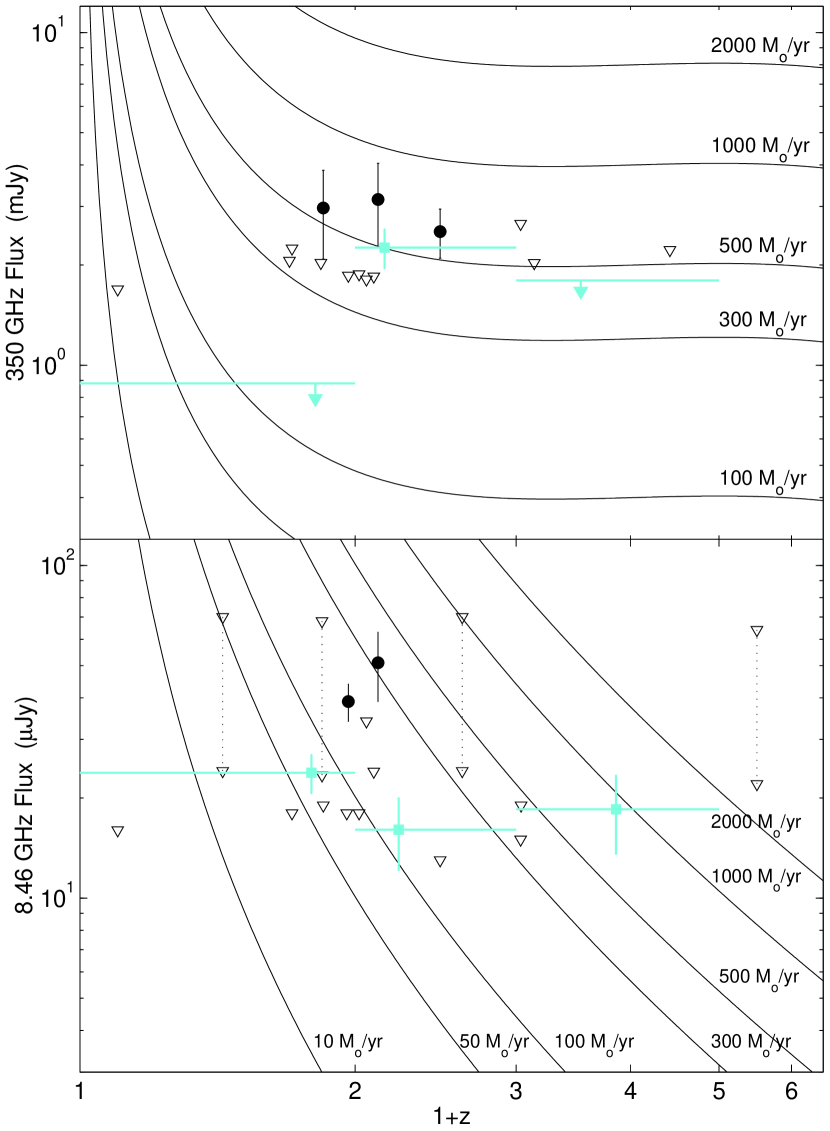
The flux measurements at the position of each GRB are given in Tables 1 and 2, and are plotted in Figure 2. Of the sources, only GRB 000418 was detected in both the radio and sub-mm with (§3.1). One additional source, GRB 000210, is detected with when combining our observations with those of Barnard et al. (2002). Two hosts have radio fluxes with (GRB 000301C and GRB 000926), but as we show below this is due in part to emission from the afterglow.
The typical thresholds are about mJy, Jy, and Jy in the SCUBA, VLA, and ATCA observations, respectively. In Figure 2 we plot all sources with as detections, and the rest as upper limits. In addition, for the sources observed with the ATCA we plot both the 1.4 GHz upper limits, and the inferred upper limits at 8.46 GHz assuming a typical radio spectrum, (Fomalont et al., 2002).
One obvious source for the observed radio and sub-mm fluxes (other than the putative host galaxies) is emission from the afterglows. To assess the possibility that our observations are contaminated by flux from the afterglows we note that the observations have been undertaken at least a year after the GRB explosion555The single exception is GRB 011211 for which SCUBA observations were taken days after the burst.. On this timescale, the sub-mm emission from the afterglow is expected to be much lower than the detection threshold of our observations. In fact, the brightest sub-mm afterglows to date have only reached a flux of a few mJy (at 350 GHz), and typically exhibited a fading rate of after about one day following the burst (Smith et al., 1999; Berger et al., 2000; Smith et al., 2001; Frail et al., 2002; Yost et al., 2002). Thus, on the timescale of our observations, the expected sub-mm flux from the afterglows is only Jy, well below the detection threshold.
The radio emission from GRB afterglows is more long-lived, and hence posses a more serious problem. However, on the typical timescale of the radio observations the 8.46 GHz flux is expected to be at most a few Jy (e.g. Berger et al. 2000).
In the following sections we discuss the individual detections in the radio and sub-mm, and also provide an estimate for the radio emission from each afterglow.
3.1 GRB 000418
A source at the position of GRB 000418 is detected at four of the five observing frequencies with . The SCUBA source, which we designate SMM 12252+2006, has a flux density of mJy, and mJy. These values imply a spectral index, (), consistent with a thermal dust spectrum as expected if the emission is due to obscured star formation.
The radio source (VLA 122519.26+200611.1), is located at (J2000)=12h25m19.255s, (J2000)=, with an uncertainty of 0.1 arcsec in both coordinates. This position is offset from the position of the radio afterglow of GRB 000418 (Berger et al. 2001) by arcsec and arcsec (Figure 1). In comparison, the offset measured from Keck and Hubble Space Telescope images is smaller, arcsec and arcsec.
VLA 122519.26+200611.1 has an observed spectral slope , flatter than the typical value for faint radio galaxies, (Fomalont et al., 2002), and similar to the value measured for the host of GRB 980703 (; Berger, Kulkarni & Frail 2001). The source appears to be slightly extended at 1.43 and 8.46 GHz, with a size of about arcsec ( kpc at ).
The expected afterglow fluxes at 4.86 and 8.46 GHz at the time of our observations are about and Jy, respectively (Berger et al., 2001). At 1.43 GHz the afterglow contribution is expected to be about Jy based on the 4.86 GHz flux and the afterglow spectrum . Thus, despite the contribution from the afterglow, the radio detections of the host galaxy are still significant at better than level. Correcting for the afterglow contribution we find an actual spectral slope , consistent with the median for 8.46 GHz radio sources with a similar flux (Fomalont et al., 2002).
As with all SCUBA detections, source confusion arising from the large beam ( arcsec at 350 GHz and arcsec at 670 GHz) raises the possibility that SMM 12252+2006 is not associated with the host galaxy of GRB 000418. Fortunately, the detection of the radio source, which is located arcsec away from the position of the radio afterglow of GRB 000418, indicates that SMM 12252+2006 and VLA 122519.26+200611.1 are in fact the same source — the host galaxy of GRB 000418.
Besides the positional coincidence of the VLA and SCUBA sources, we gain further confidence of the association based on the spectral index between the two bands, . This spectral index is redshift dependent as a result of the different spectral slopes in the two regimes (Carilli & Yun, 2000; Barger, Cowie & Richards, 2000). We find , in good agreement with the Carilli & Yun (2000) value of (for the redshift of GRB 000418, ).
We also detect another source, slightly extended ( arcsec), approximately 1.4 arcsec East and 2.7 arcsec South of the host of GRB 000418 (designated VLA 122519.36+200608.4), with Jy and Jy (see Figure 1). This source appears to be linked by a bridge of radio emission (with at both frequencies) to the host of GRB 000418. The physical separation between the two sources, assuming both are at the same redshift, , is 25 kpc. There is no obvious optical counterpart to this source in Hubble Space Telescope images down to about mag.
Based purely on radio source counts at 8.46 GHz (Fomalont et al., 2002), the expected number of sources with Jy in a 3 arcsec radius circle is only about . Thus, the coincidence of two such faint sources within 3 arcsec is highly suggestive of an interacting system, rather than chance superposition.
Interacting radio galaxies with separations of about kpc, and joined by a bridge of radio continuum emission have been observed locally (Condon et al., 1993; Condon, Helou & Jarrett, 2002). In addition, optical surveys (e.g. Patton et al. 2002) show that a few percent of galaxies with an absolute -band magnitude similar to that of the host of GRB 000418, have companions within about kpc. The fraction of interacting systems is possibly much higher, , in ultra-luminous systems (such as the host of GRB 000418), both locally (Sanders & Mirabel, 1996) and at high redshift (e.g. Ivison et al. 2000).
We note that with a separation of only 3 arcsec, the host of GRB 000418 and the companion galaxy fall within the SCUBA beam. Thus, it is possible that SMM 12252+2006 is in fact a superposition of both radio sources. This will change the value of to about .
3.2 GRB 980703
The host galaxy of GRB 980703 has been detected in deep radio observations at 1.43, 4.86, and 8.46 GHz (Berger, Kulkarni & Frail, 2001). The galaxy has a flux Jy, and a radio spectral slope . In addition, the radio emission is unresolved with a maximum angular size of arcsec ( kpc).
Based on the Carilli & Yun (2000) value of (for the redshift of GRB 980703, ), the expected flux at 350 GHz is mJy. The observed () flux limit mJy, is consistent with the expected value.
3.3 GRB 010222
GRB 010222 has been detected in SCUBA and IRAM observations with a persistent flux of about 3.5 mJy at 350 GHz and 1 mJy at 250 GHz (Frail et al., 2002). The persistent emission, as well as the steep spectral slope, , indicated that while the detected emission was partially due to the afterglow of GRB 010222, it was dominated by the host galaxy. In fact, accounting for the expected afterglow emission, we find that the host galaxy has a flux, mJy.
The radio flux predicted from the sub-mm emission (Carilli & Yun, 2000) is Jy (for , the redshift of GRB 010222), which corresponds to Jy, and Jy (assuming ). Therefore, our measured values, Jy and Jy are consistent with the observed sub-mm emission.
The expected afterglow fluxes at 4.86 and 8.46 GHz are and Jy, respectively, significantly lower than the measured values. Thus, the observed flux mainly arises from the host.
3.4 GRB 000210
Recently, Barnard et al. (2002) measured a flux of mJy for GRB 000210, in good agreement with our value of mJy. A weighted-average of the two measurements gives mJy, similar to the sub-mm flux from the host galaxies of GRB 000418 and GRB 010222. The radio flux at the position of GRB 000210 is Jy. Based on a redshift of 0.846 (Piro et al., 2002) and the sub-mm detection, the expected radio flux from this source (Carilli & Yun, 2000) is Jy, consistent with the measured value. The expected flux of the afterglow at the time of the radio observations is less than 1 Jy (Piro et al., 2002).
3.5 GRB 980329
Following the localization of GRB 980329, Smith et al. (1999) observed the afterglow position with SCUBA and claimed the detection of a source with a 350 GHz flux of about mJy on 1998, Apr. 5.2. Subsequent observations indicated a fading trend, with a decline to mJy on Apr. 6.2, and mJy () on Apr. 11.2. Based on a comparison to the radio flux of the afterglow, Smith et al. (1999) concluded that the detected sub-mm flux was in excess of the emission from the afterglow itself, and therefore requires an additional component, most likely a host galaxy.
Recently, Yost et al. (2002) re-analyzed the SCUBA data and showed that the initial sub-mm flux was in fact only about mJy, and perfectly consistent with the afterglow flux. As a result, it is not clear that an additional persistent component is required. We also re-analyzed the data from Apr. 1998 using the method described in §2.2. We find the following fluxes: mJy (Apr. 5), mJy (Apr. 6), mJy (Apr. 7), mJy (Apr. 8), and mJy (Apr. 11). A comparison to the results in Smith et al. (1999) reveals that, with the exception of the last epoch, they over-estimate the fluxes by about mJy.
Our observations of GRB 980329 from September and October of 2001 reveal a flux, mJy, indicating that the flattening to a value of about mJy in the late epochs of the Apr. 1998 observations may indicate emission from the host galaxy.
The radio observations are similarly inconclusive, with Jy. We estimate that the flux of the afterglow at 8.46 GHz at the time of our observations is only Jy (Yost et al., 2002).
Since the redshift of GRB 980329 is not known, we cannot assess the expected ratio of the radio and sub-mm fluxes.
3.6 GRB 000926
This source is detected in the VLA observations with a flux of Jy (). The expected flux from the afterglow at the time of the observations, days after the burst, is Jy (Harrison et al., 2001). Thus, the observed emission exceeds the afterglow flux by . In the calculations below we use a host flux of Jy.
3.7 GRB 000301C
The VLA observations of this GRB position reveal a source with Jy (). The flux of the afterglow at the time of the observations is about Jy (Berger et al. 2000). Thus, the excess emission is significant at the level.
The sub-mm emission predicted based on the Carilli & Yun (2000) relation is mJy (for , the redshift of GRB 000301C). This value is in agreement with the measured flux of mJy.
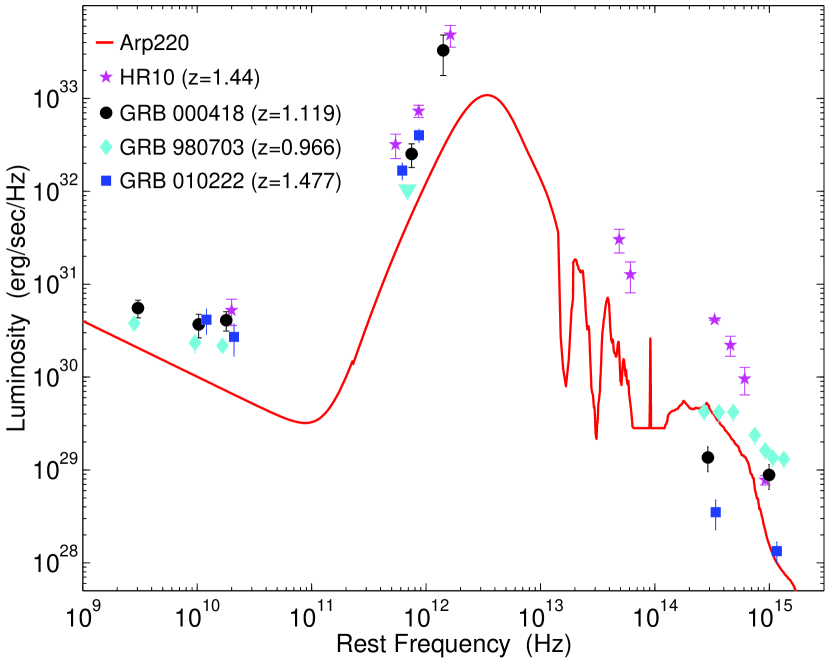
4 Spectral Energy Distributions
In Figure 3 we plot the radio-to-UV spectral energy distributions (SEDs) of the detected host galaxies of GRB 980703, GRB 000418, and GRB 010222, as well as that of Arp 220, a proto-typical local ultra-luminous IR galaxy (ULIRG; Soifer et al. 1984), and ERO J164502+4626.4 (HuR 10), a high- analog of Arp 220 (Hu & Ridgway, 1994; Elbaz et al., 2002). The luminosities are plotted as a function of rest-frame frequencies, to facilitate a direct comparison.
The detected GRB hosts are brighter than Arp 220 ( L⊙, SFR M⊙ yr-1), and are similar in luminosity to HuR 10 ( L⊙, SFR M⊙ yr-1; Dey et al. 1999). As such, we expect the host galaxies to have star formation rates of a M⊙ yr-1, and luminosities in excess of L⊙.
On the other hand, the optical/NIR properties of the detected GRB hosts are distinctly different than those of Arp 220 and HuR 10 (as well as other local and high- ULIRGs). In particular, from Figure 3 it is clear that, while the GRB host galaxies are similar to HuR 10 and Arp 220 in the radio and sub-mm bands, their optical/NIR colors (as defined for example by ) are much bluer. Moreover, while there is a dispersion of a factor of few in the radio and sub-mm bands between the GRB hosts, HuR 10, and Arp 220, the dispersion in the optical/NIR luminosity is about two orders of magnitude. This indicates that there is no simple correlation between the optical/NIR properties of GRB hosts (and possibly other galaxies) and their FIR and radio luminosities. In the following sections we expound on both points.
5 Star Formation Rates
To evaluate the star formation rates that are implied by the sub-mm and radio measurements, we use the following expression for the observed flux as a function of SFR (Yun & Carilli, 2002):
| (1) |
Here, GHz, SFR is the star formation rate in M⊙ yr-1, is the luminosity distance in Mpc, and is a scaling factor (of order unity) which accounts for the difference in the conversion between synchrotron flux and SFR in the Milky Way and other galaxies. The first term on the right-hand-side accounts for the fact that non-thermal synchrotron emission arising from supernova remnants is proportional to the SFR, while the second term is the contribution of free-free emission from HII regions. These two flux terms dominate in the radio regime.
The last term in Equation. 1 is the dust spectrum, which dominates in the sub-mm and FIR regimes. In this case, the parameters that have been chosen to characterize the spectrum are a dust temperature, K, and a dust emissivity, , based on a sample of 23 IR-selected starburst galaxies with L⊙ (Yun & Carilli, 2002). We note that other authors (e.g. Blain et al. 2002) favor a lower dust temperature, K, which would result in somewhat different inferred star formation rates.
To calculate we use the cosmological parameters , , and km s-1 Mpc-1. We also use the typical value for the radio measurements (Fomalont et al., 2002). In Figure 2 we plot contours of constant SFR overlaid on the sub-mm and radio flux measurements. Our radio observations are sensitive to galaxies with M⊙ yr-1 at , and M⊙ yr-1 at . The sub-mm flux, on the other hand, is relatively constant for a given SFR, independent of . This is due to the large positive k-correction resulting from the steep thermal dust spectrum. Therefore, at the typical limit of our sub-mm observations we are sensitive to galaxies with SFR M⊙ yr-1.
For the host galaxies that are detected with in the sub-mm and radio, as well as those detected in the past (i.e. GRB 980703 and GRB 010222) we calculate the following star formation rates: GRB 000418 – M⊙ yr-1, M⊙ yr-1; GRB 000210 – M⊙ yr-1; GRB 010222 – M⊙; GRB 980703 – M⊙ yr-1. Here and are the SFRs derived from the sub-mm and radio fluxes, respectively.
The detections and upper limits from this survey, combined with the detections and upper limits discussed in the literature (Berger, Kulkarni & Frail, 2001; Vreeswijk et al., 2001; Frail et al., 2002) indicate that about of all GRBs explode in galaxies with star formation rates of M⊙ yr-1. At the same time, it is clear that of GRB host galaxies have more modest star formation rates, M⊙ yr-1.
Despite the fact that the majority of the survey sources are not detected, we can ask the question of whether the GRB host galaxies exhibit a significant sub-mm and/or radio emission on average. The weighted average emission from the non-detected sources () is mJy, and Jy. This average radio flux is possibly contaminated by flux from the afterglows at the level of about Jy, so we use Jy (). Therefore, as an ensemble, the GRB host galaxies exhibit radio emission, but no significant sub-mm emission. Using the median redshift, , for the non-detected sample, the average radio flux implies an average M⊙ yr-1, while the sub-mm upper limit on is about M⊙ yr-1.
The average sub-mm flux can be compared to mJy for the non-detected sub-mm sources in a sample of radio pre-selected, optically faint ( mag) galaxies (Chapman et al., 2001), mJy for Lyman break galaxies (Webb et al., 2002), or mJy for optically-selected starbursts in the Hubble Deep Field (Peacock et al., 2000). Thus, it appears that GRB host galaxies trace a somewhat fainter population of sub-mm galaxies compared to the radio pre-selected sample, but similar to the Lyman break and HDF samples. This is not surprising given that the radio pre-selection is naturally biased in favor of luminous sources.
We can further extend this analysis by calculating the average sub-mm and radio fluxes in several redshift bins. Here we include both detections and upper limits. From the sub-mm (radio) observations we find: mJy ( Jy) for , mJy ( Jy) for , and mJy ( Jy) for . These average fluxes are marked in Figure 2. In the sub-mm there is a clear increase in the average flux from to , and a flattening or decrease beyond . In the radio, on the other hand, The average flux is about the same in all three redshift bins.
The average radio fluxes translate into the following star formation rates: for the inferred average SFR is M⊙ yr-1, for it is M⊙ yr-1, and for it is M⊙ yr-1 (with significance in each bin). The sub-mm observations on the other hand, indicate a rise from a value of M⊙ yr-1 for to M⊙ yr-1 for , followed by a decline to M⊙ yr-1 for .
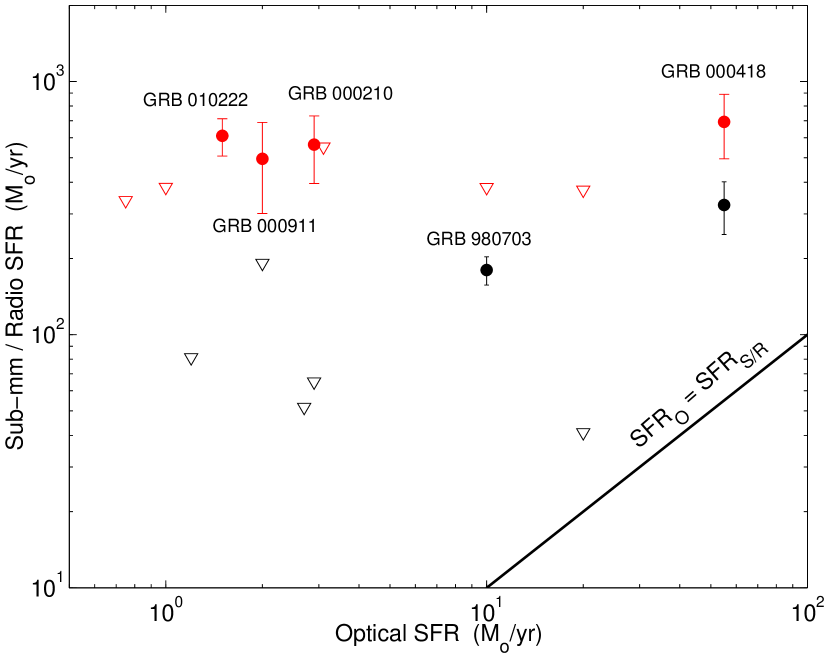
6 Comparison to Optical Observations
The typical un-obscured star formation rates inferred from optical spectroscopy are of the order of M⊙ yr-1 (e.g. Djorgovski et al. 2001). In particular, the host galaxy of GRB 980703 has an optical SFR of about M⊙ yr-1 (Djorgovski et al., 1998), compared to about M⊙ yr-1 from the radio observations. Similarly, the host of GRB 000418 has an optical SFR of about M⊙ yr-1 (Bloom et al., 2002), compared to about M⊙ yr-1 based on the radio and sub-mm detections, while the host of GRB 000210 has an optical SFR of M⊙ yr-1 compared to about M⊙ yr-1 from the sub-mm observations. Finally, the average radio SFR for the non-detected sources, M⊙ yr-1, significantly exceeds the average optical SFR.
The discrepancy between the optical and radio/sub-mm star formation rates indicates that the majority of the star formation in the GRB host galaxies that are detected in the sub-mm and radio is obscured by dust. It is possible that the same is true for the sample as a whole, but this relies on the less secure average SFR in the non-detected hosts. The significant dust obscuration is not surprising given that a similar trend has been noted in high- starburst galaxies, for which the typical dust corrections (based on the UV slope technique) are an order of magnitude (Meurer, Heckman & Calzetti, 1999). In this case we find similar correction factors.
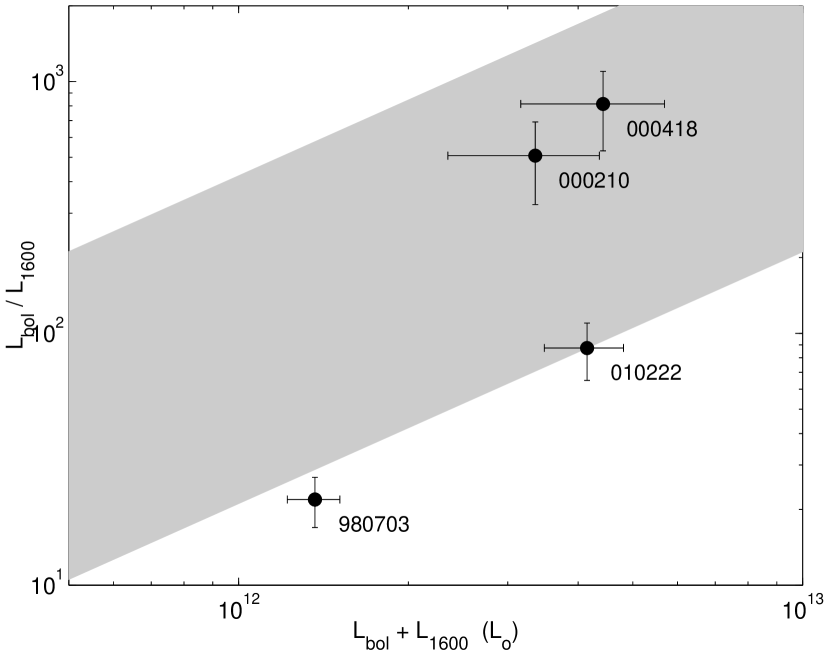
We can also assess the level of obscuration by comparing the UV luminosity at Å, , to the bolometric dust luminosity, . The ratio of these two quantities provides a rough measure of the obscuration, while the sum provides a rough measure of the total star formation rate (Adelberger & Steidel, 2000). We estimate using the following host magnitudes: mag (GRB 980703; Bloom et al. 1998), mag (GRB 0000210; Piro et al. 2002), mag (GRB 000418; Berger et al. 2001), and mag (GRB 010222; Frail et al. 2002), and assuming a spectrum . We calculate the following values of : L⊙ (GRB 980703), L⊙ (GRB 000210), L⊙ (GRB 000418), and L⊙ (GRB 010222).
We estimate from the radio and sub-mm observations, using the conversion factors of Adelberger & Steidel (2000). The resulting values are: L⊙ (GRB 980703), L⊙ (GRB 000210), L⊙ (GRB 000418), and L⊙ (GRB 010222). Thus, evaluates to: (GRB 980703), (GRB 000210), (GRB 000418), and (GRB 010222). These results, as well as the sample of starbursts and ULIRGs at taken from Adelberger & Steidel (2000) are plotted in Figure 4. We note that the GRB hosts are within the scatter of the sample, with a general trend of increasing value of (i.e. inceasing obscuration) with increasing (i.e. inceasing SFR).
At the same time, the particular lines of sight to the GRBs within the sub-mm/radio bright host galaxies do not appear to be heavily obscured. For example, an extinction of mag has been inferred for GRB 980703 (Frail et al., 2002), mag has been found for GRB 000418 (Berger et al., 2001), and mag has been found for GRB 010222. The optically-dark GRB 000210 suffered more significant extinction, mag. In addition, the small offset of GRB 980703 relative to its radio host galaxy ( arcsec; kpc at the redshift of the burst), combined with the negligible extinction, indicates that while the burst probably exploded in a region of intense star formation, it either managed to destroy a large amount of dust in its vicinity, or the dust distribution is patchy. It is beyond the scope of this paper to evaluate the potential of dust destruction by GRBs (see e.g. Waxman & Draine 2000), but it is clear that the GRBs that exploded in the detected sub-mm and radio host galaxies, did not occur in the most heavily obscured star formation sites.
7 Comparison of the Optical Properties of GRB hosts to Radio Pre-Selected Sub-mm Galaxies
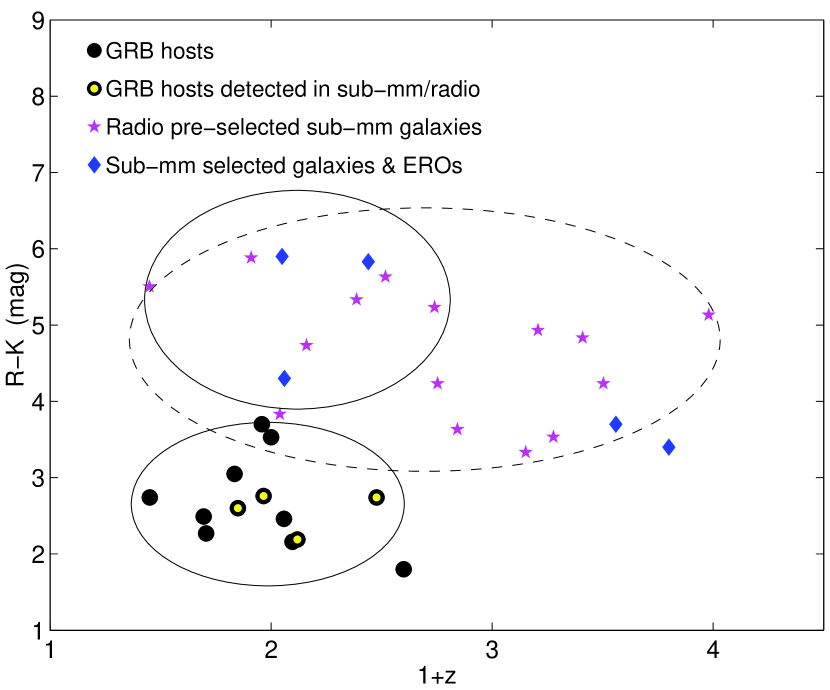
As we noted in §4, the optical/NIR colors of the detected GRB host galaxies are bluer than those of Arp 220 ( mag) and HuR 10 ( mag; Dey et al. 1999). In this section we compare the color of GRB hosts to the colors of radio pre-selected sub-mm galaxies (Chapman et al., 2003; Lewis et al., 2003) and sub-mm selected galaxies with a known optical counterpart and a redshift (Frayer et al., 1998; Ivison et al., 1998; Frayer et al., 1999).
In Figure 6 we plot color versus redshift for GRB hosts and radio pre-selected sub-mm galaxies. Before comparing the two populations, we note that the mean color and redshift for the entire GRB sample are mag and , respectively, and for the hosts that are detected in the sub-mm and radio they are mag and , respectively. Thus, there is no clear correlation between the optical/NIR colors of the GRB hosts and their sub-mm/radio luminosity.
For the sub-mm sample the mean color and redshift are mag and , respectively. To facilitate a more direct comparison with the GRB sample we calculate the mean values for the sub-mm sample in the same redshift range as the GRB hosts: mag and . Moreover, if we examine only the host galaxies that were detected in the radio and sub-mm with high significance we find colors of: 2.2 mag (GRB 000418), 2.8 mag (GRB 980703), 2.1 mag (GRB 010222), and 2.6 (GRB 000210). The bluest sub-mm galaxies, on the other hand, have mag. In general, the GRB hosts that are detected with in the sub-mm and radio have a distribution of that is indistinguishable from the general GRB host galaxy sample.
The obvious difference in color indicates that the GRB and radio/sub-mm selections result in a somewhat different set of galaxies. The red colors of the sub-mm selected galaxies are not surprising since these sources are expected to be dust obscured. On the other hand, the mean color of the GRB hosts is bluer by about 2.5 mag ( significance) compared to sub-mm galaxies in the same redshift range, indicating a bias towards less dust obscuration. a more patchy dust distribution, or intrinsically bluer colors.
It is possible that there is a bias toward less dust obscuration in the general GRB host sample because the bursts that explode in dusty galaxies would have obscured optical afterglows, and hence no accurate localization. However, this is not a likely explanation since the GRBs which exploded in the sub-mm and radio bright hosts are not significantly dust obscured (§6). Moreover, it does not appear that the hosts of dark GRBs are brighter in the sub-mm as expected if the dust obscuration is global (Barnard et al., 2002). Finally, the localization of afterglows in the radio and X-rays allows the selection of host galaxies even if they are dusty. In particular, the only two GRBs in which significant obscuration of the optical afterglow has been inferred (GRB 970828: Djorgovski et al. 2001; GRB 000210: Piro et al. 2002), have been localized thanks to accurate positions from the radio and X-ray afterglows, and have host galaxies with colors of 3.7 and 2.6 mag, not significantly redder than the general population of GRB hosts. Therefore, a bias against dust obscured host galaxies is not the reason for the bluer color of the sample.
An alternative explanation is that the distribution of dust in GRB hosts is different than in the radio pre-selected and sub-mm selected galaxies. This may be in terms of a spatially patchy distribution, which will allow more of the UV light to escape, or a different distribution of grain sizes (i.e. a different extinction law), possibly due to a different average metallicity. However, in both cases it is not clear why there should be a correlation between the dust properties of the galaxy and the occurence of a GRB.
Finally, it is possible that GRB host galaxies are preferentially in an earlier stage of the star formation (or starburst) process. In this case, a larger fraction of the shorter-lived massive stars would still be shining, and the overall color of the galaxy would be bluer relative to a galaxy with an older population of stars. One way to examine the age of the stellar population is to fit population synthesis models to the broad-band optical/NIR spectra of the host galaxies. This approach has recently been used by Chary, Becklin & Armus (2002) who find some evidence that the age of the stellar population in some GRB host galaxies (including the host of GRB 980703) is relatively young, of the order of Myr.
This result is also expected if GRBs arise from massive stars, as indicated by recent observations (e.g. Bloom et al. 2002), since in this case GRBs would preferentially select galaxies with younger star formation episodes.
Regardless of the exact reason for the preferential selection of bluer galaxies relative to the radio pre-selected sub-mm population, two results seem clear: (i) The GRB host galaxies detected in the sub-mm and radio are likely drawn from a population that is generally missed in current sub-mm surveys, and (ii) GRB host galaxies may not be a completely bias-free sample.
The first point is particularly interesting in light of the fact that optical observations of these host galaxies do not identify them as particularly exceptional in terms of SFR. Therefore, while similar galaxies are not necessarily missed in optical surveys, their star formation rates are likely under-estimated.
8 Conclusions and Future Prospects
We presented the most comprehensive SCUBA, VLA, and ATCA observations of GRB host galaxies to date. The host galaxy of GRB 000418 is the only source detected with high significance in both the sub-mm and radio, while the host galaxy of GRB 000210 is detected with in the sub-mm when we combine our observations with those of Barnard et al. (2002). When taken in conjunction with the previous detections of GRB 980703 in the radio (Berger, Kulkarni & Frail, 2001) and GRB 010222 in the sub-mm (Frail et al., 2002), these observations point to a detection rate in the radio/sub-mm. This detection rate confirms predictions for the number of sub-mm bright GRB hosts, with mJy, based on current models of the star formation history assuming a large fraction of obscured star formation (Ramirez-Ruiz, Trentham & Blain, 2002).
The host galaxies detected in the sub-mm and radio have star formation rates from about to M⊙ yr-1, while statistically the non-detected sources have an average SFR of about M⊙ yr-1. These star formation rates exceed the optically-inferred values by over an order of magnitude, pointing to significant dust obscuration within the GRB host galaxies detected in the sub-mm and radio, and possibly the sample as a whole.
Still, the optical afterglows of the bursts that exploded in the sub-mm/radio bright host galaxies did not suffer significant extinction, indicating that: (i) the GRBs did not explode in regions where dust obscuration is significant, or (ii) the UV and X-ray emission from the afterglow destroys a significant amount of dust in the local vicinity of the burst.
We have also shown that GRB host galaxies, even those detected in the sub-mm/radio, have bluer colors compared to galaxies selected in the sub-mm or radio bands in the same redshift range. This is not the result of an observational bias against dusty galaxies in the GRB host sample since the afterglows of GRBs which exploded in the radio/sub-mm bright hosts were not significantly obscured. More likely, this is the result of younger stellar populations in these galaxies, or possibly a patchy dust distribution. If the reason is younger stellar population then this provides additional circumstantial evidence in favor of massive (and hence short-lived) stars as the likely progenitors of GRBs.
A potential bias of the GRB host galaxy sample is that the popular “collapsar” model of GRBs calls for high mass, low metallicity stellar progenitors (MacFadyen & Woosley, 1999). This may result in preferential selection of low metallicity (and hence less dusty) host galaxies. However, it appears that GRB progenitors can even have solar metallicity, and that a very low metallicity is unfavored by the required initial conditions for a GRB explosion. Moreover, studies of the Milky Way (see Stasinska 2002 for a recent review), local galaxies (e.g Alard 2001), and high- galaxies (e.g. Overzier et al. 2001), indicate that there are considerable variations in metallicity within galaxies. This may be especially true if several independent episodes of star formation have occured within the galaxy. Thus, even if there is a bias towards low metallicity for GRB progenitors (and hence their immediate environments) it is not obvious that this introduces a bias in the host galaxy sample.
Nonetheless, while the observations presented in this paper clearly indicate the potential of GRB selection of high- galaxies for the study of star formation, a much larger sample is required to complement existing optical and sub-mm surveys. This may become possible in the near future with the upcoming launch (Sep. 2003) of SWIFT. With an anticipated rapid ( minute) and accurate localization of about 150 bursts per year, the GRB-selected sample will probably increase to several hundred galaxies over the next few years. The rapid localization would most likely result in a large fraction of redshift measurements thanks to the bright optical afterglows.
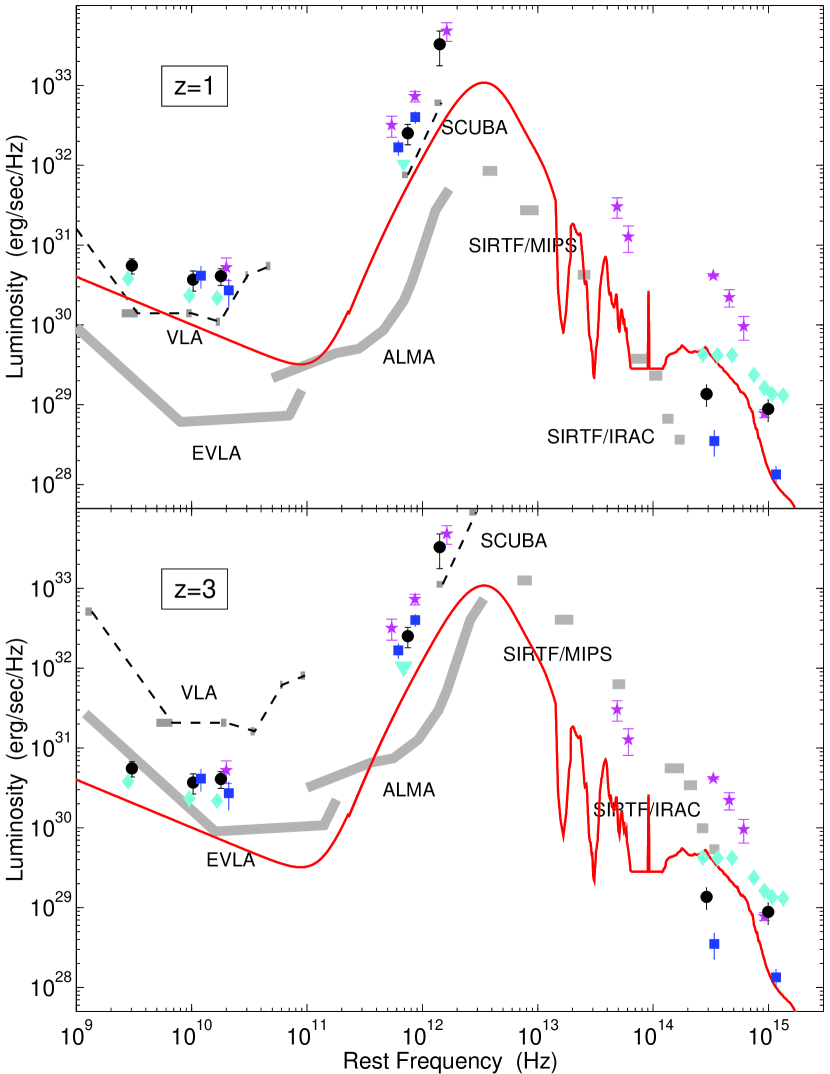
In addition to the localization of a large number of GRB hosts, the study of these galaxies (as well as those in other samples) would greatly benefit from the advent of new facilities, such as SIRTF, ALMA, EVLA, and the SKA. In Figure 7 we again plot the rest-frame SEDs of Arp 220 and the sub-mm/radio bright GRB hosts. Overplotted on these SEDs are the sensitivities of SIRTF, ALMA, and the EVLA for 200-sec exposures at redshifts 1 and 3, as well as the sensitivities of current instruments (VLA and SCUBA).
The contributions of these new facilities to star formation studies are threefold: (i) increased sensitivity, (ii) increased resolution, and (iii) increased frequency coverage. These improvements will serve to ameliorate the main limitations of present radio, sub-mm, and IR observations (§1), by allowing the detection of more representative star forming galaxies at high redshift, in addition to a better constraint on the total dust bolometric luminosity and accurate localizations, which would facilitate follow-ups at optical wavelengths. In conjunction with increasingly larger samples of galaxies selected in the optical, the radio/sub-mm/IR, and by GRBs, the future of star formation studies is poised for great advances and new discoveries.
References
- Adelberger & Steidel (2000) Adelberger, K. L. and Steidel, C. C. 2000, ApJ, 544, 218.
- Alard (2001) Alard, C. 2001, A&A, 377, 389.
- Baker et al. (2001) Baker, A. J., Lutz, D., Genzel, R., Tacconi, L. J., and Lehnert, M. D. 2001, A&A, 372, L37.
- Barger, Cowie & Richards (2000) Barger, A. J., Cowie, L. L., and Richards, E. A. 2000, AJ, 119, 2092.
- Barger et al. (2001) Barger, A. J., Cowie, L. L., Mushotzky, R. F., and Richards, E. A. 2001, AJ, 121, 662.
- Barnard et al. (2002) Barnard, V. et al. 2002, Accepted to MNRAS; astro-ph/0207666.
- Berger et al. (2000) Berger, E. et al. 2000, ApJ, 545, 56.
- Berger et al. (2001) Berger, E. et al. 2001, ApJ, 556, 556.
- Berger, Kulkarni & Frail (2001) Berger, E., Kulkarni, S. R., and Frail, D. A. 2001, ApJ, 560, 652.
- Berger et al. (2002) Berger, E. et al. 2002, Accepted to ApJ; astro-ph/0207320.
- Blain & Natarajan (2000) Blain, A. W. and Natarajan, P. 2000, MNRAS, 312, L35.
- Blain et al. (2002) Blain, A. W., Smail, I., Ivison, R. J., Kneib, J.-P., and Frayer, D. T. 2002, Phys. Rep., 369, 111.
- Bloom et al. (1998) Bloom, J. S. et al. 1998, ApJ, 508, L21.
- Bloom et al. (2002) Bloom, J. S., Berger, E., Kulkarni, S. R., Djorgovski, S. G., and Frail, D. A. 2002, Submitted to AJ.
- Bloom, Kulkarni & Djorgovski (2002) Bloom, J. S., Kulkarni, S. R., and Djorgovski, S. G. 2002, AJ, 123, 1111.
- Bloom et al. (2002) Bloom, J. S. et al. 2002, ApJ, 572, L45.
- Carilli & Yun (2000) Carilli, C. L. and Yun, M. S. 2000, ApJ, 530, 618.
- Chapman et al. (2000) Chapman, S. C. et al. 2000, MNRAS, 319, 318.
- Chapman et al. (2001) Chapman, S. C., Richards, E. A., Lewis, G. F., Wilson, G., and Barger, A. J. 2001, ApJ, 548, L147.
- Chapman et al. (2002) Chapman, S. C., Lewis, G. F., Scott, D., Borys, C., and Richards, E. 2002a, ApJ, 570, 557.
- Chapman et al. (2002) Chapman, S. C., Shapley, A., Steidel, C., and Windhorst, R. 2002b, ApJ, 572, L1.
- Chapman et al. (2003) Chapman, S. C., et al. 2003, Accepted to ApJ.
- Chary, Becklin & Armus (2002) Chary, R., Becklin, E. E., and Armus, L. 2002, ApJ, 566, 229.
- Condon, Helou & Jarrett (2002) Condon, J. J., Helou, G., and Jarrett, T. H. 2002, AJ, 123, 1881.
- Condon et al. (1993) Condon, J. J., Helou, G., Sanders, D. B., and Soifer, B. T. 1993, AJ, 105, 1730.
- Dey et al. (1999) Dey, A., Graham, J. R., Ivison, R. J., Smail, I., Wright, G. S., and Liu, M. C. 1999, ApJ, 519, 610.
- Djorgovski et al. (1998) Djorgovski, S. G., Kulkarni, S. R., Bloom, J. S., Goodrich, R., Frail, D. A., Piro, L., and Palazzi, E. 1998, ApJ, 508, L17.
- Djorgovski et al. (2001) Djorgovski, S. G., Frail, D. A., Kulkarni, S. R., Bloom, J. S., Odewahn, S. C., and Diercks, A. 2001a, ApJ, 562, 654.
- Djorgovski et al. (2001) Djorgovski, S. G. et al. 2001b, in Gamma-ray Bursts in the Afterglow Era, 218.
- Dunlop et al. (2002) Dunlop, J. et al. 2002, Submitted to MNRAS; astro-ph/0205480.
- Elbaz et al. (2002) Elbaz, D., Flores, H., Chanial, P., Mirabel, I. F., Sanders, D., Duc, P.-A., Cesarsky, C. J., and Aussel, H. 2002, A&A, 381, L1.
- Fomalont et al. (2002) Fomalont, E. B., Kellermann, K. I., Partridge, R. B., Windhorst, R. A., and Richards, E. A. 2002, AJ, 123, 2402.
- Frail et al. (2002) Frail, D. A. et al. 2002a, ApJ, 565, 829.
- Frail et al. (2002) Frail, D. A., et al. 2002b, in prep.
- Frayer et al. (1998) Frayer, D. T., Ivison, R. J., Scoville, N. Z., Yun, M., Evans, A. S., Smail, I., Blain, A. W., and Kneib, J.-P. 1998, ApJ, 506, L7.
- Frayer et al. (1999) Frayer, D. T. et al. 1999, ApJ, 514, L13.
- Harrison et al. (2001) Harrison, F. A. et al. 2001, ApJ, 559, 123.
- Hu & Ridgway (1994) Hu, E. M. and Ridgway, S. E. 1994, AJ, 107, 1303.
- Hughes et al. (1998) Hughes, D. H. et al. 1998, Nature, 394, 241.
- Ivison et al. (1998) Ivison, R. J., Smail, I., Le Borgne, J.-F., Blain, A. W., Kneib, J.-P., Bezecourt, J., Kerr, T. H., and Davies, J. K. 1998, MNRAS, 298, 583.
- Ivison et al. (2000) Ivison, R. J., Smail, I., Barger, A. J., Kneib, J.-P., Blain, A. W., Owen, F. N., Kerr, T. H., and Cowie, L. L. 2000, MNRAS, 315, 209.
- Kennicut (1998) Kennicut, R. C. 1998, Ann. Rev. Astr. Ap., 36, 131.
- Lamb & Reichart (2000) Lamb, D. Q. and Reichart, D. E. 2000, ApJ, 536, 1.
- Lewis et al. (2003) Lewis, G. F., Chapman, S. C., Helou, G., Borys, C., Fahlman, G., Scott, D. 2003, Submitted to ApJ.
- MacFadyen & Woosley (1999) MacFadyen, A. I. and Woosley, S. E. 1999, ApJ, 524, 262.
- MacFadyen, Woosley & Heger (2001) MacFadyen, A. I., Woosley, S. E., and Heger, A. 2001, ApJ, 550, 410.
- Madau et al. (1996) Madau, P., Ferguson, H. C., Dickinson, M. E., Giavalisco, M., Steidel, C. C., and Fruchter, A. S. 1996, MNRAS, 283, 1388.
- Meurer, Heckman & Calzetti (1999) Meurer, G. R., Heckman, T. M., and Calzetti, D. 1999, ApJ, 521, 64.
- Overzier et al. (2001) Overzier, R. A., Röttgering, H. J. A., Kurk, J. D., and De Breuck, C. 2001, A&A, 367, L5.
- Patton et al. (2002) Patton, D. R. et al. 2002, ApJ, 565, 208.
- Peacock et al. (2000) Peacock, J. A. et al. 2000, MNRAS, 318, 535.
- Piro et al. (2002) Piro, L. et al. 2002, ApJ, 577, 680.
- Ramirez-Ruiz, Trentham & Blain (2002) Ramirez-Ruiz, E., Trentham, N., and Blain, A. W. 2002, MNRAS, 329, 465.
- Sanders & Mirabel (1996) Sanders, D. B. and Mirabel, I. F. 1996, ARA&A, 34, 749+.
- Smail, Ivison & Blain (1997) Smail, I., Ivison, R. J., and Blain, A. W. 1997, ApJ, 490, L5+.
- Smail et al. (2002) Smail, I., Ivison, R. J., Blain, A. W., and Kneib, J.-P. 2002, MNRAS, 331, 495.
- Smith et al. (1999) Smith, I. A. et al. 1999, A&A, 347, 92.
- Smith et al. (2001) Smith, I. A., Tilanus, R. P. J., Wijers, R. A. M. J., Tanvir, N., Vreeswijk, P., Rol, E., and Kouveliotou, C. 2001, A&A, 380, 81.
- Soifer et al. (1984) Soifer, B. T. et al. 1984, ApJ, 283, L1.
- Stasinska (2002) Stasinska, G. 2002, To be published in the proceedings of the XIII Canary Islands Winter School of Astrophysics; astro-ph/0207500.
- Steidel et al. (1999) Steidel, C. C., Adelberger, K. L., Giavalisco, M., Dickinson, M., and Pettini, M. 1999, ApJ, 519, 1.
- Taylor (1982) Taylor, J. R. 1982, An introduction to error analysis. The study of uncertainties in physical measurements, : A Series of Books in Physics, Oxford: University Press, and Mill Valley: University Science Books, 1982).
- Vreeswijk et al. (2001) Vreeswijk, P. M., Fender, R. P., Garrett, M. A., Tingay, S. J., Fruchter, A. S., and Kaper, L. 2001a, A&A, 380, L21.
- Vreeswijk et al. (2001) Vreeswijk, P. M. et al. 2001b, ApJ, 546, 672.
- Waxman & Draine (2000) Waxman, E. and Draine, B. T. 2000, ApJ, 537, 796.
- Webb et al. (2002) Webb, T. et al. 2002, Accepted to ApJ; astro-ph/0201181.
- Wilson et al. (2002) Wilson, G., Cowie, L. L., Barger, A. J., and Burke, D. J. 2002, AJ, 124, 1258.
- Yost et al. (2002) Yost, S. A. et al. 2002, ApJ, 577, 155.
- Yun & Carilli (2002) Yun, M. S. and Carilli, C. L. 2002, ApJ, 568, 88.
| Source | Obs. Date | ||||
|---|---|---|---|---|---|
| (UT) | (mJy) | (mJy) | (mJy) | ||
| GRB 970228 | 0.695 | Nov. 1, 2001 | |||
| Nov. 2, 2001 | |||||
| GRB 970508 | 0.835 | Sep. 9, 2001 | |||
| Sep. 10, 2001 | |||||
| Sep. 12, 2001 | |||||
| GRB 971214 | 3.418 | Nov. 2, 2001 | |||
| GRB 980329 | Sep. 13, 2001 | ||||
| Oct. 29, 2001 | |||||
| GRB 980613 | 1.096 | Nov. 1, 2001 | |||
| Nov. 2, 2001 | |||||
| Dec. 7, 2001 | |||||
| GRB 980703 | 0.966 | Sep. 10, 2001 | |||
| Sep. 12, 2001 | |||||
| GRB 991208 | 0.706 | Dec. 6, 2001 | |||
| Dec. 7, 2001 | |||||
| GRB 991216 | 1.020 | Oct. 31, 2001 | |||
| Nov. 3, 2001 | |||||
| Nov. 4, 2001 | |||||
| GRB 000210 | 0.846 | Sep. 12, 2001 | |||
| Sep. 13, 2001 | |||||
| Sep. 14, 2001 | |||||
| GRB 000301C | 2.034 | Dec. 29, 2001 | |||
| Dec. 30, 2001 | |||||
| GRB 000418 | 1.119 | Oct. 30, 2001 | |||
| Oct. 31, 2001 | |||||
| Nov. 1, 2001 | |||||
| GRB 000911 | 1.058 | Sep. 13, 2001 | |||
| Sep. 14, 2001 | |||||
| Oct. 31, 2001 | |||||
| Nov. 3, 2001 | |||||
| Nov. 4, 2001 | |||||
| GRB 011211 | 2.140 | Dec. 29, 2001 | |||
| Dec. 30, 2001 | |||||
| Dec. 31, 2001 |
Note. — The columns are (left to right), (1) Source name, (2) source redshift, (3) UT date for each observation, (4) flux density at 350 GHz, (5) flux density at 670 GHz, and (6) weighted-average flux density at 350 GHz.
| Source | Telescope | Obs. Dates | Obs. Freq. | ||
|---|---|---|---|---|---|
| (UT) | (GHz) | (Jy) | |||
| GRB 970828 | 0.958 | VLA | Jun. 4–7, 2001 | 8.46 | |
| GRB 980329 | VLA | Jul. 22 – Sep. 10, 2001 | 8.46 | ||
| GRB 980613 | 1.096 | VLA | May 18–26, 2001 | 8.46 | |
| GRB 981226 | VLA | Jul. 24 – Oct. 15, 2001 | 8.46 | ||
| GRB 991208 | 0.706 | VLA | Apr. 14 – Jul. 20, 2001 | 8.46 | |
| GRB 991216 | 1.020 | VLA | Jun. 8 – Jul. 13, 2001 | 8.46 | |
| GRB 000210 | 0.846 | VLA | Sep. 16 – Oct. 12, 2001 | 8.46 | |
| GRB 000301C | 2.034 | VLA | Jun. 15 – Jul. 22, 2001 | 8.46 | |
| GRB 000418 | 1.119 | VLA | Jan. 14 – Feb. 27, 2002 | 1.43 | |
| VLA | Dec. 8, 2001 – Jan. 10, 2002 | 4.86 | |||
| VLA | May 28 – Jun. 3, 2001 | 8.46 | |||
| GRB 000911 | 1.058 | VLA | Mar. 21 – Apr. 2, 2001 | 8.46 | |
| GRB 000926 | 2.037 | VLA | Jun. 11 – Jul. 12, 2001 | 8.46 | |
| GRB 010222 | 1.477 | VLA | Sep. 29 – Oct. 13, 2001 | 4.86 | |
| VLA | Jun. 24 – Aug. 27, 2001 | 8.46 | |||
| GRB 990510 | 1.619 | ATCA | Apr. 28, 2002 | 1.39 | |
| GRB 990705 | 0.840 | ATCA | Apr. 21–22, 2002 | 1.39 | |
| GRB 000131 | 4.5 | ATCA | Apr. 28, 2002 | 1.39 | |
| GRB 000210 | 0.846 | ATCA | Apr. 27–28, 2002 | 1.39 |
Note. — The columns are (left to right), (1) Source name, (2) source redshift, (3) Telescope, (4) range of UT dates for each observation, (5) observing frequency, and (6) peak flux density at the position of each source.
| Source | Submm SFR | Radio SFR | Optical SFR |
|---|---|---|---|
| (M⊙ yr-1) | (M⊙ yr-1) | (M⊙ yr-1) | |
| GRB 970228 | 1 | ||
| GRB 970508 | 1 | ||
| GRB 970828 | 1.2 | ||
| GRB 971214 | 3 | ||
| GRB 980329a | |||
| GRB 980613 | |||
| GRB 980703 | 10 | ||
| GRB 981226b | |||
| GRB 990510 | |||
| GRB 990705 | |||
| GRB 991208 | 20 | ||
| GRB 991216 | |||
| GRB 000131 | |||
| GRB 000210 | 3 | ||
| GRB 000301C | |||
| GRB 000418 | 55 | ||
| GRB 000911 | 2 | ||
| GRB 000926 | |||
| GRB 010222 | 1.5 | ||
| GRB 011211 |
Note. — The columns are (left to right), (1) Source name, (2) SFR derived from the sub-mm flux, and (3) SFR derived from the radio flux, and (4) SFR derived from optical observations. The upper limits represent values in the case when the measured flux was negative (see Table 1).