Possible arcminute-separation gravitational lensed QSOs in the 2dF QSO survey
Abstract
We report the possible discovery of multiple gravitationally-lensed images of QSOs with angular separations on arcminute scales. The QSOs were selected from the completed 2dF QSO Survey as having redshifts and optical colours which are statistically consistent. In this paper we present higher-quality optical spectra of the candidates and discuss the likelihood of their genuinely being systems lensed by massive clusters of galaxies. From a comparison of the spectra it appears that up to six pairs of QSOs may be lensed multiple images, although the true number may be less than that and further observations should be undertaken to amass more evidence and to detect the lensing clusters. Two of the candidates may be associated with low redshift clusters of galaxies.
keywords:
Gravitational lenses – QSOs.1 Introduction
Strong gravitational lensing of background objects by massive clusters of galaxies is expected to produce multiple images with wide separations, , and the multiple images of background lensed galaxies have long been known with radii of giant arc systems up to (e.g. Kneib et al. 1996; Sahu et al. 1998; Smail et al. 1995). However, despite a number of searches, primarily in large-area radio surveys (e.g. Maoz & Rix 1993; Maoz et al. 1997; Ofek et al. 2001, 2002; Phillips et al. 2001a, b), widely-separated multiple images of QSOs have not yet been found. This is attributable to the low probability of strong lensing along any given line of sight coupled with the relatively low numbers of known QSOs. The widest separation QSO lensed systems have separations (Kochanek et al., 2002). Other wide-separation multiple QSO systems found to date are more likely to be “binary QSOs” (that is, a pair of active black holes cohabiting the same parent host galaxy) rather than multiple images of the same QSO (Kochanek et al., 1999).
We have searched a catalogue of 22,163 QSOs that comprises the recently completed 2dF QSO survey (“the 2QZ survey”) for candidate wide-separation lensed QSO systems and have obtained higher signal-to-noise spectra in an attempt to eliminate obvious non-lensed systems and to identify systems that are likely to be genuine lensed systems. After an incomplete survey of the most likely candidates, there remain six systems which, with varying degrees of confidence, are likely to be lensed.
2 The selection of candidate lensed systems from the 2QZ survey
The 2QZ survey covers 740 deg2 in two strips of sky, one centred on the South Galactic Pole region and the other on the celestial equator in the region of the North Galactic Pole. The survey photometry is described by Smith et al. (2002) and the initial release of the first 10,000 QSOs is described by Croom et al. (2001a). In constructing the 2QZ survey, candidate QSOs were first selected from , and photographic photometry of morphologically-stellar objects, and objects whose colours lay bluewards of the main stellar locus were selected for low resolution spectroscopy at the two-degree field (2dF) facility at the Anglo-Australian Telescope.
The initial spectra obtained were of sufficient quality that reliable identifications of QSOs and measurements of their redshifts could be made, with an r.m.s. error in redshift measurement of typically 0.0035 (Croom et al., 2001a), although it should be noted that the redshift error for an individual object depends on its brightness and emission-line equivalent widths as well as observing conditions. The absolute accuracy of the photometry in each band is estimated as magnitudes at the faint survey limit (Smith et al., 2002). The relative photometric accuracy for objects measured close together on the same photographic plate is better than this, however: Mitchell (1989) found that, for objects more than two magnitudes brighter than the completeness limit of the photographic plate, relative photometry accurate to magnitudes was typical, with that value rising rapidly to values magnitudes as the plate limit is approached.
The resulting catalogue of photographic photometry and spectroscopically confirmed QSOs was then searched for pairs or multiple systems whose colours were consistent given the large photometric uncertainties and whose redshifts were consistent given the typical redshift uncertainty. To determine the colour consistency, it was assumed that two QSOs, if lensed, should have the same , and magnitudes apart from a magnitude offset arising from differential magnification of the images in a lensed system, and thus assuming negligible effects due to variations in QSO colours with time (see section 4). The statistic used as the measure of colour consistency was
where is the difference in apparent magnitude of the two QSOs measured in waveband and is the average magnitude difference for that QSO pair. Redshift consistency was measured by the difference, in 2QZ catalogue redshift of two QSOs. Candidate multiple systems were initially selected if they satisfied the criteria , and angular separation . The colour criterion is close to the expected scatter in this statistic, given the photometric errors at the survey limit, and hence we expect the initial colour selection to select only % of the lensed systems. The redshift criterion is a factor two larger than the expected scatter in and this criteria should allow the majority of lensed systems to be selected. The stringent colour criterion was chosen in this initial study in order to maximise the probability of finding lensed systems, and hence further observations should be carried out to establish the true completeness of the selected sample.
A further check was made on the consistency of their radio properties by searching for detections in the NVSS (Condon et al., 1998). One candidate pair with clearly discrepant radio detections was removed from the sample of candidates. The NVSS properties of two remaining pairs are discussed further in section 3.
Candidates with were selected from 12307 QSOs in the SGP region and from 9856 QSOs in the NGP region of the 2QZ survey, and 38 pairs of QSOs in total met these criteria. Of the QSOs with confirmed redshifts, there were no candidate systems selected with more than two members, although some of the pairs do have additional -selected companions for which 2QZ spectroscopic observations either were not carried out or did not lead to a positive identification.
Our expectation is that the majority of the selected pairs will not prove to be lensed systems. Test samples were also constructed in attempt to assess the possible contamination. First, QSOs pairs that are more widely separated, but still within one degree of each other and measured on the same photographic plates, were selected with and the distribution of was compared with the distribution of the candidate pairs. No statistically-significant difference was found, although this is probably a reflection of the large errors in arising from the large photographic photometry errors. A second test sample comprising QSO pairs with and was selected and the distribution of angular separations, normalised by the total number of pairs selected with , was compared with the candidate lens sample selected to have . This time there was an excess of pairs on arcminute scales in the sample of candidate lensed systems consistent with a minority of the pairs being lensed systems, but because of the small numbers of pairs selected the test was not statistically significant. Hence at this stage there is no evidence either for or against the hypothesis that the selected sample contains a subset of lensed systems. Further evidence needs to be collected on all members of the sample in order to establish its completeness and contamination.
A key part of that evidence is the follow-up spectroscopy described in the next section. Because of limitations of observing time and observing conditions, only a subset of the candidates have had such observations, and only that subset is described in the remainder of this paper. For prioritising the observations, the pairs were ranked in and also in : a composite rank was produced by multiplying these ranks and the top candidates in each region were observed. In the SGP region, 10 pairs were observed, but the spectroscopic follow-up is particularly sparse in the NGP region, where only for one pair have spectra been obtained of sufficient quality to allow some assessment of whether or not it may be lensed. At this stage the sample reported here cannot be regarded as either being complete or free from contamination by non-lensed pairs of QSOs. We postpone any discussion of the completeness of the sample to later work. We anticipate that in future the candidate QSO pairs in the NGP region will also have the benefit of more accurate, five-band, colours from the Sloan Digital Sky Survey (Stoughton et al., 2002), which should lead both to samples of candidates with lower contamination and with better quantified photometric uncertainties.
In the following sections each pair is designated by the IAU naming convention applied to the mean position of the pair, in the FK5 (equinox J2000) coordinate system.
| (J2000) | (J2000) | R.A. (J2000) | dec (J2000) | b | R.A. (J2000) | dec (J2000) | b | ||||
|---|---|---|---|---|---|---|---|---|---|---|---|
| 14 35 07.4 | 00 08 53 | 2.378 | 0.03 | .0086 | 33 | 14 35 08.32 | 00 08 44.4 | 20.13 | 14 35 06.42 | 00 09 01.5 | 20.03 |
| 01 50 55.6 | 29 21 57 | 1.556 | 0.09 | .0011 | 200 | 01 50 50.10 | 29 23 06.3 | 19.77 | 01 51 01.10 | 29 20 47.5 | 20.34 |
| 01 35 31.2 | 30 21 54 | 1.683 | 0.14 | .0009 | 46 | 01 35 31.01 | 30 22 17.1 | 20.69 | 01 35 31.49 | 30 21 31.9 | 20.45 |
| 02 15 55.8 | 29 06 21 | 2.264 | 0.07 | .0063 | 347 | 02 15 48.09 | 29 08 42.0 | 20.08 | 02 16 03.54 | 29 03 59.8 | 20.79 |
| 02 23 00.7 | 29 49 05 | 1.416 | 0.02 | .0018 | 236 | 02 22 59.28 | 29 51 01.5 | 19.64 | 02 23 02.03 | 29 47 08.0 | 20.50 |
| 22 28 23.4 | 28 57 35 | 2.453 | 0.17 | .0011 | 270 | 22 28 13.72 | 28 58 22.1 | 20.64 | 22 28 33.07 | 28 56 48.9 | 19.94 |
| 22 35 20.5 | 27 17 18 | 1.810 | 0.07 | .0049 | 316 | 22 35 16.20 | 27 19 45.4 | 18.50 | 22 35 24.82 | 27 14 50.5 | 20.16 |
| 22 10 05.1 | 32 04 00 | 2.119 | 0.11 | .0061 | 330 | 22 09 56.21 | 32 06 00.3 | 20.81 | 22 10 14.03 | 32 02 00.0 | 20.71 |
| 22 03 09.4 | 31 33 49 | 1.643 | 0.19 | .0015 | 89 | 22 03 11.80 | 31 34 21.6 | 19.75 | 22 03 07.09 | 31 33 16.5 | 19.43 |
| 22 50 32.1 | 31 05 00 | 0.637 | 0.19 | .0059 | 242 | 22 50 22.71 | 31 04 45.4 | 18.40 | 22 50 41.45 | 31 05 14.4 | 20.17 |
| 23 29 07.8 | 29 57 00 | 1.841 | 0.12 | .0002 | 67 | 23 29 06.87 | 29 57 31.9 | 20.28 | 23 29 08.69 | 29 56 28.7 | 19.70 |
3 Further optical spectroscopy
Spectra were obtained of the candidate pairs at the William Herschel 4.2-m. telescope (WHT) on 2002 February 5-6 and at the Anglo-Australian 3.9-m. telescope (AAT) on 2002 September 6-10. At the WHT, the ISIS long-slit spectrograph with 300B grating and EEV detector was used with on-chip binning to provide spectra from the blue arm with 1.7Å pixel-1 dispersion. Observing conditions were poor, with seeing of about for the spectra reported here, resulting in spectra with resolution about 8Å. Data were also obtained with the ISIS red arm but were of insufficient quality to be useful. Observations at the AAT were carried out in generally good conditions with seeing in the range . The 300B grating on the RGO long-slit spectrograph with EEV detector provided a dispersion of 1.6Å pixel-1 and resolution of typically 6Å(depending on the choice of slit width, which was varied according to the seeing at the time).
The typical integration time on each QSO varied between one hour and four hours depending on observing conditions and brightness of the QSO. In most cases the QSOs in each pair were sufficiently far apart that they could not be observed simultaneously. Instead, integrations on each QSO were split into intervals of 30 minutes duration, and no more than three integrations were carried out sequentially on one QSO without then observing the other member of the pair. By this process we could be sure that the spectra were taken under sufficiently similar conditions that any differences between them are likely to be genuine. For those QSOs observed in this way the slit position angle was arranged to be at the parallactic angle. In two cases, J14350008 and J01353021, the pair members were close together and were observed simultaneously with the slit oriented at the appropriate angle. In the case of J14350008 the pair could be observed at hour angles such that the slit position angle was within 20 degrees of the parallactic angle. In the case of J01353021 this was not possible, but the pair could be observed within 30 degrees of the zenith where the effects of differential refraction should be small.
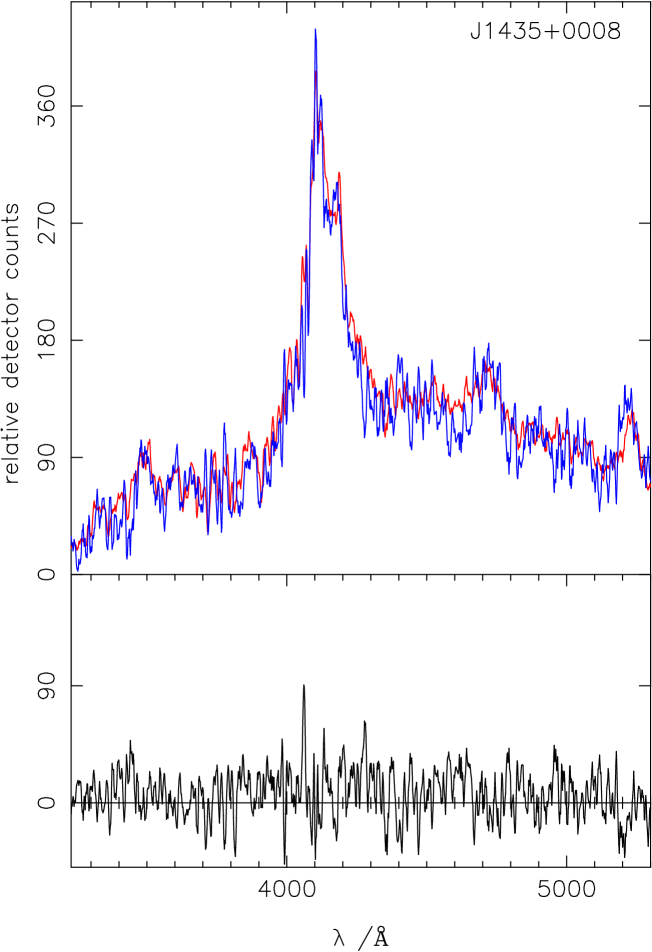
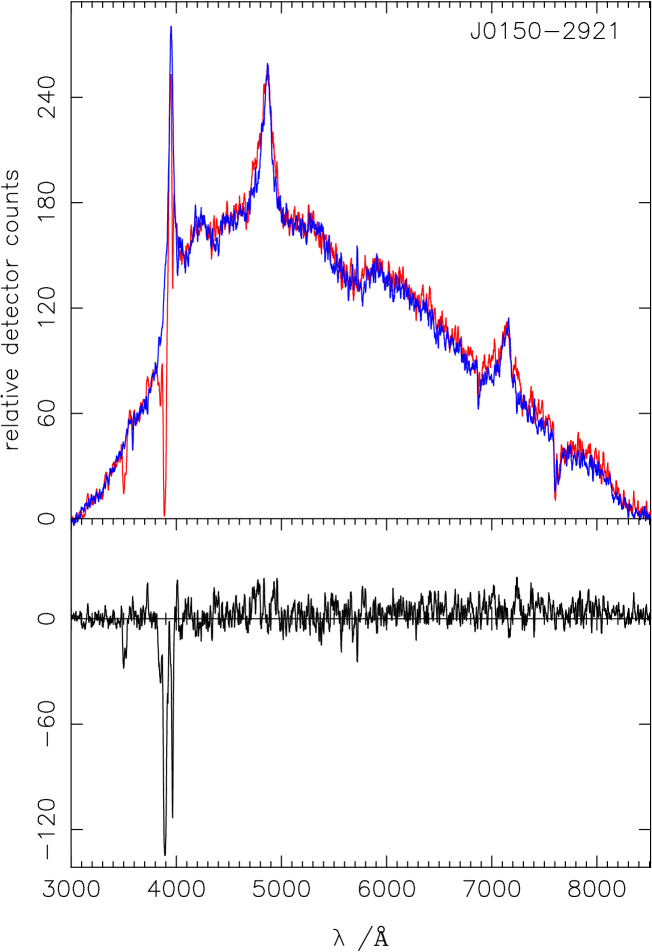
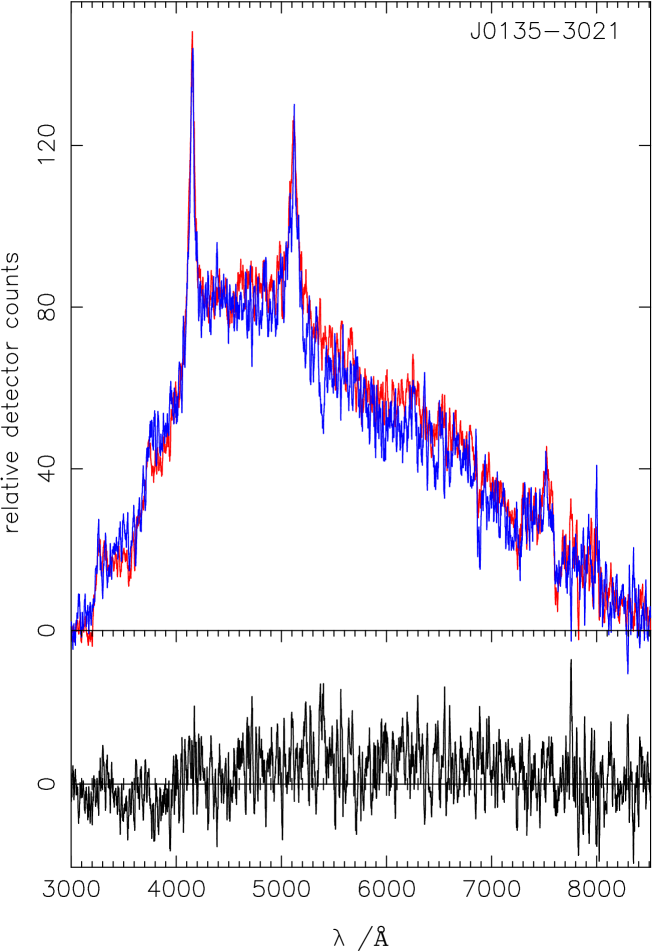
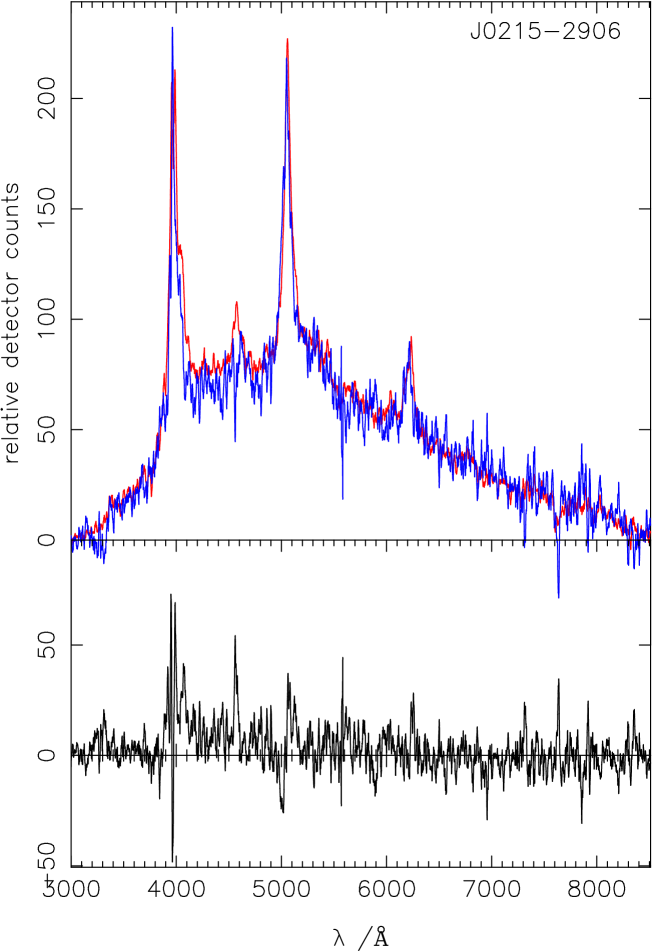
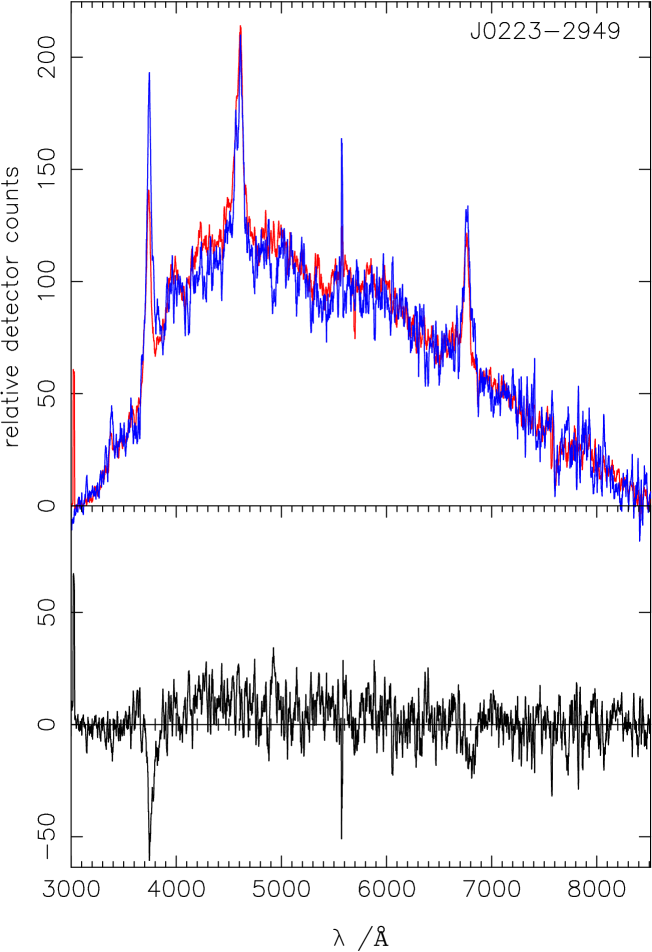
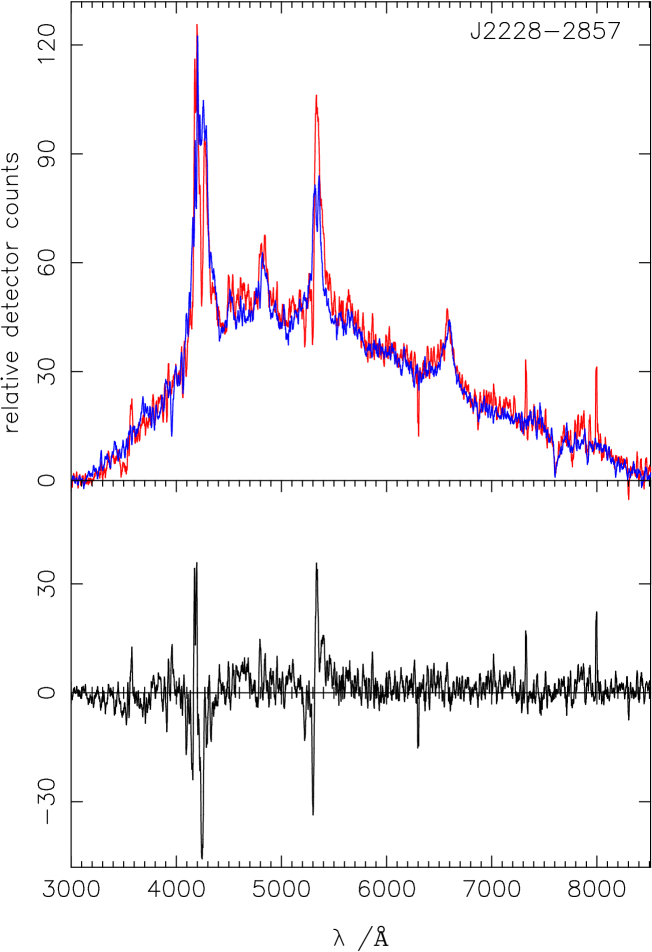
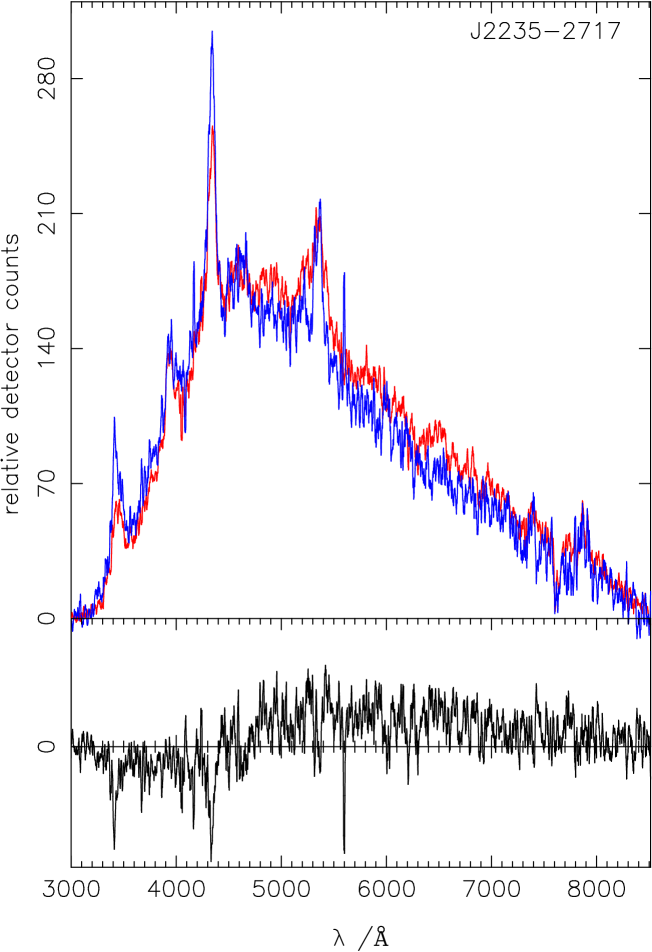
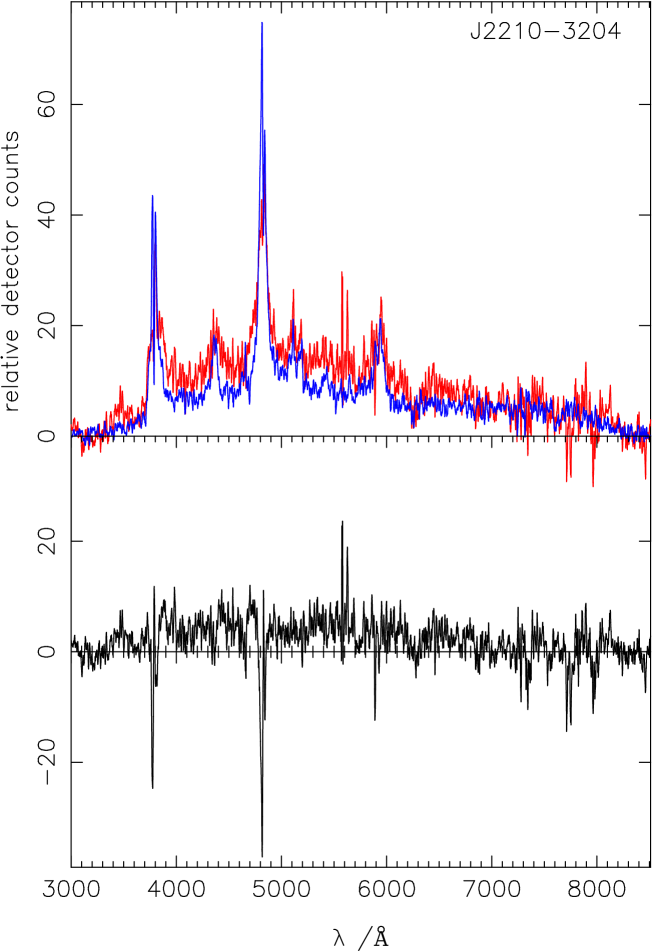
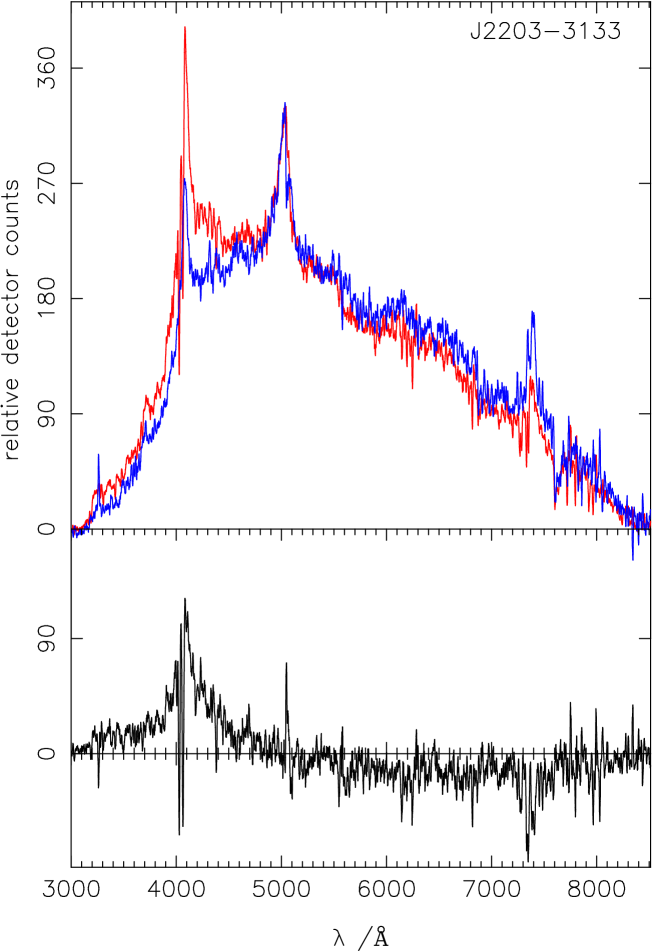
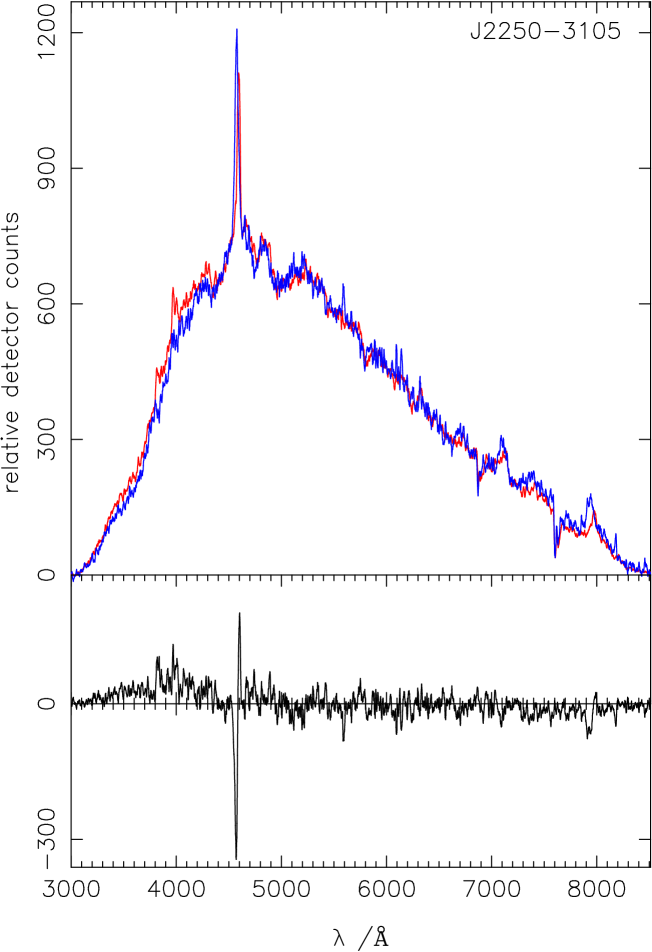
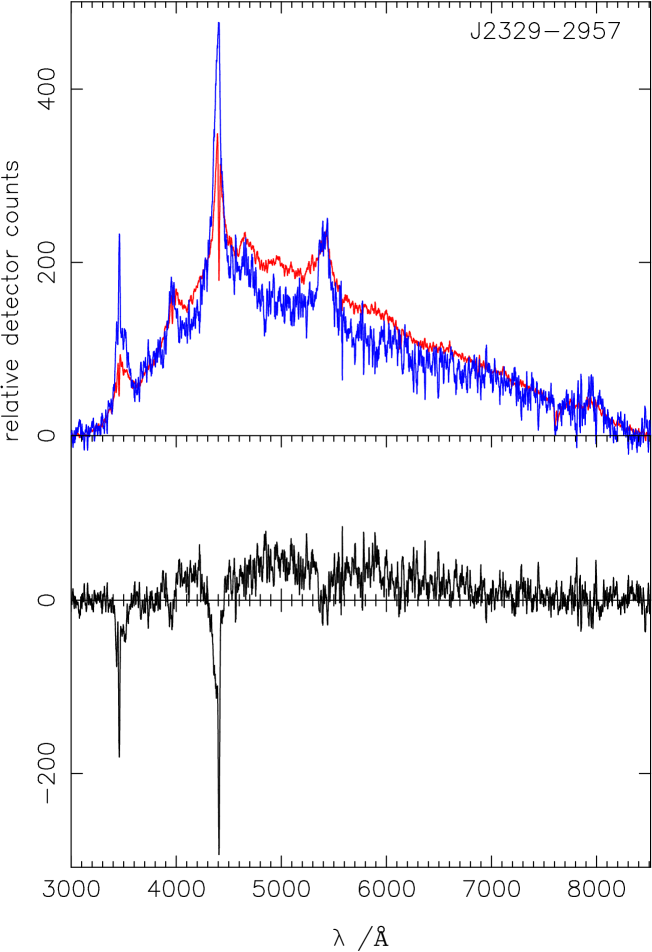
Spectra of all the pairs observed are presented in Fig 1. In order to improve the signal-to-noise ratio per pixel the spectra have been smoothed with a top-hat function to a resolution specified in the figure caption for each pair. Each panel shows spectra of the two members of each pair superimposed. The spectra have been scaled by the total value of the observed (uncalibrated) count rate so that they may be compared. Each panel also shows the difference between the scaled spectra, for comparison. The spectra have been bias-frame subtracted and flatfielded in order to remove instrumental features from the spectra, but have not had any flux calibration applied, in order to facilitate evaluation of any differences. The noise in the spectra is dominated by photon noise from the sky background, and the noise in each wavelength pixel is more uniform with wavelength in uncalibrated spectra. Absorption features arising from the terrestrial atmosphere remain in the spectra, most prominently at Å, and should be ignored when comparing spectra. The ratios of the total count rate between the spectra are given in Table 2.
One expectation of the “lensed QSO” hypothesis is that the two images should have the same redshift. As the pairs were selected to have 2QZ survey redshift differences we would, in the absence of QSO clustering, expect the distribution of WHT or AAT redshift differences to be uniformly distributed within that range. QSO clustering has a scale length in redshift of about 0.003 at (Croom et al., 2001b), and if the QSOs in each pair are individual objects we would expect them also to have redshift differences arising from their peculiar velocities, so the “separate QSOs” hypothesis predicts that even in the presence of QSO clustering there should still be a broad distribution of redshift differences when measured from the WHT or AAT spectra.
To test this, the redshift differences between each pair of WHT or AAT spectra have been measured by cross-correlation, about subtracting the continuum from the uncalibrated spectra and avoiding the atmospheric absorption feature at Å. Uncertainties in the redshift differences have been estimated assuming the noise in the spectra is dominated by uncorrelated photon shot noise in each pixel. A Monte-Carlo method was adopted in which Gaussian noise of the same amplitude as the noise in each spectrum was added to smoothed versions of each spectrum to create a number of synthetic spectra with the same spectral features and noise properties as the actual data. The synthetic spectra were then cross-correlated with each other and the quoted uncertainty in the redshift difference is the rms of the values derived from the synthetic spectra. These uncertainties are lower limits to the true uncertainty as they contain no allowance for systematic differences and noise that may be correlated between pixels. However, the spread in values of the measured redshift differences is consistent with these uncertainty estimates, indicating that photon shot noise is the dominant source of uncertainty. Remarkably, we find six of the pairs to have velocity differences less than 200 km s-1 (Table 2 and Fig. 2). This is a strong indication that a number of these pairs are lensed systems. All separations for these pairs are sufficiently large that, if they were two different QSOs, the linear separations would be greater than 1 Mpc and they must occupy separate host galaxies. QSO clustering would cause a peak in the redshift distribution at , but broadened not only by the measurement error but also by the relative peculiar velocities of the QSO host galaxies. Peculiar velocities at high redshift are expected to be lower than in low-redshift galaxy surveys, but simulations still predict pairwise velocity dispersions km s-1 (Zhao et al., 2002), significantly larger than would be inferred from Fig. 2.
Although the redshift difference is a quantitative measure of similarity between the spectra, we should also look for other differences in the spectra. We now give a brief evaluation of the comparison of the spectra of each pair. The discussion is ordered by an approximate degree of confidence in the likelihood that the pair is a lensed QSO. This evaluation is based not only on redshift difference but also on similarity of continuum shapes, emission line equivalent widths, line ratios, velocity widths and profiles. This comparison is necessarily somewhat subjective. It is never possible to prove that a pair of spectra are multiple images of the same lensed QSO, and in this case we have to rely on building up a body of evidence which can then be interpreted as either supporting the lensed hypothesis or providing evidence against it. The spectra we have obtained only cover the range of accessible optical wavelengths and vary widely in their signal-to-noise. The spectra of a QSO pair viewed with high signal-to-noise may appear to be discrepant, such as J22503105, whereas such a discrepancy may not have been apparent in lower signal-to-noise spectra. The only reliable solution to this effect is to obtain higher quality spectra and other evidence for those pairs with poor signal-to-noise. With these factors in mind, any evaluation at this stage cannot be regarded as conclusive, but nonetheless should help us to identify those QSOs that are most likely to be lensed, that can then be the subject of further observations to amass more evidence. The candidates we have observed were selected a priori to have similar optical colours (albeit with a large uncertainty) and redshifts, so we should not be too surprised to find that almost all of the observed pairs do indeed have very similar overall continuum shapes in the observations presented here. Instead, we must appeal to the wide range of detail in QSO spectra which we would not expect to match when comparing the spectra of independent QSOs.
| Pair | redshift difference | spectrum flux ratio |
|---|---|---|
| J14350008 | 0.40 | |
| J01502921 | 0.72 | |
| J01353021 | 0.71 | |
| J02152906 | 0.27 | |
| J02232949 | 0.32 | |
| J22282857 | 2.13 | |
| J22352717 | 0.28 | |
| J22103204 | 2.00 | |
| J22033133 | 0.67 | |
| J22503105 | 0.27 | |
| J23292957 | 0.19 |

3.1 J14350008
This pair was the only one presented here that was observed at the WHT. Other pairs were attempted but only inadequate spectra were obtained. Observing conditions were poor, with poor atmospheric transparency and poor seeing. The ISIS red arm spectra contain too little signal, and we show here a comparison of the blue-arm spectra only. The dichroic between the red and blue arms of ISIS causes a sharp fall in response at Å, with some oscillations in that response in this wavelength range. This is a good lensed QSO candidate, with a small redshift difference and an unusual ratio of Ly- and NV which is common to both spectra.
This QSO pair also appears in the Sloan Digital Sky Survey (SDSS) Early Data Release (Stoughton et al., 2002). Table 3 gives the SDSS photometry for this pair, together with the differences in apparent magnitudes and the associated error. It can be seen that the colours of the two QSOs are consistent with being the same to substantially higher accuracy than was possible with the 2QZ photographic photometry, although there does seem to be some some evidence for a systematic difference in colour with waveband. This may be taken as evidence against the system being lensed, or it may be accounted for either by spectral variability or by differential extinction between the light paths.
We also note the possibility of an elegant test of the lensed-QSO hypothesis: if these are images of the same QSO then, at redshifts near the QSO, the Ly- forest absorption lines should be identical in both spectra. If the pair were not a single lensed QSO, then the QSO separation would be Mpc and the Ly- lines would not be expected to be common between the QSOs: sight lines that are separated on such scales when comparing unrelated QSOs show significant differences in their Ly- forest absorption (D’Odorico et al., 1998). Forest lines at redshifts significantly different from the QSO may nonetheless differ between the images in either hypothesis because the light rays for each image would have diverged to a significant extent. In the case of J14350008 the ultra-violet part of the spectrum is noisy, but nonetheless it does appear to have possible absorption features in common between the spectra.
3.2 J01502921
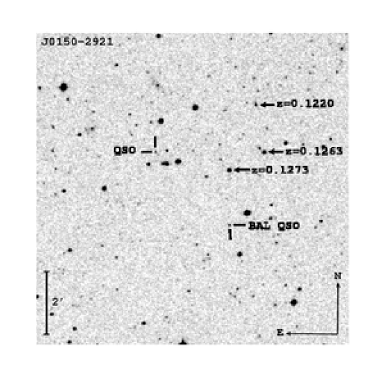
This is possibly one of the most enigmatic pairs of spectra obtained. The spectra have good signal-to-noise ratio and appear identical in every respect apart from one gross feature: the presence of a broad absorption line system in one of the spectra. For reasons described in section 4 we do not believe that this should be taken as evidence against the system being a lensed QSO, and because of the otherwise striking similarity between the spectra in these observations with good signal-to-noise we regard this as being one of the systems most likely to be a single lensed QSO.
This system also has a number of bright galaxies in the vicinity, of which three have had redshifts measured by the 2dF Galaxy Redshift Survey (Colless et al., 2003). The positions and redshifts of the two QSOs and of the three galaxies are shown in Fig. 3. This system is discussed further in section 5.
We also note here that although neither of the QSOs is detected in the NVSS survey there are four detected sources of radio emission extending over some arcminutes approximately symmetrically placed with respect to the centre of the system, and approximately perpendicular to it. It may be that the radio emission is the substructure of a single extended double radio source associated with one of the galaxies in the field.
3.3 J01353021
There are some small differences visible in the ultraviolet parts of the spectra of this pair which lead to the somewhat high value of redshift difference given in Table 2. However, these spectra were taken simultaneously, with the slit rotated to the position angle defined by the coordinates of the two QSOs, and the observations presented here were made with the pair within about thirty degrees of the zenith. Slight errors in aligning the slit with the pair could result in a small differential loss of light owing to atmospheric refraction which may contribute to the small differences at Å. At this stage we still regard this pair as possibly being a lensed QSO, although further observations are needed.
3.4 J02152906
This pair has very similar spectra with a redshift difference of zero to high accuracy. There are some residual features present in the difference of the scaled spectra which may argue against the lensed QSO hypothesis but which may simply be observational noise or may reflect low-level emission variations (see also section 4).
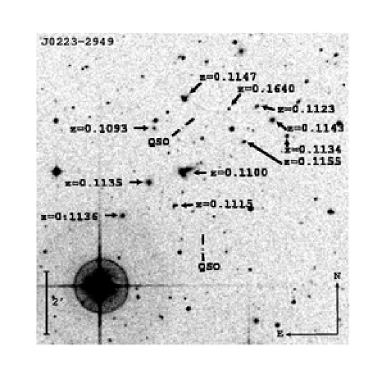
3.5 J02232949
This pair has spectra identical within the noise except in the CIV line, where there is a residual difference whose maximum is about one-third the maximum of the emission-line. The other emission lines and the detailed continuum shape are extremely similar, however, and the redshift difference is consistent with zero at the 2-sigma level. We regard this as being a possible lensed system that requires further observations.
This system also has a number of bright galaxies in the vicinity (Fig. 3), of which ten have had redshifts measured by the 2dF Galaxy Redshift Survey (Colless et al., 2003). This system is discussed further in section 5.
There is a 8.6 mJy NVSS (Condon et al., 1998) radio source to the north of the northern QSO which is not reproduced near the southern QSO. However, that radio source is coincident with the bright peculiar-shaped galaxy at and it is unlikely that the radio source is related to the QSO.
There are also weaker NVSS detections at the NVSS detection limit, one a 2.8 mJy source from the southern QSO, the other a 3.5 mJy source from the northern QSO. Both the reality of these weak radio detections and the possibility of their being associated with the QSOs needs investigation with a higher resolution, higher sensitivity radio map.
3.6 J22282857
This pair has very similar spectra but does display some significant differences in the Ly-/NV and CIV lines. This could be a lensed system if we are prepared to accept the possibility of time variations in emission-line strength and/or QSO intrinsic absorption features (see section 4).
3.7 J22352717
Although the redshift difference for this pair is consistent with being zero, the QSOs do have significantly different emission-line ratios, and we believe this pair is rather unlikely to be a lensed system.
3.8 J22103204
This pair exhibits significant differences in line strength between the two spectra and is also unlikely to be a lensed QSO.
3.9 J22033133
This pair has quite different continuum shapes and a large redshift difference and is unlikely to be a lensed QSO.
3.10 J22503105
This pair has very similar spectra, but there does appear to be a continuum difference between the ultraviolet parts of the spectra and a significant redshift difference. We consider this unlikely to be a lensed pair.
3.11 J23292957
This pair exhibits significant differences in emission line equivalent widths and ratios and a significant redshift difference, making it also unlikely to be a lensed QSO.
4 Time delay and the formation of broad absorption features
At least two of the pairs have spectra which match very well their redshifts, continuum slopes, emission-line equivalent widths and profiles but which do nonetheless show some significant differences between the two QSOs. One, J01502921, has spectra which appear identical apart from the existence of CIV broad absorption in one QSO and not the other. Such an observation has previously been used to argue against QSO pairs being lensed versions of the same object (Green et al., 2002) but the recent discovery that broad absorption lines can form on timescales of ten years (Ma, 2002) changes that conclusion.
In fact, large separation lenses could have a significant time delay between the lensed images. The actual time delay is strongly dependent on the lens mass distribution and on the symmetry of the light paths through the lens potential. As we have so far detected a possible lens in no more than one of these systems, and as the mass distributions in any lenses are unknown, we cannot yet calculate a predicted time delay. But in principle we should expect a delay which could be as large as the time delay calculated from the maximum possible path length difference in a simple geometry (and ignoring the time dilation term)
where is the angular separation of the images, is the observer-QSO angular diameter distance and is the observer-lens angular diameter distance, assuming a flat universe. For an angular separation of this corresponds to approximately 5000 years. The closeness of the match of the spectra of J01502921 indicates that in fact the broad absorption features have indeed formed in one QSO within this timescale. The available time is certainly much greater than the 10 years formation time observed by Ma (2002). One explanation for such rapid formation of absorption features is the ejection of remnant material from solar-mass objects being destroyed in the vicinity of the black hole. As the crossing time of the broad-line region of such material is of order 10 years this seems a feasible explanation. An alternative explanation for both the difference in our spectra and also the variability seen by Ma (2002) might be that the size of a broad-absorption line gas cloud is only of order of the distance of the cloud from the central source of ultraviolet radiation.
If this conclusion is correct, it also reopens the possibility that the pair, Q2345007, is a lensed QSO and not a binary QSO. Green et al. (2002) have noted that the X-ray properties differ, but also note that one QSO shows a broad absorption line system. If the difference in X-ray properties is caused by X-ray absorption associated with the optical broad absorption line feature, as suggested by Green et al. (2002), then formation of an absorption system on a timescale of order 5 years could explain the observed results.
Two other QSO pairs exhibit some differences in their broad emission lines, and again it is possible that these also arise from long-timescale spectral variability. Small et al. (1997) have studied spectral variability specifically with this question in mind, and find that emission-line variations of this magnitude are common on timescales of a few years.
Time variation may have the unwanted effect of causing the sample to be incomplete, if colours or spectral features vary significantly so that either candidates are not initially selected, or if they are subsequently rejected in a spectral comparison. Given the potentially long time-delays between light paths in systems of such wide separation, it is difficult to allow for this effect as no measurements of variability in unlensed systems can be made on those timescales. In the long term the best approach would be to select candidates on the basis of observables that should be time-independent, such as redshift difference between multiple images, and to apply independent tests of the lensing hypothesis such as the Ly- forest comparison discussed above or looking for characteristic features of lensing such as giant arcs associated with a QSO’s host galaxy. In this paper we do not address this question further, preferring instead to view this paper as providing evidence for the existence of extreme systems which may then be used as evidence to justify more complete surveys.
| QSO | |||||
|---|---|---|---|---|---|
| J143508000844 | 21.37 | 20.72 | 20.57 | 20.64 | 20.37 |
| 0.09 | 0.03 | 0.03 | 0.05 | 0.13 | |
| J143506000901 | 20.49 | 19.92 | 19.87 | 19.98 | 19.74 |
| 0.05 | 0.02 | 0.02 | 0.03 | 0.08 | |
| m | 0.88 | 0.80 | 0.70 | 0.66 | 0.63 |
| 0.10 | 0.04 | 0.04 | 0.06 | 0.15 |
5 Identification of the lenses
If these systems of paired QSOs are indeed lensed QSOs, then the lenses should be identifiable as clusters of galaxies. As described in section 2, one of the possible lensed systems, J, appears associated with a galaxy cluster at . Ten galaxies in the vicinity have redshifts, measured by the 2dF Galaxy Redshift Survey, that are close to this value, with a velocity dispersion of about 600 km sec-1 (Fig. 3). Such a velocity dispersion would however produce an image splitting of only about for an isothermal sphere lens, so if this cluster is the lens then either an anisotropic or a more centrally concentrated mass distribution is needed. The total mass required to produce the observed image splitting is M☉. There is also a weak ROSAT-detected X-ray source close to the position of the two bright galaxies which lie along the line joining the two QSOs, although the origin of the emission is not known. At present it is not clear if sufficient mass is present in this cluster to produce the observed image splitting. One other system, J01502921, may also have a low-redshift cluster associated with it, again based on redshift measurements from the 2dF Galaxy Redshift Survey, although in this case only three redshifts are currently known (Fig. 3).
In order to estimate the expected distribution of lens redshifts we consider the calculations presented by Lopes & Miller (2003) in which the lensing clusters are assumed to have spherically-symmetric Navarro, Frenk & White (1997) mass profiles, and to have an abundance predicted by the Sheth & Tormen (1999) evolving mass function. Here we assume a cold dark matter power spectrum (Bardeen et al., 1986) modified to include an approximate correction for baryons (Sugiyama, 1995) in a CDM cosmology with and and a power-spectrum normalisation given by . In this model, it is found that the distribution of lens redshifts is not sensitive to the choice of cosmological parameters, although the abundance of lensing systems is. Magnification bias is calculated as discussed by Lopes & Miller (2003).
Within this model, it is clear that a lensing cluster is expect to have , and for the widest separations the model predicts that any lens should have . However, the total probability predicted for lensed systems is so low that such systems are expected only if there are significant departures from the assumptions of the model, in which case the lens redshift distribution would need to be recalculated.

6 Comparison with models
At this stage it cannot be regarded as conclusive that these candidate systems are indeed lensed, and we also do not yet have an accurate assessment of the completeness of the lensing search. Nonetheless it is interesting to compare the results presented here with the expectations of lensing models. Li & Ostriker (2002) and Lopes & Miller (2003) have calculated the expected distribution of angular separations arising from strong lensing by massive clusters of galaxies in the standard cosmological framework that assumes structure grows hierarchically from initial Gaussian perturbations in a universe dominated by cold dark matter and dark energy. With cosmological parameters as determined from the WMAP observations (Spergel et al., 2003) the expected number of systems with in the 2QZ survey of QSOs is about 0.5 (Lopes & Miller, 2003), so it is possible, although not highly likely, that the 2QZ survey contains wide-separation lensed systems. However, the distribution is expected to be dominated by angular separations towards the lower end of the range, and in this standard model the expected number of systems with is only (Lopes & Miller, 2003). One possible explanation is that the widest-separation systems presented here are not in fact lensed, despite the similarity of the redshifts and spectra. A second is that the values of cosmological and cluster model parameters are not as assumed in calculating the above numbers: key parameters are , , and also parameters of the model such as the dependence of cluster halo concentration on mass, redshift and cosmology and the cosmic scatter in halo concentration (for details see Lopes & Miller 2003). Or it may be that the models do not yet comprise the full complexity required to model accurately the statistics: possible deficiencies include the assumption of the Navarro, Frenk & White (1997) mass profile (see also Oguri et al. 2003) and the assumption of a smooth distribution of mass. Other departures from the standard cosmological model, such as the existence of non-Gaussian fluctuations, could also modify the lensing probabilities.
For these reasons we believe it is imperative to test carry out observational tests of the candidate lensed systems presented here in order to test these models, rather than using the predictions of the models to argue against the interpretation of these systems as being lensed.
7 Comparison with previous observations
Previous searches have been undertaken for lensed QSOs with comparable separations, and it is interesting to investigate whether the detection of any systems in 2QZ would be inconsistent with those searches.
Ofek et al. (2001, 2002) searched a sample of size radio-loud QSOs without finding any evidence for multiple images in the separation range . Phillips et al. (2001b) examined a complete sample of 11,670 flat-spectrum radio sources for possible multiple images separated in angle by and found no lensed systems. An incomplete sample of radio sources yielded one possible lensed system. The first step in comparing these results with those from the 2QZ survey is to compare sample selection.
The range of angular separations probed by the radio surveys is generally smaller than considered here, although had any 2QZ pairs with been lens candidates they should have been identified as such. For comparison purposes we shall use the cluster-lensing model to compare surveys covering different ranges in separation, although we have argued above that the overall lensing probabilities predicted by such models may be too low to explain the existence of more than one lensed system in the 2QZ survey. The model of Lopes & Miller (2003) with parameters , , and predicts relative lensing probabilities of , and for the separation ranges , and respectively, assuming the same magnification bias in each case. If the models are indeed deficient in some way, or if the values of parameters are different from that assumed, these relative probabilities will be different, but they suffice for the discussion in this section.
In fact, because of the double radio and optical selection of the FIRST survey (Ofek et al., 2001) the magnification bias could be a factor 5 smaller for that survey compared with the JVAS/CLASS or 2QZ surveys (Ofek et al. 2002; Phillips et al. 2001b; Lopes & Miller 2003), so the overall expected relative lensing probabilities in the three surveys are , and for FIRST, JVAS/CLASS and 2QZ respectively.
We also need to make some assumption about sample completeness and to multiply the probabilities by the sample sizes. Here we shall adopt a conservative view of the JVAS/CLASS result and say that out of 15,000 QSOs no lensed systems were found, and we adopt an assumed completeness of 50% for the 2QZ survey. At this stage this figure is illustrative only. With these assumptions, the predicted relative numbers of systems in each survey are 0.1, 1.6 and 1.0 for the FIRST, JVAS/CLASS and 2QZ surveys respectively.
Now suppose the entire dataset contains one lensed system: the a posteriori probability of that system being found in the 2QZ survey is 37%. However, if there are more systems in the 2QZ survey, the probability of there being none in the other surveys falls to 13, 5, 2 % for 2, 3 or 4 2QZ systems. Thus, if the surveys are indeed comparable in this way, the existence of two lensed systems within the 2QZ survey would not be inconsistent with the other surveys, but a larger number could be.
Finally, however, we note that another possibly significant factor in calculating the expected lensing probabilities is the redshift distribution of the source population. Wambsganss et al. (2003), Oguri et al. (2003) and Lopes & Miller (2003) have demonstrated that cluster lensing probability strongly increases with the mean redshift of the source population, and also depends to some extent on the distribution of source redshifts about the mean. The redshift distribution is not well-known for the CLASS and FIRST surveys, but appears likely to have a median value in the range (Ofek et al. 2002; Phillips et al. 2001a, b). The 2QZ median redshift is 1.5. Lensing probability increases by a factor about 3 as the source redshift is increased from to (Lopes & Miller, 2003), so if the typical redshift of sources in the radio surveys is even slightly lower than that of QSOs in the 2QZ survey this would also lower the relative probability of discovering lensed systems in the radio surveys.
Our overall conclusion from this comparison is that, observationally, the results from the 2QZ and radio surveys may not be incompatible, but clearly further work needs to be done both to establish more accurately the redshift distribution of the JVAS/CLASS sources and to establish the reality of the 2QZ candidate systems.
8 Conclusions
Evidence has been presented for the discovery of the first lensed QSOs with multiple images separated on arcminute scales. If these are genuine lensed systems then we should expect the associated lenses to be observable as massive clusters of galaxies. Further evidence needs to be collected to establish that these are indeed lensed, however. One such piece of evidence that is independent of assumptions of the nature of the lens would be the existence of common Ly- forest absorption in candidate lensed QSO spectra. The existence of giant arcs associated with a system would also provide strong evidence for cluster lensing, especially if the host galaxies of the QSOs could be detected and shown to be distorted by lensing. Detection of the lens itself, either by direct imaging or weak-lensing, would also provide convincing evidence.
Consideration of the expected distribution of angular separations indicates that, although a number of the identified systems may be lensed, a number of those with the greatest separations may not be. Confirmation or discounting of the widest separated systems is particularly important as any such systems would challenge our current understanding of lensing by galaxy clusters.
Among the examples found, one candidate lensed system has been found to display broad CIV absorption in one image and not the other, which could be due to the formation of such absorption systems on timescales of tens of years. Further searches for wide-separation lenses may be partially incomplete because such absorption systems would affect optical colours, spectra and the flux in other wavebands, including possibly the X-ray band. Broad-line region variability may also render search methods based on colour and/or spectroscopic comparison partially incomplete unless generous selection criteria are allowed. Finally, it may be that optical searches are biased against lenses with separations less than a few tens of arcsec because of obscuration in galaxies associated with the cluster lens.
ACKNOWLEDGMENTS
The 2dF QSO Survey was based on observations made with the U.K. Schmidt and Anglo-Australian Telescopes. We thank all the present and former staff of the Anglo-Australian Observatory for their work in building and operating the 2dF facility. Follow-up spectroscopic observations were carried out at the Anglo-Australian Telescope and at the William Herschel Telescope. The William Herschel Telescope is operated on the island of La Palma by the Isaac Newton Group in the Spanish Observatorio del Roque de los Muchachos of the Instituto de Astrofisica de Canarias. We acknowledge the use of the Sloan Digital Sky Survey archive for the photometry presented in Table 3. We are also grateful to the 2dF Galaxy Redshift Survey team for providing redshifts of galaxies in the fields shown here, in advance of publication, and would like to thank Raylee Stathakis for useful discussions and Aidan Crook for assistance with observing preparation. AML acknowledges the support of the Portuguese Fundação para a Ciência e a Tecnologia.
References
- Bardeen et al. (1986) Bardeen, J.M., Bond, J.R., Kaiser, N. & Szalay, A.S. ApJ 304, 15 (1986).
- Colless et al. (2003) Colless, M. et al., astro-ph/0306581 (2003).
- Condon et al. (1998) Condon J.J., Cotton W.D., Greisen E.W., Yin Q.F., Perley R.A., Taylor G.B. & Broderick J.J. A.J. 115, 1693 (1998).
- Croom et al. (2001a) Croom S.M., Smith R.J., Boyle B.J., Shanks T., Loaring N.S., Miller L. & Lewis I.J. MNRAS 322, L29 (2001a).
- Croom et al. (2001b) Croom S.M., Shanks T., Boyle B.J., Smith R.J., Miller L., Loaring N.S. & Hoyle F. MNRAS 325, 483 (2001b).
- D’Odorico et al. (1998) D’Odorico V., Cristiani S., D’Odorico S., Fontana A., Giallongo E. & Shaver P., A. & A. 339, 678 (1998).
- Green et al. (2002) Green P.J., Kochanek C., Siemiginowska A., Kim D-W., Markevitch M., Silverman J., Dosaj A., Jannuzi B.T. & Smith C. ApJ 571, 721 (2002).
- Kochanek et al. (1999) Kochanek C.S., Falco E.E. & Muñoz J.A., ApJ 510, 590 (1999).
- Kochanek et al. (2002) Kochanek, C.S., Falco, E.E., Impey, C., Lehar, J., McLeod, B. & Rix H.-W. CASTLES web site: http://cfa-www.harvard.edu/castles (2002).
- Kneib et al. (1996) Kneib, J.-P., Ellis, R.S., Smail, I., Couch, W.J., Sharples, R.M., ApJ 471, 643 (1996).
- Li & Ostriker (2002) Li, L.-X. & Ostriker, J.P., ApJ 566, 652 (2002).
- Lopes & Miller (2003) Lopes, A.M. & Miller, L., astro-ph/0306174 (2003).
- Ma (2002) Ma, Feng, MNRAS 335, L99 (2002).
- Maoz & Rix (1993) Maoz D. & Rix H.W., ApJ, 416, 425 (1993).
- Maoz et al. (1997) Maoz D., Rix H.W., Gal-Yam, A., Gould, A., ApJ, 486, 75 (1997).
- Mitchell (1989) Mitchell P.S., Ph.D thesis, University of Edinburgh (1989).
- Navarro, Frenk & White (1997) Navarro, J.F., Frenk, C.S. & White, S.D.M., ApJ 490, 493 (1997).
- Ofek et al. (2001) Ofek E.O., Maoz D., Prada F., Kolatt T. & Rix H-W., MNRAS 324, 463 (2001).
- Ofek et al. (2002) Ofek E.O., Rix H-W., Maoz D. & Prada F., MNRAS 337, 1163 (2002).
- Oguri et al. (2003) Oguri, M., Lee, J. & Suto, Y., astro-ph/0306102 (2003).
- Phillips et al. (2001a) Phillips P.M., Browne I.W.A. & Wilkinson P.N., MNRAS 321, 187 (2001).
- Phillips et al. (2001b) Phillips P.M., Browne I.W.A., Jackson N.J., Wilkinson P.N., Mao S., Rusin D., Marlow D.R., Snellen I. & Neeser M., MNRAS 328, 1001 (2001).
- Sahu et al. (1998) Sahu K.C., Shaw, R.A., Kaiser, M.E., Baum, S.A., Ferguson, H.C., Hayes, J.J.E., Gull, T.R., Hill, R.J., Hutchings, J.B., Kimble, R.A., Plait, P. & Woodgate, B.E., ApJ 492, L125 (1998).
- Sheth & Tormen (1999) Sheth, R.K. & Tormen, G. MNRAS 308, 119 (1999).
- Smail et al. (1995) Smail, I., Couch, W.J., Ellis, R.S. & Sharples, R.M., Ap.J. 440, 501 (1995).
- Small et al. (1997) Small T.A., Sargent W.L.W. & Steidel C.C., A.J. 114, 2254 (1997).
- Smith et al. (2002) Smith R.J., Croom S.M., Boyle B.J., Shanks T., Miller L. & Loaring N.S., submitted to MNRAS (2002).
- Spergel et al. (2003) Spergel, D.N., Verde, L., Peiris, H.V., Komatsu, E., Nolta, M.R., Bennett, C.L., Halpern, M., Hinshaw, G., Jarosik, N., Kogut, A., Limon, M., Meyer, S.S., Page, L., Tucker, G.S., Weiland, J.L., Wollack, E. & Wright, E.L., ApJ Supplement Series 148, 175 (2003).
- Stoughton et al. (2002) Stoughton C. et al., A.J. 123, 485 (2002).
- Sugiyama (1995) Sugiyama, N. ApJ Supplement 100, 281 (1995).
- Wambsganss et al. (2003) Wambsganss, J., Bode, P. & Ostriker, J.P., astro-ph/0306088 (2003).
- Zhao et al. (2002) Zhao, D., Jing, Y.P. & Börner, G., ApJ 581, 876 (2002).