Topic maps for custom viewing of data
Abstract
A Topic Map is a structured network of hyperlinks that points into an information pool. Topic Maps have an existence independent of the information pool and hence different Topic Maps can form different layers above the same information pool and provide us with different views of it. We explore the use of Topic Maps with the Unified Column Descriptor (UCD) scheme developed in the frame of the ESO-CDS data mining project. UCD, with its multi-tier hierarchical structure, categorizes parameters reported in tables and catalogs. By using Topic Maps we show how columns from different catalogs with similar but not identical descriptions could be combined. A direct application for the Virtual Observatory community is that of merging catalogs in order to generate customized views of data.
Keywords: Virtual Observatory, Topic Map, XML, Large Datasets, Knowledge Organization, Data Discovery, Semantic Nets
1 INTRODUCTION
Over the last couple of years several VO groups have been making steady progress in defining and prototyping various access and interconnectivity tools. It is clear that not only will the VO be internet-based, but also that it will be very XML-heavy. The most important feature of the VO will be to allow access to desired information in a quick and systematic way. All the metadata - handle to the real data - will populate different XML files. XML is highly structured and very readable. However, it does not offer itself to searches trivially. A Topic Map (TM) - an XML file itself - can form a layer of hyperlinks over an information resource and serve as the GPS in a huge database. With TMs one can define complex knowledge structures and attribute them as metadata to information resources allowing one to systematically organize knowledge on a variety of data subjects such that the retrieval and sharing with other users is easy.
As an analogy from everyday life, a Topic Map is like the index at the back of a book. Like an index, a Topic Map presents an array of subjects, along with links to the occurrences of information, which for a book are page numbers. A book index can have entries in italic (indicating, for example, the presence of an image on page so and so), or in bold (the main explanation), and links to other parts of the index (for ‘Active Galaxies’, see ‘Galaxies, Active’). But Topic Maps also provide different kinds of indexes for different purposes, for different users. A TM links all the topics in a given area, letting users find the information they want more transparently by navigating through the concepts of the subject area, rather than having to know the underlying way in which the information has been organized and stored.
Using Topic Maps to interlink datasets goes one step ahead than existing tools and services for two reasons: (1) users will be able to customize Topic Maps to the level that they desire, and (2) new VO services that are developed elsewhere and by other teams will not only be instantly linkable through Topic Maps, but also the Topic Map indexing and querying mechanisms will allow a seamlessly merged appearance of these services allowing for more semantically coherent knowledge discovery.
In this paper we provide an outline of what Topic Maps are and where the Topic Map technology is heading. We then describe the Uniform Column Descriptors (UCDs) and go on to discuss the Topic Map made from the UCDs. We then describe the Topic Map engine we have implemented to allow users to create their own UCD Topic Maps and merge those with the ones we have constructed. Finally we present sketches for more Topic Maps which can be used as VO tools.
2 Topic Maps
Topic Maps started life as a standard for software documentation in 1991 (HyTime Hypertext 1991 conference in San Antonio). However, that was much before the time was ripe for the idea. It was only when XML matured that their potential in information and knowledge organization has been realized. In 1996 Topic Maps became a work item in ISO’s SGML working group resulting in a Topic Map standard published in 1999. This has since then led to different working groups on XTM, TMQL and so on and the progress has been rapid. More history can be found in Pepper(1999).
A Topic Map is a collection of topics linked together by associations between the topics. The topics can occur in different contexts (scopes) and the associations qualify the occurrences. In the map, each node is a named topic. Associations between nodes are expressed by links. A Topic Map thus is a structured network of hyperlinks above an information pool from which the topics are drawn. The named topics can be just about anything thereby allowing a Topic Map to discuss abstract relationships between different topics. Depending on the situation, different terms could be chosen to be regarded as topics. In the following sections we will describe in detail the UCD Topic Map. For a more detailed, general introduction to Topic Maps, please see Mahabal et al.(2001).
The real power of Topic Maps comes from the scoping ability. Scopes can be used to categorize different occurrences of a given topic depending on context. A good way to look at Topic Maps with their scoping ability is the following analogy: When searching for something on the internet search engines, one gets a lot of muck in which the real gems are hidden. If proper keywords are used, and if the search engine does not index everything, the gems float to the top. This is exactly what happens when the scoping mechanism is used for discrimination and for qualifying context. It limits the validity of a topic by categorizing it into one or more themes. Thus scoping allows one to zoom in not only on different topics but also very specific subcategories e.g. a quasar could be scoped to be one with a binary companion, and also one with a redshift exceeding 5. It becomes very useful when, for example, searching for specialized entities like high redshift quasar clusters.
In general, a Topic Map can be looked at in many different ways:
-
•
As a semantic network over an information pool. Though a Topic Map connects (associates) different concepts/subjects (topics) within an information pool, it has an existence distinct from the information pool itself. This network of hyperlinks can be used in its own right as a resource.
-
•
A configurable data interconnections viewer. Besides being a network of hyperlinks, the Topic Map is also capable of rendering itself as a configurable viewer of the data resource it is talking about. This comes about because of the possibility of scoping which allows one to prune the Topic Map for viewing purposes in well defined complex ways.
-
•
Basis for structured querying of XML files. This aspect of Topic Maps can not be overstated. Topic Maps are wonderful for structuring and displaying information. In Sec. 6 we describe Topic Map querying mechanisms.
-
•
A data/knowledge discovery tool. This is the aspect we want to stress here. With the Virtual Observatory wanting to deal with extremely large datasets, we need tools that will help us make sense of the multidimensionality (table-widths) as well as the multi-trillion sizes of individual datasets (table-lengths). And then we would want to combine the datasets meaningfully. What better way than to do that while maintaining the semantic structure? Topic Maps allow for the diverse data to be meaningfully combined.
The mathematical model that can be used for Topic Maps is that of a hypergraph. Topics form the vertices, associations are the edges and occurrences form the incidences. A hypergraph representation consisting of neighborhood of a vertex can be found at Kartoo111http://www.kartoo.com. An alternate representation of a hypergraph, a bipatriate graph, can be seen as part of Mondeca’s topic map software222http://www.mondeca.com. More details can be found in Auillans et al.(2002) and Auillans(2002).
3 Unified Column Descriptors
VO is about data: access to data, pipelines for data, processing of data, interoperability and so on. The data itself is the main component and is in the form of images, spectra, catalogs etc. An important component of all these is the metadata. UCDs are a first step in bringing about uniformity in the catalog metadata - the different column names that authors use. ESO and CDS have worked together to form a 4-tier hierarchical set of standardized column names - called Unified Column Descriptors - to categorize all the different column names that are used in astronomical catalogs. There are 35 main categories including Photometry, Positions, Physical Quantities etc. We have made use of the 1400+ UCDs as our Published Subject Indicator (PSI) list in generating a template for the Topic Map we present here. Should the PSI evolve to a different set of names, regenerating the Topic Map to reflect that is straightforward. More details about UCDs can be accessed at the Vizier website333http://vizier.u-strasbg.fr/doc/UCD.htx, Ortiz et al. (1999) and elsewhere in these proceedings (Genova et al., 2002). Some examples of UCDs are:
-
•
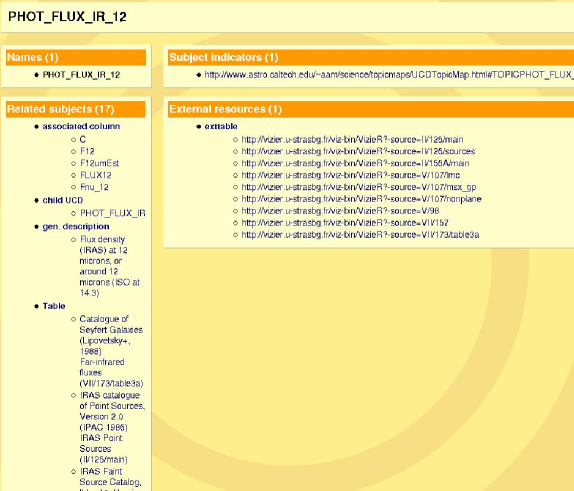
PHOT_FLUX_IR_12: This UCD is used for columns which represent “Flux density (IRAS) at 12 microns, or around 12 microns (ISO at 14.3)”. This pulls together different names that different astronomers have used for this quantity e.g. C, F12, F12umEst, FLUX12, Fnu_12 etc. (see Fig. 3).
-
•
POS_EQ_RA_MAIN: This UCD is used to describe the Right Ascension and combines various names used over years and epochs e.g. RA(ICRS), RA1855, RAB1900, RAB1950, RAhms, RAJ2000 etc.
4 UCD Topic Map
A UCD Topic Map is constructed from the metadata (column names and units) for a set of tables (catalogs). It does not concern itself with the actual data in the catalog. Their sheer number can be overwhelming and that problem can anyway be tackled outside separately. Instead, the UCD Topic Map revolves around Columns, Column Names and Tables. Thus, the main topics include:
-
•
all 1400+ UCD names,
-
•
the corresponding UCD descriptions,
-
•
the column Names from the Tables used in the Topic Map, and
-
•
the Tables themselves (any set of tables can be used to make a Topic Map).
In addition, there are several other topics owing to the hierarchical nature of the UCDs (e.g. the depth of a UCD in the list), units associated with different columns and any number of external links per Table (e.g. a hyperlink to the actual table somewhere on the internet) or even per Column (e.g. a histogram for the column, or quantiles obtained through external CGI programs). It is these external links that provide a great deal of flexibility to the Topic Map.
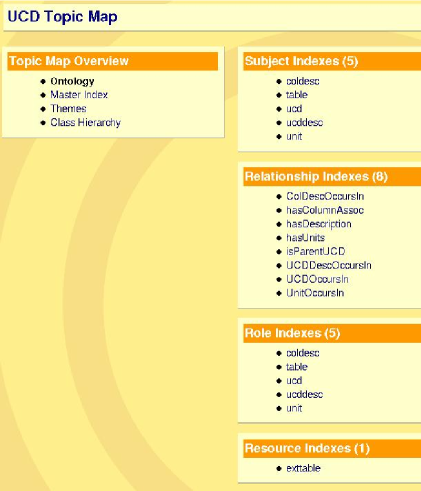
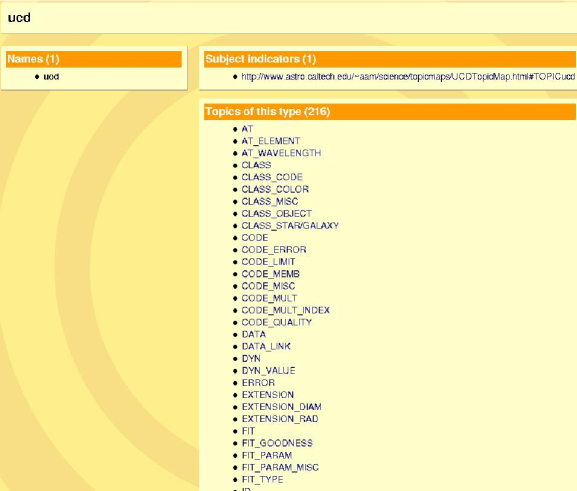
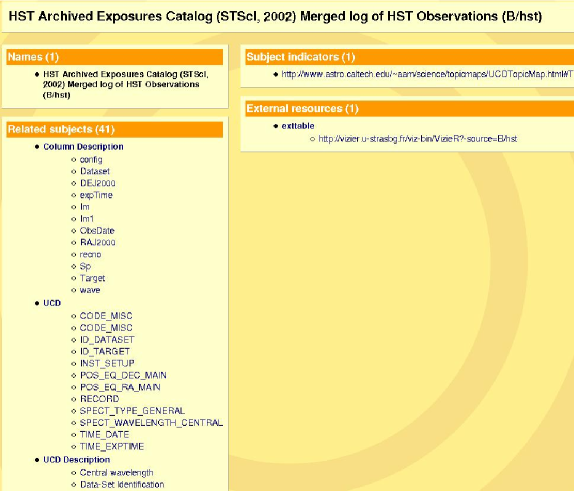
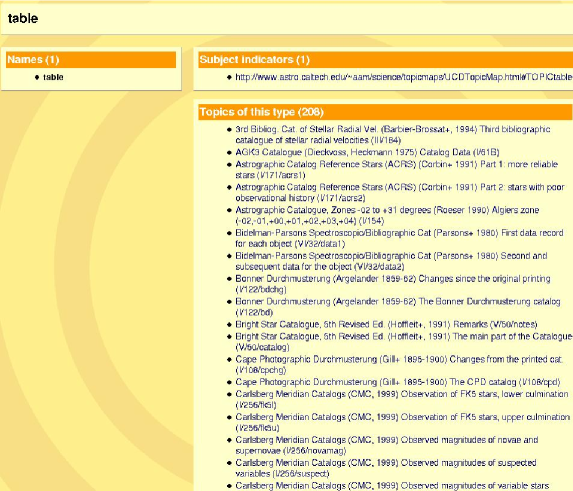
In the following few paragraphs we will be switching between descriptive and visual views of different aspects of Topic Maps. We show in Fig. 1 the top view of the Topic Map as seen in Ontopia’s freely available Omnigator444http://www.ontopia.net. The view shows the different subject indexes (explicitly defined topics), relationship indexes (defined associations), role indexes (the roles played by the topics in the associations) and resource indexes (external resources e.g. links to tables). As indicated before, the Topic Map is a network of links allowing one to jump from a general topic (e.g. UCD) to a particular instance of it (e.g. the UCD PHOT_FLUX_IR_12) to the Table in which this UCD occurs (e.g. the catalog of Seyfert Galaxies). The display with UCD as the central topic is captured in Fig. 2 while Fig. 3 shows a view with PHOT_FLUX_IR_12 being the central topic and Fig. 4 shows an HST related table to be the central topic. Each of these views is rich in semantic information.
 |
For the UCD Topic Map we have defined very basic associationships between the different topics. Some examples are:
-
•
UCD occurs in Table,
-
•
UCD has description Column Description,
-
•
Column (of Table) has units Unit,
-
•
Column occurs in Table,
-
•
UCD is parent of UCD.
 |
Similarly, the occurrences in the UCD Topic Map can be grouped into a small number of sets:
-
•
UCDs occur in Tables,
-
•
Columns occur in Tables,
-
•
Units occur in Tables,
-
•
Tables occur as external links in many places.
 |
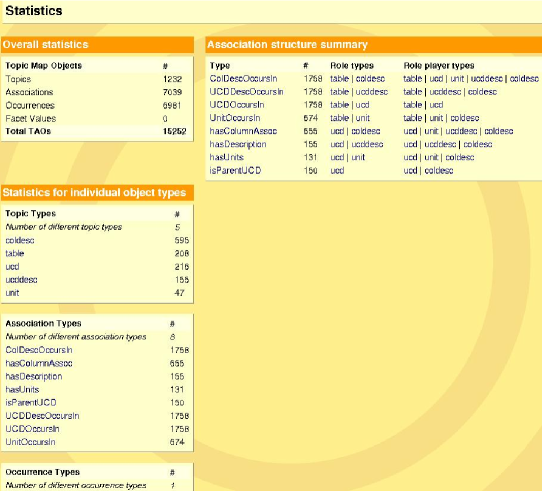
If one is dealing with a single table, one encounters several columns, each column with its corresponding UCD and a few of the columns having units. There are also several tens of associations and occurrences. Together they form a structure which is graspable without any sophisticated arrangements. The HST related view in Fig. 4 is an example. It is when one goes to tens of catalogs that the complexity increases rapidly and a more advanced knowledge organization becomes necessary. In the UCD Topic Map we present here555http://www.astro.caltech.edu/aam/science/topicmaps/ucd.html, we have used the 100 most frequently accessed catalogs at Vizier. A partial list of the catalogs is shown in Fig. 5, and the resulting number of topics, associations etc. are partially sketched in Fig. 6. It is with these large numbers that we can start asking interesting questions. This is where the data/knowledge discovery begins.
 |
 |
 |
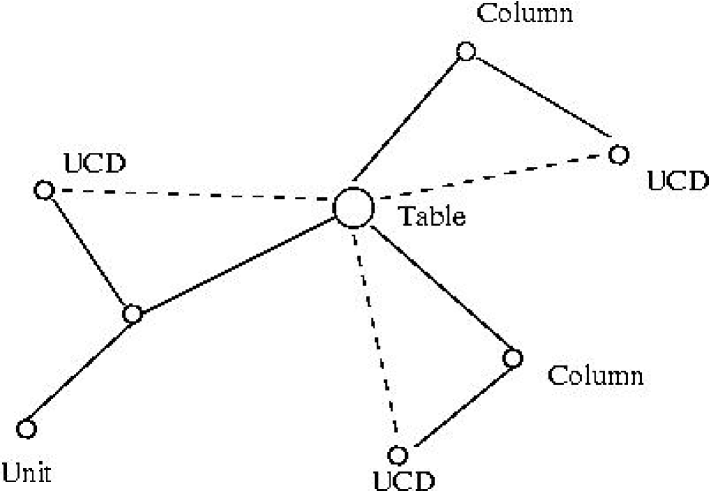
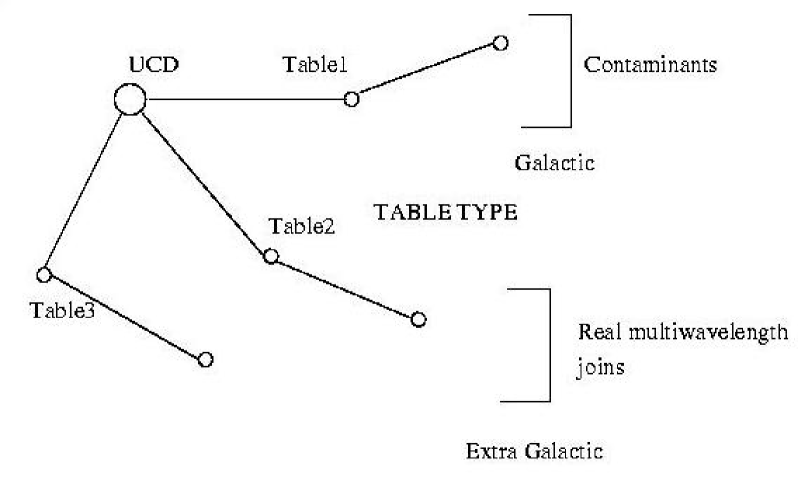
In case of a single table one has the table as the main topic with different columns present in the table forming other topics, as also the UCDs associated with these columns and the Units associated with some of the columns. A schematic of the scenario is presented in Fig. 7. When we move to a multitable UCD Topic Map, and select any UCD as the main topic, we can see all the associated tables (in which the UCD is present). Depending on one’s interest, one can then start asking specific questions. One such scenario is summarized in Fig. 8. Consider an astronomer interested in the infrared part of the electromagnetic spectrum, in particular the 12m flux density. She asks for tables (within the 100 most accessed tables in the UCD TM) that have a column which corresponds to the UCD PHOT_FLUX_IR_12. She is returned a list of such catalogs: Catalog of Seyfert Galaxies, IRAS catalog of Point Sources, the extended m galaxy sample and so on. Each of these takes her to that table allowing her to explore different columns present in those tables (e.g. which area has been covered, how faint they go, which epoch it is, what the resolution is and so on). In addition, the Topic Map author can choose to add different scopes to each of the table to, for instance, convey if the catalog is galactic or extra-galactic. Such information could then be used by the user to determine if the catalogs contain columns on which a meaningful join can be performed. A very VO like example would be: “choose Elliptical galaxies that are strong in radio, fairly bright in infra-red but do not contain an AGN”. By navigating through the appropriate keywords for IR, radio fluxes and catalogs of elliptical galaxies and catalogs of non-agn galaxies such a search could be achieved. Additionally the Galactic catalogs need not all be thrown away. They can be used to check if there exists a population of objects that can act as a contaminant to the population that the user has chosen.
 |
 |
Thus data discovery is all about asking the right questions: Can I merge X-Ray and Radio catalogs? Which ones? Do their units match? What are the parameter ranges? What is the basic statistics for them? How does the histogram for a column look and so on. Some of the possibilities mentioned above can also be carried out using tools available elsewhere (e.g. at CDS). However, segregation of different entities by the scoping mechanism affords Topic Maps a stronger semantics allowing a quicker zooming in on the required data. Another aspect is the ability to merge different Topic Maps. We discuss it in the next section.
5 TOPIC MAP MERGING
Topic Map merging is not the same as merging of columns from different tables to create a database join. Topic Map merging involves identifying identical Topic Map topics in different Topic Maps and merging their associations and occurrences to give rise to a single merged topic. For doing this, a SubjectIdentity tag is used. As a result, one can have two topics with the same name if they have different SubjectIdentity. This is in fact desirable since we often use the same name in different contexts for different entities e.g. satellite could be a general term for the satellite of a planet, or it could be a man-made communications satellite.
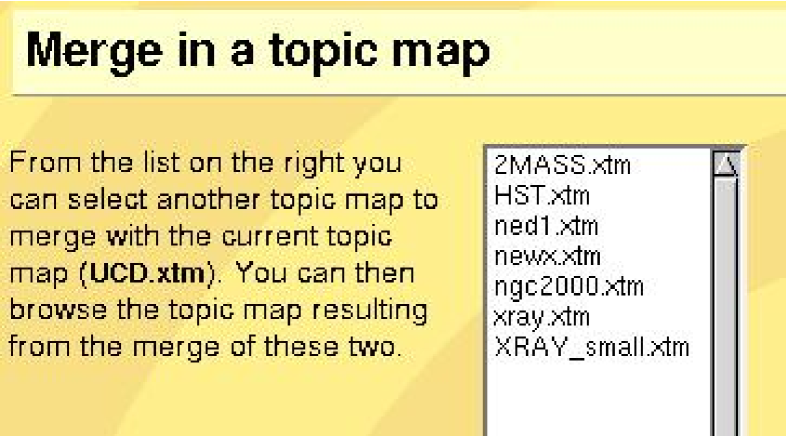
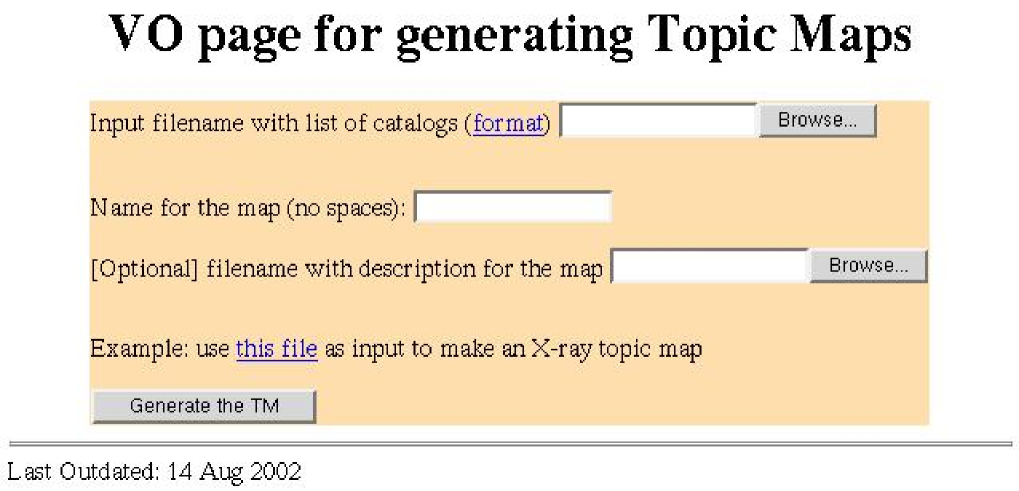
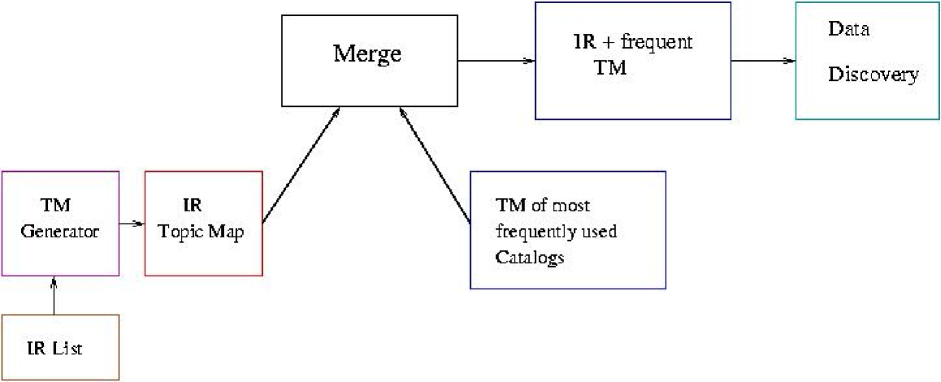
Here we are more interested in topics that can be merged. Continuing to discuss our hypothetical astronomer, now she is equipped with her own dataset of X-Ray observations which she has put in the standard XML format after having identified proper UCDs for the different column names. She would now like to merge the database with the readymade UCD Topic Map (of the 100 most used catalogs) in order to later look for the non-AGN radio ellipticals which are also detected in X-Ray. The Topic Map generator that we have built allows precisely this to be done. It takes as input a list of tables and then generates a Topic Map out of it in exactly the same format as the UCD Topic Map (the new Topic Map is also a UCD Topic Map, though custom built). The topic map then appears as a new entry in the list of Topic Maps available. The merge button available at the top prompts the user to choose which Topic Maps are to be merged (see Fig. 9). Once the user chooses the original UCD Topic Map and the new custom built TM, the merging is done and a new merged topic map is available for exploring. The cgi-bin form through which the topic map generation is carried out is shown in Fig. 10. A flowchart of the merging procedure is shown in Fig. 11. The TM generator can also make a Topic Map from just the list of catalog names in the format Vizier uses. It downloads the catalogs and any sub-catalogs (currently only from Vizier) and forms the Topic Map using the template built into the program.
6 QUERYING AND INDEXING
Lastly we talk about two aspects that make knowledge discovery with Topic Maps even more viable. These are querying and indexing. We mentioned earlier that Topic Maps are XML structures working on other XML structures and that querying XML is not straightforward in the usual way. The ISO community has not formalized a TMQL (Topic Map Query Language) yet. However, many precursors like eTMQL666empolis: http://k42.empolis.co.uk/tmql.html, AsTMa777Bond University, Australia: http://topicmaps.bond.edu.au/astma and Tolog888Ontopia: http://www.ontopia.net exist. We found Tolog easy to use and it comes bundled with Ontopia’s free Omnigator. The syntax used is a combination of an SQL like language and the powerful prolog. The use of prolog’s power allows one to make extensive searches. Examples of some queries are given below.
-
•
query: List all UCDs
code: instance-of($A,ucd)?
meaning: give me all instances that match $A=ucd ($A is a variable). -
•
query: Count number of child UCDs
code: Select $A, count($B) from isParentUCD($A : ucd, $B : ucd)?
meaning: Count all $B such that $A and $B are both UCDs and $B is the child of $A. -
•
query: Order the above in descending order, sorted on count.
code: Select $A, count($B) from isParentUCD($A: ucd, $B: ucd) order by $B desc?
meaning: Select $A such that $A and $B are UCDs, count the number of $Bs and put it in inverse numeric order.
The queries can be executed on individual Topic Maps or on merged Topic Maps. Unlike an SQL query run on a database, all the returned entries are hyperlinks too, allowing the user to jump to any of the results and continue the data discovery trails.
Indexing is the other important aspect. Topic Maps began life with indexing in mind. It is not surprising that it continues to be one of the strengths of this tool. One can create different indexes per Topic Map so that searching is faster. As for queries, searches return hyperlinked documents and also the type of match it found and the confidence level of the match. The hyperlinked searchable multiple indexes make a Topic Map a combination of indexes, thesauri and glossaries.
 |
 |
 |
7 DISCUSSION AND CONCLUSIONS
We have outlined above the construction and use of a UCD Topic Map and how users can create their own UCD Topic Maps and merge them with other UCD Topic Maps. While this can already act as a tool for custom viewing of data and as a knowledge discovery tool, much needs to be accomplished. We will keep adding bells and whistles to the Topic Map page222http://www.astro.caltech.edu/aam/science/topicmaps.
A lot of stress has been placed on the external links. This is because Topic Maps need not reinvent wheels for actions that other services are capable of e.g. Topic Maps facilitate selection of columns for merging. One could then easily use the merging VO service provided by Roy Williams333http://virtualsky.org/conesearch-xmatch.htm to do the actual merging. Similarly, for statistics of columns, one could use the prototype astrostatistics444http://avyakta.caltech.edu:8080/cgi-bin/astrostat3.cgi service. In passing, it must be stressed that Topic Maps are a general knowledge organization tool and many varied Topic Maps can be constructed with the VO in mind. Some example sketches regarding literature searches and observing logs were presented in Mahabal et al.(2001).
We encourage you to explore Topic Maps, generate some of your own, UCD or otherwise. Your comments are most welcome.
ACKNOWLEDGMENTS
This work was supported in part by the NASA AISRP program and the NSF ITR program. Many thanks to Vidyullata Mahabal for help with the figures. Many thanks to Francois Ochsenbein for patiently replying queries about UCDs.
References
- [1] Auillans, P., de Mendez, P. O., Rosenstiehl, P., and Vatant, B., 2002, Proc. International Semantic Web Symposium, 2002 (http://dept-info.labri.u-bordeaux.fr/ auillans/publis/formal.ps)
- [2] Auillans, P., 2002, Proc. 6th International Conference on Information Visualisation IV02
- [3] Genova, F., 2002, Proc. SPIE v. 4846 (these proceedings)
- [4] Mahabal, A. A., Djorgovski, S. G., Williams, R. E., and Brunner, R., 2001, Proc SPIE v. 4477, p. 161
- [5] Ortiz, P. et al., 1999, Proc. ADASS v. 172, p. 379
- [6] Pepper, S., 1999, http://www.ontopia.net/topicmaps/materials/mlangart.pdf