The Spectroscopic Variability of GRB 02100411affiliation: Based on data from the MMTO 6.5m telescope, the FLWO 1.5m telescope, and the Magellan 6.5m Baade telescope.
Abstract
We present spectra of the optical transient (OT) associated with GRB 021004. The spectra show a blue continuum with superposed absorption features and one emission line. We confirm two intervening metal-line systems at and and one very strong absorption system at a redshift of . Ly emission is also seen at this redshift. While the spectrum of the OT overall cannot be simply described with a power law, the spectral index over the range Å is steep, . Comparison of spectra from multiple epochs shows a distinct color evolution with the OT becoming redder with time over the first three days. This is the first clear example of color change in an OT detected spectroscopically.
1 Introduction
The recent rapid progress in the study of gamma-ray bursts (GRBs; Klebesadel, Strong, & Olson 1973) has been heralded by the swift localization and follow-up of their afterglows at longer wavelengths (e.g., Piro et al. 1996; Groot et al. 1997; Frail et al. 1997). Optical spectroscopy of the afterglow of GRB 970508 (Bond 1997) led to the first redshift determination of a GRB, with (Metzger et al. 1997), settling the controversy regarding the distance scale for these objects.
Over the last few years, optical spectroscopy of GRB afterglows has become relatively common, and the focus of study has shifted beyond simply constraining GRB redshifts. The afterglow spectra provide a means to study the local environment of GRBs and connections to their origins, for example, within massive star populations or star-forming regions (Vreeswijk et al. 2001; Castro et al. 2002; Mirabal et al. 2002b), as well as to study host-galaxy properties such as the extinction law (e.g., Jha et al. 2001) and intervening material along the line of sight. In addition, spectropolarimetry (Barth et al. 2002) has the potential to reveal much about the nature of GRBs and their environments.
Combined with afterglow photometry, optical spectroscopy at later times has provided tantalizing hints of a connection between GRBs and core-collapse supernovae (e.g., for GRB 011121/SN 2001ke; Garnavich et al. 2002). Furthermore, spectroscopy of GRB host galaxies (after the afterglow has faded) also yields valuable data bearing on the question of the origin of GRBs (e.g., Bloom, Djorgovski, & Kulkarni 2001). Nonetheless, early-time spectroscopic observations of GRB afterglows (when they are still bright and easier to study!) provide a unique back-lit view of the GRB environment and its host galaxy.
Here we report spectroscopic observations of GRB 021004. GRB 021004 was detected by the FREGATE, WXM, SXC instruments aboard HETE II at 12:06:13.57 UT on 2002 October 4 (Shirasaki et al. 2002). Fox et al. (2002a) reported their discovery of a bright, fading optical transient (OT) within the small SXC error circle located at = , = (J2000.0), and identified this as the GRB optical afterglow. Fox et al. (2002b) were the first to report on optical spectroscopy of the afterglow, constraining the GRB redshift to based on the detection of two absorption-line systems. Additional reports of spectroscopy noted unidentified absorption lines (Eracleous et al. 2002; Sahu et al. 2002; Castander et al. 2002), with the puzzle solved by Chornock & Filippenko (2002) who identified absorption and emission lines at in their Keck Observatory spectroscopy of the afterglow. The coincidence of the redshifted wavelength of Ly at and C IV 1448, 1551 at as well as the relatively weak Ly forest led to our initial mistaken claim that (Castander et al. 2002). In addition, several of the strong absorption lines consist of multiple components (Salamanca et al. 2002; Mirabal et al. 2002a; Savaglio et al. 2002), some with a large velocity separation interpreted as evidence for a supernova (Salamanca et al. 2002) or high-velocity mass loss from a Wolf-Rayet star (Mirabal et al. 2002a).
2 Observations
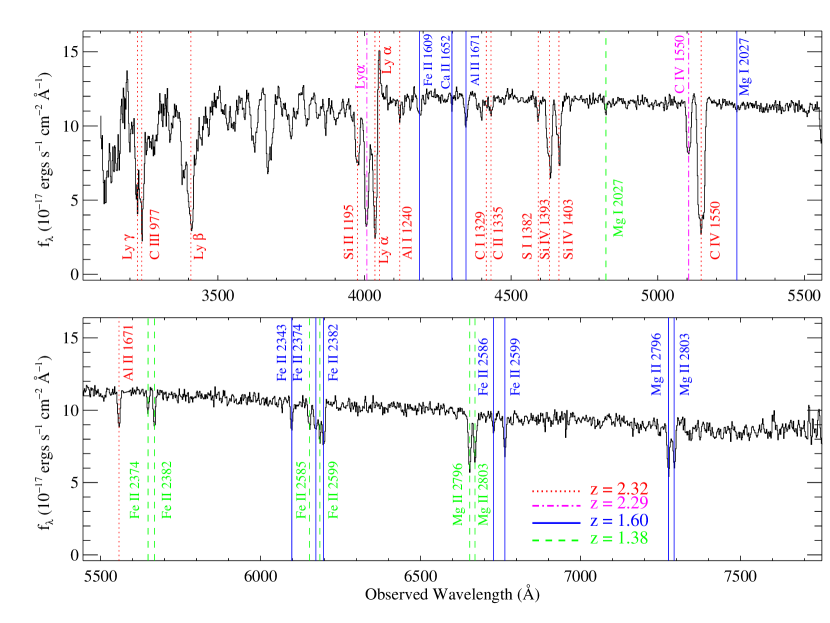
Spectra of the optical transient (OT) associated with GRB 021004 were obtained over several nights with the 6.5m MMT telescope, the 1.5m Tillinghast telescope at the F. L. Whipple Observatory (FLWO), and the Magellan 6.5m Baade telescope. The spectrographs used were the Blue Channel (Schmidt et al. 1989) at the MMT, FAST (Fabricant et al. 1998) at FLWO, and LDSS2 (Mulchaey 2001) at Magellan (see Table 1 for observational details). The observations were reduced in the standard manner with IRAF111IRAF is distributed by the National Optical Astronomy Observatories, which are operated by the Association of Universities for Research in Astronomy, Inc., under cooperative agreement with the National Science Foundation. and our own routines. Spectra were optimally extracted (Horne 1986). Wavelength calibration was accomplished with HeNeAr lamps taken immediately after each OT exposure. Small-scale adjustments derived from night-sky lines in the OT frames were also applied. Spectrophotometric standards are listed in Table 1. We attempted to remove telluric lines using the well-exposed continua of the spectrophotometric standards (Wade & Horne 1988; Matheson et al. 2001). The spectra were, in general, taken at or near the parallactic angle (Filippenko 1982). The relative fluxes are thus accurate to 5% over the entire wavelength range. Figure 1 shows a signal-to-noise ratio weighted average our spectra. The initial report on these data was presented by Castander et al. (2002).
3 Results
The spectrum of the OT of GRB 021004 (Figure 1) consists of a blue continuum typical for GRBs. There are several absorption features identifiable as two intervening metal-line systems at redshifts of and (first reported by Fox et al. 2002b) and one set of lines at a redshift of , apparently intrinsic to the host galaxy of the GRB (first noted by Chornock & Filippenko 2002). The three systems are marked on the spectrum in Figure 1 and equivalent widths are reported in Table 2.
The two lower-redshift Mg II systems are fairly typical (e.g., Steidel & Sargent 1992). The system at has lines with large equivalent widths, as well as distinct absorption and emission from Ly, indicating that it most likely represents the host galaxy of the GRB. Our low spectral resolution precludes identification of all separate components of the lines noted above. There are strong blueshifted lines apparent for C IV 1548, 1551 at a rest-frame velocity of km s-1 and Ly at a rest-frame velocity of km s-1, although C IV 1548, 1551 at most likely contaminates the Ly absorption, which may explain the discrepancy between the two velocities.
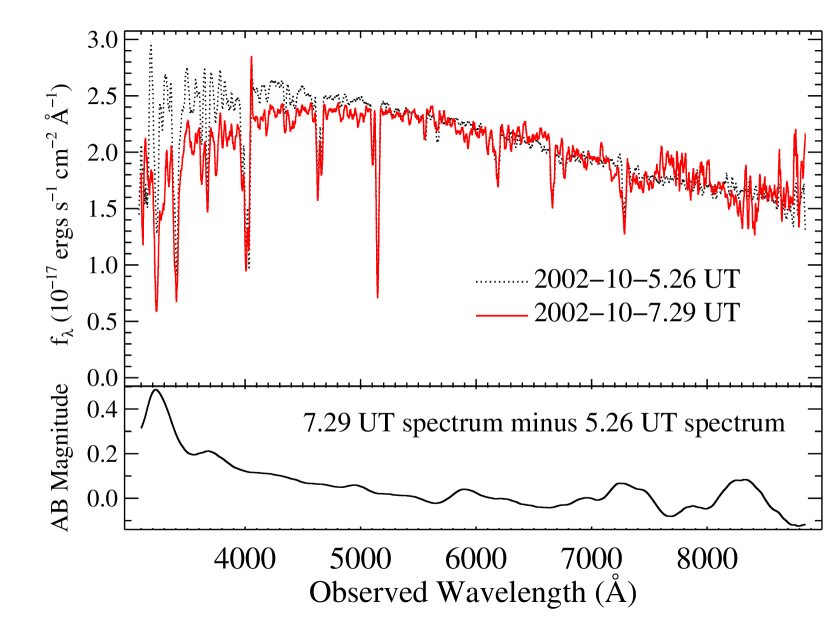
The brightness of the OT and its relatively slow rate of decline (Winn et al. 2002; Bersier et al. 2002a; Stanek et al. 2002) allowed us to observe it over three days with the MMT, thus providing an opportunity to look for spectroscopic evolution. There was no clear change in absorption line structure or strength from Oct 5.12 UT to Oct 7.30 UT. There was, however, a change in continuum shape, illustrated in Figure 2. The comparison is made between the average of the last two spectra from the MMT on Oct 5 (Oct 5.24 and Oct 5.27) and the average of the two spectra from the MMT on Oct 7 (Oct 7.28 and Oct 7.30). The spectra were normalized to match continua between 5000 and 7000Å. There is a distinct change in the continuum, with the Oct 7 spectrum being fainter at the blue end. The bottom panel of Figure 2 shows the (heavily smoothed) difference between Oct 5.26 UT and Oct 7.29 UT in AB (monochromatic) magnitudes (Oke & Gunn 1983). Features that remain in this color curve are chiefly due to night-sky contamination of the spectrum; they imply a conservative estimate of the error of 0.1 mag. The color curve suggests that there should be little change in , but that or should increase. Our simultaneous photometry (Bersier et al. 2002b) indicates that a change in color of mag does occur over this time period. We also have spectra from Oct 6 UT, the intervening night. The average of the two spectra from that night, Oct 6.27 UT and Oct 6.34 UT, does fall in between the spectra from Oct 5 and Oct 7. We chose, however, not to include it on Figure 2 for the sake of clarity.
Color changes in an OT have been observed before (e.g., Galama et al. 1998) using broad-band photometry. While spectroscopic evidence is more difficult to obtain, the additional information about how the color is changing at every wavelength provides a stronger constraint for models of the afterglow.
The spectral index also indicates spectroscopic variation over the three-day period of observation. Assuming a Galactic color excess of (Schlegel, Finkbeiner, & Davis 1998), we dereddened the spectra using the extinction correction of Cardelli, Clayton, & Mathis (1989), with the O’Donnell (1994) modifications at blue wavelengths. Least-squares minimization for a power law () over the full wavelength range (Å) yields an index of (statistical error only) for Oct 5 UT, but there is clearly curvature present in the spectrum. Fitting only in the range gives an index of . By Oct 7 UT, the power-law index for the full range of the spectrum is , but only for , fully consistent with the value from the first night. This again shows that the spectroscopic variation is real, but confined to the blue wavelengths.
Slight differences at the blue end of an optical spectrum can easily be caused by atmospheric dispersion unless the spectrograph slit is oriented at the parallactic angle (Filippenko 1982). All of our observations with the MMT presented here were taken at or near the parallactic angle, as were the exposures of the standard stars used to calibrate the data. Moreover, the spectra used to calculate the color difference shown in Figure 2 were all taken at an airmass of less than 1.07, implying that the effects of atmospheric dispersion were negligible. As mentioned in Table 1, there is second-order light contaminating the red end of the MMT spectra. Given that both the spectra from FLWO (that are not affected by second-order light) and approximately simultaneous photometry (Bersier et al. 2002b) agree with the shape of the MMT spectra, we believe that we have minimized the effects of the second-order contamination.
The deviation from a simple power law evident in the first spectrum from Oct 5 UT may be intrinsic to the OT or possibly the result of extinction in the host galaxy. There are strong absorption features due to the host, so there is clearly a considerable amount of intervening material at the host redshift. The fact that the spectrum changes over the three days of our observations, though, shows that there is more than just extinction at work. If GRBs do destroy dust along the line of sight (Fruchter, Krolik, & Rhoads 2001; Draine & Hao 2002; Perna & Lazzati 2002), the decrease in blue flux we see would not be the signature. Several of the unidentified features in the spectrum, especially blueward of Ly, could be the result of the H2 absorption as described by Draine & Hao (2002), but they are more likely the result of absorption by Ly clouds. One possible explanation for the reddening of the spectrum would be the formation of dust. Rhoads, Burud, & Fruchter (2002) reported that the OT decreased in brightness in the band (compared to the optical photometry of Stanek et al. 2002) over the same time period as our spectrum shows a decrease at blue optical wavelengths. This suggests that dust formation is unlikely.
The increase in color seen in our data, along with the decrease in color described by Rhoads et al. (2002), supports the suggestion of Rhoads et al. that this could be a cooling break affecting longer optical wavelengths. If this scenario is correct, our data would be most useful for constraining the shape of the spectral break in the afterglow (Granot & Sari 2002).
The nature of GRBs remains a powerful enigma. Optical spectroscopy has played a critical role in establishing that GRBs are at cosmological distances (e.g., Metzger et al. 1997), and it has begun to illuminate other characteristics. The color change that we see represents the first conclusive evidence for variability over time in spectroscopy.
The MMT spectra described in this paper are available for analysis by other researchers via anonymous ftp at ftp://cfa-ftp.harvard.edu/pub/kstanek/GRB021004_spec/.
References
- (1) Barth, A. J., Cohen, M. H., Goodrich, R. W., Price, P. A., Bloom, J. S., & Fox, D. W. 2002, GCN Circ. 1477
- (2) Bersier, D., Winn, J., Stanek, K. Z., & Garnavich, P. 2002a, GCN Circ. 1586
- (3) Bersier, D., et al. 2002b, ApJ, submitted (astro-ph/0211130)
- Bloom et al. (2001) Bloom, J. S., Djorgovski, S. G., & Kulkarni, S. R. 2001, ApJ, 554, 678
- Bond (1997) Bond, H. E. 1997, IAU Circ. 6654
- Cardelli, Clayton, & Mathis (1989) Cardelli, J. A., Clayton, G. C., & Mathis, J. S. 1989, ApJ, 345, 245
- Javier Castander et al. (2002) Castander, F. J., et al. 2002, GCN Circ. 1599
- Castro et al. (2002) Castro, S., Galama, T. J., Harrison, F. A., Holtzman, J. A., Bloom, J. S., Djorgovski, S. G., Kulkarni, S. R. 2002, ApJ, submitted (astro-ph/0110566)
- Chornock & Filippenko (2002) Chornock, R., & Filippenko, A. V. 2002, GCN Circ. 1605
- (10) Draine, B. T., & Hao, L. 2002, ApJ, 569, 780
- Eracleous et al. (2002) Eracleous, M., et al. 2002, GCN Circ. 1579
- Fabricant, Cheimets, Caldwell, & Geary (1998) Fabricant, D., Cheimets, P., Caldwell, N., & Geary, J. 1998, PASP, 110, 79
- (13) Filippenko, A. V. 1982, PASP, 94, 715
- Fox et al. (2002a) Fox, D. W., et al. 2002a, GCN Circ. 1564
- Fox et al. (2002b) Fox, D. W., et al. 2002b, GCN Circ. 1569
- Frail et al. (1997) Frail, D. A., Kulkarni, S. R., Nicastro, S. R., Feroci, M., & Taylor, G. B. 1997, Nature, 389, 261
- (17) Fruchter, A., Krolik, J. H., & Rhoads, J. E. 2001, ApJ, 563, 597
- (18) Galama, T. J., et al. 1998, ApJ, 497, L13
- Garnavich et al. (2002) Garnavich, P. M., et al. 2002, ApJ, in press (astro-ph/0204234)
- Granot & Sari (2002) Granot, J. & Sari, R. 2002, ApJ, 568, 820
- Groot et al. (1997) Groot, P. J. et al. 1997, IAU Circ. 6584
- (22) Horne, K. 1986, PASP, 98, 609
- Jha et al. (2001) Jha, S., Pahre, M. A., Garnavich, P. M., Calkins, M. L., Kilgard, R. E., Matheson, T., McDowell, J. C., Roll, J. B., & Stanek, K. Z. 2001, ApJ, 554, L155
- Klebesadel et al. (1973) Klebesadel, R. W., Strong, I. B., & Olson, R. A. 1973, ApJ, 182, L85
- (25) Massey, P., & Gronwall, C. 1990, ApJ, 358, 344
- Matheson et al. (2000) Matheson, T., Filippenko, A. V., Ho, L. C., Barth, A. J., & Leonard, D. C. 2000, AJ, 120, 1499
- Metzger et al. (1997) Metzger, M. R., Djorgovski, S. G., Kulkarni, S. R., Steidel, C. C., Adelberger, K. L., Frail, D. A., Costa, E., & Frontera, F. 1997, Nature, 387, 878
- Mirabal et al. (2002a) Mirabal, N., Halpern, J. P., Chornock, R., & Filippenko, A. V. 2002a, GCN Circ. 1618
- Mirabal et al. (2002b) Mirabal, N., et al. 2002b, ApJ, 578, 818
- Mulchaey (2001) Mulchaey, J. 2001, http://www.ociw.edu/magellan_lco/instruments/LDSS2/
- O’Donnell (1994) O’Donnell, J. E. 1994, ApJ, 422, 158
- (32) Oke, J. B., & Gunn J. E. 1983, ApJ, 266, 713
- (33) Perna, R., & Lazzati, D. 2002, ApJ, 580, 261
- Piro et al. (1996) Piro, L., et al. 1996, IAU Circ. 6467
- (35) Rhoads, J., Burud, I., & Fruchter, A. 2002, GCN Circ. 1601
- Sahu et al. (2002) Sahu, D. K., et al. 2002, GCN Circ. 1587
- Salamanca et al. (2002) Salamanca, I., Rol., E., Wijers, R., Ellison, S., Kaper, L., & Tanvir, N. 2002, GCN Circ. 1611
- Savaglio et al. (2002) Savaglio, S., et al. 2002, GCN Circ. 1633
- Schlegel, Finkbeiner, & Davis (1998) Schlegel, D. J., Finkbeiner, D. P., & Davis, M. 1998, ApJ, 500, 525
- Schmidt et al. (1989) Schmidt, G., Weymann, R. & Foltz, C. 1989, PASP, 101, 713
- Shirasaki et al. (2002) Shirasaki, Y., et al. 2002, GCN Circ. 1565
- (42) Stanek, K. Z., Bersier, D., Winn, J., & Garnavich, P. 2002, GCN Circ. 1598
- Steidel & Sargent (1992) Steidel, C. C. & Sargent, W. L. W. 1992, ApJS, 80, 1
- (44) Stone, R. P. S. 1977, ApJ, 218, 767
- Vreeswijk et al. (2001) Vreeswijk, P. M., et al. 2001, ApJ, 546, 672
- (46) Wade, R. A., & Horne, K. D. 1988, ApJ, 324, 411
- (47) Winn, J., Bersier, D., Stanek, K. Z., Garnavich, P. & Walker, A. 2002, GCN Circ. 1576
| UT DateaaUT at midpoint of exposure. | Julian DaybbJulian Date – 2,450,000. | AgeccAge in hours from detection of the burst at UT 2002-10-04T12:06:13.57 (Shirasaki et al. 2002). | Tel. | Range | Res.ddApproximate spectral resolution (full width at half maximum intensity) as estimated from sky lines. | P.A.eePosition angle of the spectrograph slit. | Par.ffAverage parallactic angle over the course of the exposures. | Air.ggAverage airmass of observations. | Flux Std.hhThe standard stars are as follows: BD28 = BD+28∘4211, —Stone (1977), Massey & Gronwall (1990); BD17 = BD+17∘4708—Oke & Gunn (1983). | Slit | Exp. |
|---|---|---|---|---|---|---|---|---|---|---|---|
| (hours) | (Å) | (Å) | (∘) | (∘) | (′′) | (s) | |||||
| 2002-10-05.09 | 2552.59 | 14.2 | Baade | 4000-9000 | 13.1 | +28.8 | -38.8 | 1.82 | iiProblems with the Magellan data prevented accurate flux calibration. These spectra were instead matched to the shape of the temporally closest MMT spectrum for the final, combined spectrum. | 1.25 | 600 |
| 2002-10-05.10 | 2552.60 | 14.4 | MMTjjThere is some second-order light contaminating the red wavelengths of these spectra. Through the use of standard stars of different colors, we believe we have minimized any impact of this. | 3080-8850 | 11.0 | -63.2 | -56.99 | 2.22 | BD28/BD17 | 2 | 600 |
| 2002-10-05.10 | 2552.60 | 14.4 | Baade | 4050-6850 | 6.2 | +28.8 | -38.8 | 1.75 | iiProblems with the Magellan data prevented accurate flux calibration. These spectra were instead matched to the shape of the temporally closest MMT spectrum for the final, combined spectrum. | 1.25 | 900 |
| 2002-10-05.12 | 2552.62 | 14.9 | MMTjjThere is some second-order light contaminating the red wavelengths of these spectra. Through the use of standard stars of different colors, we believe we have minimized any impact of this. | 3080-8850 | 11.0 | -63.8 | -57.16 | 1.79 | BD28/BD17 | 2 | 1800 |
| 2002-10-05.15 | 2552.65 | 15.6 | MMT | 4900-9000 | 11.0 | -64.1 | -56.32 | 1.48 | BD17 | 2 | 1800 |
| 2002-10-05.17 | 2552.67 | 16.1 | FLWO | 3720-7540.5 | 7.0 | -70.0 | -63.08 | 1.32 | BD28 | 3 | 1800 |
| 2002-10-05.19 | 2552.69 | 16.6 | FLWO | 3720-7540.5 | 7.0 | -70.0 | -61.06 | 1.21 | BD28 | 3 | 1800 |
| 2002-10-05.21 | 2552.71 | 17.0 | Baade | 4050-6850 | 6.2 | -18.7 | -80.7 | 1.53 | iiProblems with the Magellan data prevented accurate flux calibration. These spectra were instead matched to the shape of the temporally closest MMT spectrum for the final, combined spectrum. | 1.25 | 1200 |
| 2002-10-05.24 | 2552.74 | 17.8 | MMTjjThere is some second-order light contaminating the red wavelengths of these spectra. Through the use of standard stars of different colors, we believe we have minimized any impact of this. | 3080-8850 | 11.0 | -52.1 | -35.97 | 1.07 | BD28/BD17 | 2 | 1800 |
| 2002-10-05.27 | 2552.77 | 18.5 | MMTjjThere is some second-order light contaminating the red wavelengths of these spectra. Through the use of standard stars of different colors, we believe we have minimized any impact of this. | 3080-8850 | 11.0 | -36.9 | -18.66 | 1.03 | BD28/BD17 | 2 | 1800 |
| 2002-10-06.27 | 2553.77 | 42.5 | MMTjjThere is some second-order light contaminating the red wavelengths of these spectra. Through the use of standard stars of different colors, we believe we have minimized any impact of this. | 3100-8850 | 11.0 | -33.5 | -15.43 | 1.03 | BD28/BD17 | 2 | 1800 |
| 2002-10-06.34 | 2553.84 | 44.2 | MMTjjThere is some second-order light contaminating the red wavelengths of these spectra. Through the use of standard stars of different colors, we believe we have minimized any impact of this. | 3100-8850 | 11.0 | 46.8 | 40.19 | 1.08 | BD28/BD17 | 2 | 1800 |
| 2002-10-07.28 | 2554.78 | 66.7 | MMTjjThere is some second-order light contaminating the red wavelengths of these spectra. Through the use of standard stars of different colors, we believe we have minimized any impact of this. | 3100-8850 | 11.0 | -20.5 | -4.63 | 1.03 | BD28/BD17 | 2 | 1800 |
| 2002-10-07.30 | 2554.80 | 67.2 | MMTjjThere is some second-order light contaminating the red wavelengths of these spectra. Through the use of standard stars of different colors, we believe we have minimized any impact of this. | 3100-8850 | 11.0 | 9.4 | 14.33 | 1.03 | BD28/BD17 | 2 | 1630 |
| Observed | Rest | Rest-Frame | ||
|---|---|---|---|---|
| Wavelength | Line | Wavelength | Equivalent Width | |
| (Å) | Identification | (Å) | (Å) | Redshift |
| 7293.1 | Mg II | 2802.7 | 1.2 0.2 | 1.602 |
| 7275.5 | Mg II | 2795.5 | 1.5 0.2 | 1.603 |
| 6763.9 | Fe II | 2599.4 | 1.0 0.2 | 1.602 |
| 6728.8 | Fe II | 2585.9 | 0.4 0.2 | 1.602 |
| 6670.5 | Mg II | 2802.7 | 1.3 0.2 | 1.380 |
| 6654.1 | Mg II | 2795.5 | 1.6 0.2 | 1.380 |
| 6197.1 | Fe II | 2382.0 | 1.1 0.3 | 1.602 |
| 6185.4 | Fe II | 2599.4 | 0.8 0.3 | 1.380 |
| 6172.8 | Fe II | 2373.7 | 1.0 0.3 | 1.601 |
| 6153.2 | Fe II | 2585.9 | 0.7 0.3 | 1.380 |
| 6097.8 | Fe II | 2343.5 | 0.6 0.3 | 1.602 |
| 5668.1 | Fe II | 2382.0 | 0.7 0.2 | 1.380 |
| 5648.3 | Fe II | 2373.7 | 0.4 0.2 | 1.380 |
| 5557.5 | Al II | 1670.8 | 0.6 0.2 | 2.326 |
| 5270.0 | Mg I | 2026.9 | 0.2 0.2 | 1.600 |
| 5148.3 | C IV | 1550.8 | 5.7 0.3 | 2.320 |
| 5105.6 | C IV | 1550.8 | 1.5 0.3 | 2.292 |
| 4823.4 | Mg I | 2026.9 | 0.2 0.2 | 1.380 |
| 4663.0 | Si IV | 1402.8 | 1.5 0.2 | 2.324 |
| 4631.3 | Si IV | 1393.8 | 2.1 0.2 | 2.323 |
| 4592.5 | S I | 1381.6 | 0.3 0.2 | 2.324 |
| 4431.3 | C I | 1329.1 | 0.4 0.3 | 2.334 |
| 4346.2 | Al II | 1670.8 | 0.8 0.2 | 1.601 |
| 4298.2 | Ca II | 1652.0 | 0.1 0.2 | 1.602 |
| 4187.9 | Fe II | 1608.5 | 0.6 0.4 | 1.604 |
| 4120.1 | Al I | 1240.4 | 0.2 0.3 | 2.322 |
| 4050.8 | Ly aaEmission component. | 1215.7 | 0.6 0.3 | 2.332 |
| 4035.6 | Ly | 1215.7 | 3.6 0.3 | 2.320 |
| 4008.0 | Ly | 1215.7 | 4.2 0.4 | 2.297 |
| 3976.3 | Si II | 1194.5 | 2.0 0.4 | 2.329 |
| 3407.7 | Ly | 1025.7 | 6.0 0.5 | 2.322 |
| 3225.6 | Ly | 972.54 | 3.9 0.5 | 2.317 |