Spectroscopic Study of Blue Compact Galaxies
II. Spectral Analysis and Correlations
Abstract
This is the second paper in a series studying the star formation rates, stellar components, metallicities, and star formation histories and evolution of a sample of blue compact galaxies. We analyzed spectral properties of 97 blue compact galaxies, obtained with the Beijing Astronomical Observatory (China) 2.16 m telescope, with spectral range 3580Å – 7400Å. We classify the spectra according to their emission lines: 13 of the total 97 BCGs sample are non-emission line galaxies (non-ELGs); 10 have AGN-like emission (AGNs), and 74 of them are star-forming galaxies (SFGs). Emission line fluxes and equivalent widths, continuum fluxes, the 4000 Å Balmer break index and equivalent widths of absorption lines are measured from the spectra.
We investigate the emission line trends in the integrated spectra of the star-forming galaxies in our sample, and find that: 1) The equivalent widths of emission lines are correlated with the galaxy absolute blue magnitude ; lower luminosity systems tend to have larger equivalent widths. 2) The equivalent width ratio [N ii]6583/H is anti-correlated with equivalent width H; a relationship is given that can be used to remove the [N ii] contribution from blended H+[N ii]6548, 6583. 3) The [O ii], H, H and H fluxes are correlated; those can be used as star formation tracers in the blue. 4) The metallicity indices show trends with galaxy absolute magnitude and attenuation by dust; faint, low-mass BCGs have lower metallicity and color excess.
1 Introduction
Blue compact galaxies (BCGs) are characterized by their very blue color, compact appearance, high gas content, strong nebular emission lines, and low chemical abundances (Kunth & Östlin 2000; Östlin et al. 2001). These properties are typical of unevolved systems, thus suggesting that BCGs should have suffered very few bursts of star formation during their lives and that some of them are probably experiencing their first burst. In a recent review, Kunth & Östlin (2000) argued that, despite a few remaining young galaxy candidates (like I Zw 18, SBS 0335-052), in most BCGs an old underlying stellar population does exist, revealing at least another burst of star formation (SF) prior to the present one (Papaderos et al. 1996; Kong & Cheng 2002). In addition, these properties make BCGs represent an extreme environment for star formation that differs from that in the Milky Way and in other quiescent nearby galaxies (Izotov & Thuan 1999; Izotov et al. 2001). Detailed studies of BCGs are important not only for understanding their intrinsic properties, but also for understanding of the chemical evolution of galaxies, for constraining models of stellar nucleosynthesis, for understanding star formation processes and galaxy evolution in different environments.
To measure the current star formation rates, stellar components, metallicities, and star formation histories and evolution of BCGs, we have prepared an atlas of optical spectra of the central regions of 97 blue compact galaxies in the first paper of this series (Kong & Cheng 2002; Paper I). Because we want to combine the optical spectra we obtained with H i data to constrain simultaneously the stellar and gas contents of BCGs, we selected most of our sample from H i surveys by Gordon & Gottesman (1981). The spectra were obtained at the 2.16 m telescope at the XingLong Station of the Beijing Astronomical Observatory (BAO) in China. A 300 line mm-1 grating was used to achieve coverage in the wavelength region from 3580 to 7400 Å with about 10Å resolution.
In the present paper, we provide measurements of emission line equivalent widths and fluxes, equivalent widths of absorption lines, 4000 Å Balmer break index, as well as fluxes at several points of the continuum for our BCGs sample. We explore the trends in emission line fluxes and equivalent widths in the integrated spectra of SFGs in the sample. The absorption features and the continuum colors will be used to study the stellar population components and star formation history of blue compact galaxies. The emission line equivalent widths and fluxes will be used to determine the physical parameters of blue compact galaxies.
The paper is organized as follows. In Section 2, we classify spectra according to their emission lines. Emission line equivalent widths and fluxes measurements are presented in Section 3. Section 4 describes the continuum determination and the measurements of stellar absorption equivalent widths. In Section 5 we present an analysis of the emission line equivalent widths, line ratios and blue magnitudes of BCGs. Section 6 summarizes our conclusions.
2 Spectral Classification
Most of our BCGs sample was selected from the previous neutral hydrogen studies of blue compact galaxies by Gordon & Gottesman (1981). This study has focused on the Haro, Markarian, and Zwicky lists of galaxies and hence objects were selected on the basis of a blue color, UV-excess or compactness, but not on the basis of emission line strength (Smoker et al. 2000). The optical spectral observations of these galaxies show a range in spectral properties; from galaxies with absorption line spectra to narrow emission line objects classified as SFGs.
In order to study our sample galaxies in detail, we use emission lines to classify the sample spectra into three types: non-emission line galaxy (non-ELG), low-luminosity active galactic nuclei (AGN) and star-forming galaxy (SFG). Our classification scheme is outlined below.
Because the H recombination line is easily detected in optical spectrum and only weakly affected by dust and underlying stellar absorption, we first separated the spectra into two broad categories, emission line galaxy and non-emission line galaxy, using the H recombination line. When H is detected in emission, we classified the galaxy as an emission line galaxy, otherwise as a non emission line galaxy. 13 of 97 BCGs spectra have no H recombination emission lines, and were classified as non-ELGs. Stellar H absorption lines are, in fact, prominent in all of these spectra.
Next we classify the remaining 84 emission line spectra into active galactic nuclei and star-forming galaxies based on the next 3 steps:
-
1.
Because of their very large permitted line widths, Seyfert 1 galaxies are easily recognizable. We classify 5 galaxies (Mrk 335, Mrk 352, Mrk 6, I Zw 26, and Mrk 50) with broad emission lines in their spectra as Seyfert 1 galaxies.
-
2.
To discriminate the Seyfert 2 from star-forming galaxies, we consider the intensity ratio (corrected for reddening, see Sec. 3.4) (Dessauges - Zavadsky et al. 2000) to the remaining 78 galaxies except for VII Zw 631. Dessauges - Zavadsky et al. (2000) showed empirically that galaxies with log are mostly Seyfert 2. Based on this diagnostic, we classify 4 galaxies, Mrk 1, Mrk 622, Mrk 198, Mrk 270, as Seyfert 2. The classification of Seyfert 1 and Seyfert 2 agrees with the results of Véron-Cetty & Véron (2001).
-
3.
When neither [O ii]3727 nor [O iii]4959,5007 are available, we use the flux ratio of H and [N ii]6583 to identify an AGN (Carter et al. 2001). If () , the galaxy is classified as a star-forming galaxy (SFG, H ii-like); otherwise it is classified as an AGN. This allows us to classify VII Zw 631, which has ()= , as an AGN.
To summarize, our sample consists of 13 non-ELGs; 10 AGNs; and 74 SFGs.
3 Emission line measurements
3.1 Measurements
The prominent spectral features of SFGs and AGNs include some commonly found strong emission lines, such as [O ii]3727, H4861, [O iii]4959,5007, H6563, [N ii]6583, [S ii]6716, 6731, and some less common emission lines, such as H4340, [O iii]4363, He i5876, and [O i]6300.
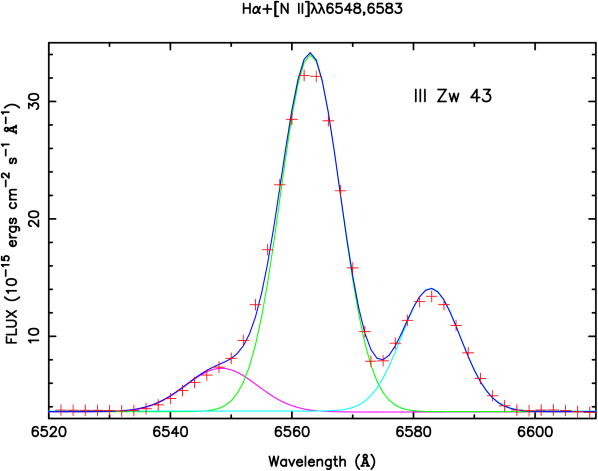
The rest-frame equivalent widths, , and integrated fluxes, , of the emission lines were measured by direct numerical integration, using the SPLOT program in IRAF. The continuum levels and integration limits for the lines were set interactively, with repeat measurements made in difficult case. For single emission lines such as H4861, [O iii]5007, direct integral methods were used. This method allows the measurement of lines with asymmetric shapes (i.e. with deviations from Gaussian profiles). For blended lines such as H, [N ii]6548,6583, and the [S ii]6716, 6731 doublet, we used the Gaussian deblending program of SPLOT. In Figure 1, as an example, we show the three narrow Gaussian components to fit of H, [N ii]6548,6583 of III Zw 43. Note that in these blended cases, the lines are only partly blended. The interactive method allows us to control by eye the level of the continuum, taking into account defects that may be present around the line measured. It does not have the objectivity of automatic measurements, but it does allow us to obtain reliable, accurate measurements.
The equivalent widths of various emission lines are listed in Table 1, for all SFGs and active galactic nuclei. The objects are ordered by increasing right ascension at the epoch 2000 (). Column (1) lists the galaxy name (same as Table 1 of Paper I). Columns (2) – (9) list the equivalent widths of the commonly found emission lines. Columns (10) – (13) list the equivalent widths of less commonly found emission lines. The second line for each entry lists an estimate of the error (see in Sec 3.2). We use the convention that positive equivalent widths denote emission to conserve space and improve readability. A dash in the table indicates either that the corresponding segment of the spectrum is lacking or that the spectrum was too noisy in the region to give a reliable value of equivalent widths. We have chosen an equivalent width of 1.0 Å as the lower limit for true detection. The observed emission line fluxes (the Galactic foreground reddening were corrected, see Kong & Cheng 2002) are listed in Table 2.
3.2 Standard deviations
For measurements of emission lines and absorption lines where the slope and curvature of the continuum are well defined, the main sources of random errors in the flux and equivalent width measurements are the uncertainty of the overall height of the continuum level, the individual intensity points within the interval of integration, the signal-to-noise ratio of the continuum, and the uncertainty in the choice of the best-fitting profile parameter. To estimate standard deviations of emission lines, we followed the method outlined in Tresse et al. (1999), based on the formulae of propagation of errors and Poisson statistics. The derivation of error formulae can also be found in Longhetti et al. (1998).
The error in the flux of an emission line can be expressed as (Tresse et al. 1999):
| (1) |
The error with equivalent width of the line can be expressed as:
| (2) |
where is the mean standard deviation per pixel of the continuum on each side of the line, is the spectral dispersion in Å per pixel (for our spectral sample, D=4.8) and is the number of pixels covered by the line. Because the signal-to-noise ratio for each pixel was estimated by scaling the continuum variance according to Poisson statistics, these are not exactly the formal statistical errors of or . Our approximation slightly overestimates the errors, but in our analysis, we are mainly interested in the consistency of the estimation of errors.
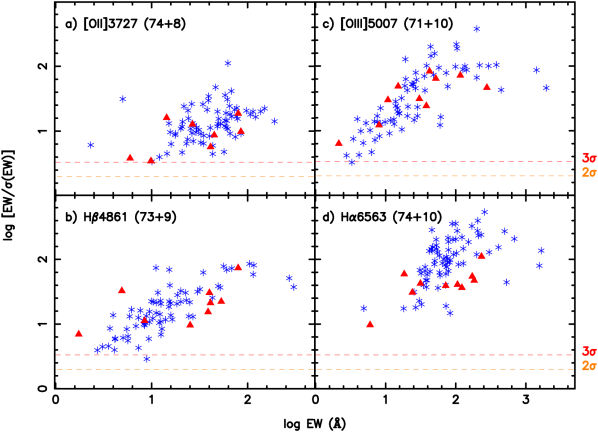
In Figure 2, we plot a logarithm of the detection level of equivalent widths, log (), versus log for 4 commonly found emission lines, [O ii]3727, H, [O iii]5007, and H with equivalent widths above 1.5Å. The result shows our equivalent widths limit is at a confidence level for those commonly found emission lines, and the typical uncertainty in these measurements is less than 10%. For those less common lines, such as H4340, [O i]6300, the measurements typically have confidence levels , and the typical uncertainty in these measurements is about 20%.
3.3 Stellar absorption correction
Fluxes of emission lines will be used to determine the internal reddening of emission line regions, the star formation rate, and the element abundance of galaxies. It is known that the measurements are an underestimate of the real flux of the spectral lines, because of the underlying absorption component. To correct the underlying stellar absorption, some authors (such as Popescu & Hopp 2000) adopt a constant equivalent width ( Å) for all the hydrogen absorption lines. Because the real value of the absorption equivalent width is uncertain and dependent on the age of star formation burst and star formation history (Izotov et al. 1994; González Delgado et al. 1999), the other usual correction for the contamination by stellar absorption lines assumes absorption equivalent widths, and iterates until the color excesses derived from H/H, H/H, and H/H ratios converge to the same value (Izotov et al. 1994).
To derive the absorption equivalent width for hydrogen lines, we have applied an empirical population synthesis method, which uses observed properties of star clusters as a base (Cid Fernandes et al. 2001), to our BCG spectra. This empirical population synthesis method can give the synthetic stellar population spectrum, so we can measure these underlying stellar absorption features for hydrogen lines. A full description of this application and equivalent widths of underlying stellar absorption lines will be presented in a forthcoming paper.
Emission line fluxes of H, H, and H are corrected for this underlying absorption effect as follows:
| (3) |
where and (see in Table 2, were corrected for Galactic extinction) are respectively the absorption corrected and the observed emission line fluxes, and and (see in Table 1) are, respectively, the equivalent widths of the underlying stellar absorption line and of the observed emission line.
3.4 Dust attenuation corrections
The extinction of interstellar dust in SFGs modifies the spectra of these objects. It is necessary to correct all observed line fluxes for this internal reddening. The most widely method used to correct the emission line spectra for the presence of dust is based on the relative strengths of low order Balmer lines. In order to have an internally consistent sample, we applied this method to each of our objects, using only the ratio of the two strongest Balmer lines, HH.
We used the effective absorption curve , which was introduced by Charlot & Fall (2000). The color excess arising from attenuation by dust in a galaxy, , can be written:
| (4) |
| (5) |
where is the intrinsic Balmer flux ratio, is the observed Balmer flux ratio (were corrected for Galactic extinction and underlying stellar absorption), is the effective -band optical depth. , , , and . We adopted = 2.87 for SFGs , and = 3.10 for the AGN-like objects (Dessauges - Zavadsky et al 2000). For 4 galaxies, I Zw 18, Haro 43, II Zw 70, and, I Zw 123, their observed flux ratio, F(H)/F(H), are less than the theoretical flux ratio 2.87, we set to be zero. The results of color excesses are listed in the last column of Table 3.
The value of the color excess was then applied to the observed spectrum, and the final, intrinsic line fluxes relative to H for each galaxy can be expressed as:
| (6) |
where and are the dust-obscured (observed) and intrinsic line fluxes, respectively. The attenuation-corrected line intensities relative to H are given in Table 3 for each star forming galaxy and AGN. The objects are ordered by increasing right ascension at the epoch 2000 (). Column (1) lists the galaxy name, columns (2) – (12) list the line intensities relative to H, column (13) list the intrinsic flux of H, which was corrected for both internal and Galactic extinction, and underlying stellar absorption. Column (14) lists the color excesses for each galaxy.
3.5 Comparison with previous studies
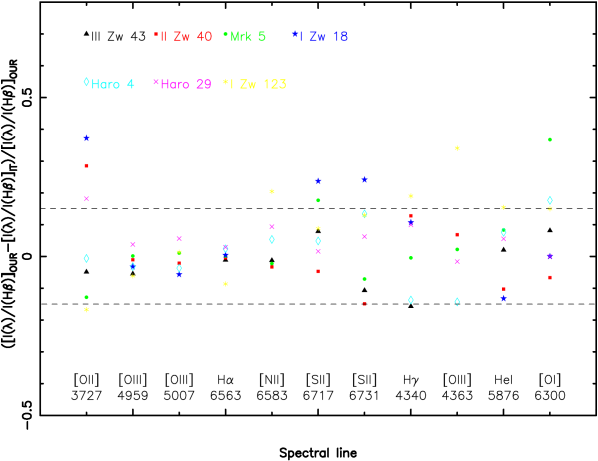
Seven galaxies in our BCG sample — III Zw 43 (0211+038), II Zw 40 (0553+033), Mrk 5 (0635+756), I Zw 18 (0930+554), Haro 4 (1102+294), Haro 29 (1223+487), I Zw 123 (1535+554) — have been observed previously by Izotov, Thuan & Lipovetsky (1997, ITL97), Izotov & Thuan (1998, IT98), and Guseva, Izotov, & Thuan (2000, GIT00), with the Ritchey-Chretien spectrograph at the Kitt Peak National Observatory (KPNO) 4 m telescope, and with the GoldCam spectrograph at the 2.1 m KPNO telescope. These high signal-to-noise ratio spectrophotometric observations allow us to test the quality of our data. We perform a detailed comparison of these previous studies in this subsection.
In III Zw 43, GIT00 did not detect [O iii]4363 line, the [S ii]6731 line intensity ratio is about 10% higher, and the other emission line ratios are in good agreement with ours. For II Zw 40 in GIT00, Haro 29 in ITL97, our data are in fairly good agreement with these studies. In Mrk 5, our [O i]6300 and [S ii]6717 line intensities are about 25% higher, and [O ii] is 13% lower than that in IT98. In I Zw 18, our H, [O iii]4363, [S ii] line intensities are stronger, but He i5876 is weaker. In Haro 4, some less strong lines are not good agreement with IT98. Finally for I Zw 123, the agreement is not good as the other galaxies, our data have large differences with ITL97, but the are in good agreement with ITL97.
We now display this comparison in a more visible form in Figure 3. The horizontal axis represent different spectral lines, the vertical axis shows the differences between our line intensities ( ) and the values of GIT00, IT98 and ITL97 (). We found, our line intensity ratios are in good agreement with these previous studies for most spectral lines of most galaxies, the difference between our sample and these studies is less than 10% for those strong emission lines, and less than 15% for those less strong lines, such as H4340,[O iii]4363,[O i]6300 of most galaxies.
The observed fluxes of H in our data are larger than those in previous studies, the explanation could be: 1) the data in these previous studies were not corrected for the Galactic extinction; 2) Our slit width is larger than that of previous studies; 3) the position angle of slit is different between ours and those previous studies. We will discuss the slit effect and derive an aperture correction for each galaxy in a future paper.
4 Continuum and absorption line measurements
The equivalent widths of absorption lines and the continuum colors provide information about the stellar populations and physical parameters of galaxies. One of our goals is to study the star formation history and chemical evolution of BCGs. To this end, we also determined a pseudocontinuum at selected pivot points and measured the equivalent widths of 7 absorption features, integrating the flux within each window between the pseudocontinuum and the spectrum. The absorption features and continuum points are chosen based on the population synthesis method (Cid Fernandes et al. 2001) that will be used in a forthcoming paper.
4.1 Continuum measurements
In order to derive a continuum, we have measured the flux values at 9 pivot points, 3660, 4020, 4510, 4630, 5313, 5500, 6080, 6630, 7043 Å which were chosen to avoid regions of strong emission or absorption features (Bica 1988, Kong & Cheng 1999, Saraiva et al. 2001). The corresponding fluxes were determined as averages in 20Å bins centered in the listed wavelengths. The determination of the continuum has been checked interactively, taking into account the flux level, the noise and minor wavelength calibration uncertainties as well as anomalies due to the presence of emission lines. The excellent quality of the spectra allowed a precise determination of the continuum in the majority of cases.
In addition, 3 point flux values (3784, 3814, 3918 Å) were measured, which were necessary for the determination of the continuum in galaxies with strong contribution of late B to F stars which present several high-order Balmer absorption lines in this region (Bica et al. 1994). Due to the crowding of the absorption lines, it is difficult to make automatic measurements. We thus selected the highest value of 3784, 3814 and 3918 Å fluxes to represent the continuum in these spectral regions.
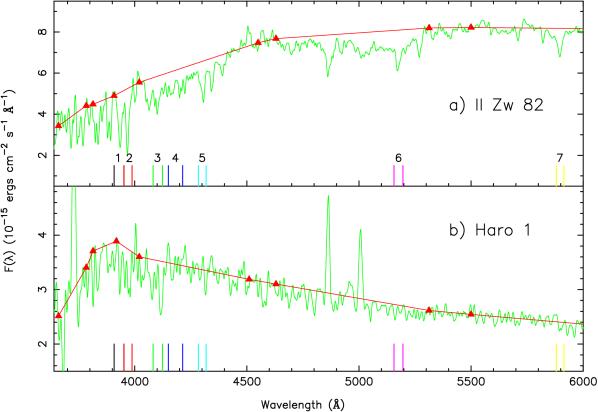
Figure 4 illustrates the application of the method to two of the sample spectra. The spectrum in Fig. 4a corresponds to the nucleus of the non-emission line galaxy II Zw 82. The spectrum is purely stellar, so it is straightforward to measure the pseudocontinuum. Fig. 4b shows the nuclear spectrum of Haro 1, a star-forming galaxy. The continuum is also well defined. Overall, we find that the method works well for most spectra, with the exception of the nuclear regions of AGNs (see end of this Section).
The specific continuum wavelengths and corresponding fluxes for the non-ELGs and SFGs are shown in Table 4. The second line for each galaxy entry lists the errors with continuum measurements, calculated as the rms deviation from the average continuum flux.
4.2 Absorption line measurements
| No. | Window | Main | |
|---|---|---|---|
| (Å) | Absorber | Identification | |
| 1 | 3908–3952 | CaII K | Ca K |
| 2 | 3952–3988 | CaII HH | Ca H |
| 3 | 4082–4124 | H | H |
| 4 | 4150–4214 | CN | CN |
| 5 | 4284–4318 | band | band |
| 6 | 5156–5196 | MgIMgH | Mg |
| 7 | 5880–5914 | NaI | NaI |
The spectrum of a galaxy is produced by the sum of the spectral characteristics of its stellar content (Weiss et al. 1995). Observations of the integrated spectra of galaxies can be used to determine the distribution in age and metal abundance of the stellar population in these systems and hence to determine their epoch of formation and subsequent star formation history (Arimoto & Yoshii 1986). To this aim, some strong, easily identifiable absorption features in our observed spectral range are measured, which include some age and metallicity sensitive absorption features. The absorption line names and adopted spectral wavelength windows are shown in Table 5.
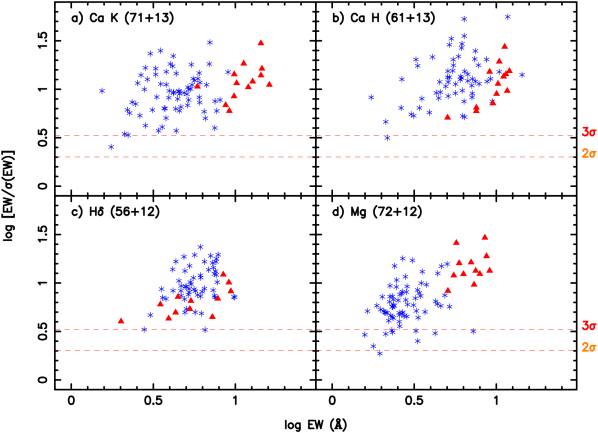
The rest-frame equivalent widths of these absorption features were automatically computed by summing the observed fluxes below the continuum level, which itself is estimated by fitting a straight line to the fluxes in the above continuum regions. The equivalent widths of the absorption features for these non-ELGs and SFGs are presented in Table 6. The second line for each galaxy entry lists the errors on equivalent widths, which are computed from equation (2) in this paper. Figure 5 shows that logarithm of the detection level of versus log for 4 absorption lines, such as Ca K, Ca H, H and MgIMgH when its Å. Our absorption feature limit is at a confidence level for the absorption lines of most galaxies. The mean uncertainty in these measurements is about 10% for those non-ELGs and about 15% for those SFGs.
4.3 4000 Å Balmer break index measurements
As well as the absorption features, we also measured the 4000 Å Balmer break. It is the strongest discontinuity in the optical spectrum of a galaxy and arises because of the accumulation of a large number of spectral lines in a narrow wavelength region (Bruzual 1983). The main contribution to the opacity comes from ionized metals. In hot stars, the elements are multiple ionized and the opacity decreases, so the 4000 Å break will be small for young stellar populations and large for old, metal-rich galaxies (Kauffmann et al. 2002).
We use the definition using narrower continuum bands than Bruzual’s, which was introduced by Balogh et al (1999). The principal advantage of the narrow definition is that the index is considerably less sensitive to reddening effects. It is defined as the ratio of the average fluxes (for frequency unit) measured in the spectral ranges 4000–4100Å and 3850–3950Å: D4000vn=Fν[4000–4100Å]Fν[3850–3950Å]. The D4000vn index is simply a flux ratio and, hence the error is determined from standard propagation techniques. The D4000vn index value and its error for these non-ELGs and SFGs are presented in the last column of Table 6.
While for non-ELGs and SFGs the placement of the continuum is straightforward, this is not the case in the nuclear regions of most AGNs, where the numerous broad lines and intense non-stellar continuum complicate the analysis. The continuum points are impossible to determine accurately, and the equivalent widths of the absorption lines cannot be measured accurately. Therefore, for 10 AGNs, we only measured the integrated fluxes, , and rest-frame equivalent widths, , of the emission lines. We did not measure the continuum fluxes and equivalent widths of the absorption lines for those AGNs.
5 Emission line analysis for SFGs
The main goal of this series of papers is to measure the current star formation rates, stellar components, metallicities, and star formation histories and evolution of BCGs. For this purpose, we are mostly interested in the SFGs. Therefore, in present section, we do not consider the galaxies with Seyfert nuclei and the non-emission line galaxies in our BCG sample. In the following, the sample will refer to the 74 SFGs. We investigate the emission line trends in spectra of those SFGs in this section.
5.1 Equivalent widths of emission lines
5.1.1 versus
It is interesting to explore how the equivalent widths of emission lines depend on the galaxy absolute blue magnitude (Column 6 of Table 1 in Paper I). The equivalent widths of [O ii]3727, H, and H are well correlated with , the other emission lines are also correlated with , but the spread in equivalent widths at a given luminosity is large. Lower luminosity systems tend to have larger equivalent widths for most of emission lines, except for [N ii]6583.
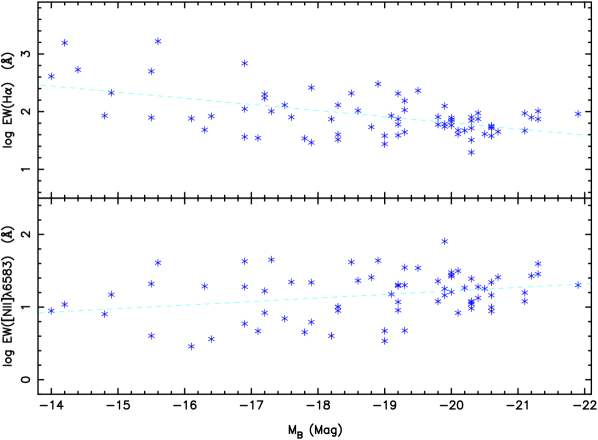
In the top panel of Figure 6, we plot the H emission equivalent width as a function of for the SFGs in our sample. A pronounced trend towards larger equivalent widths at lower luminosities can be found, galaxies with the strongest H lines are of low luminosity. (H) is the ratio of the flux originating from UV photoionization photons ( Å) to the flux from the old stellar population emitted in the rest-frame passband, which forms the continuum at H. Thus, a large equivalent widths is due either to a large UV flux (or absolute magnitude since they are correlated), or to a low continuum from old stars. In either case, this implies a blue continuum color. Hence, the observed trend of larger (H) for fainter galaxies implies that the faint SFG population is dominated by blue galaxies, while the bright SFG population is dominated by redder galaxies.
In the bottom panel of Figure 6, we plot the [N ii]6583 emission line equivalent width as a function of for the SFGs in our sample. Its equivalent width behaves in the opposite way, lower luminosity systems tend to have smaller equivalent widths. Such a trend has also been found in other studies of nearby galaxies (Jansen et al. 2000). The global behavior of [N ii]6583 reflects intrinsic differences in the nitrogen abundance in BCGs, on average luminous BCGs are likely to be enhanced in nitrogen abundance. This suggests that, in faint, low-mass, BCGs, nitrogen is a primary element, whereas in brighter, more massive BCGs it comes from a secondary source.
5.1.2 ([N ii])/(H) versus (H+ [N ii])
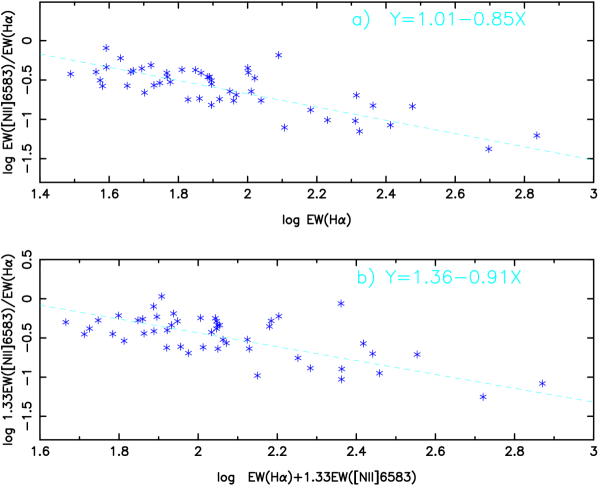
In deep large optical surveys, low-resolution spectroscopy or narrowband H imaging is often used. H and [N ii]6548, 6583 lines are often blended, so it is important to recover the flux solely in H to measure for instance the H luminosity function, hence to derive a star formation rate. Figure 7a shows that the [N ii]6583/H ratio decreases as a function of (H). All the spectra in this figure have ([N ii]) and (H) 10 Å, which can be measured very accurately. The [N ii]6583/H equivalent widths ratio is strongly correlated with (H). A least-squares fit of this relation yields: log ([N ii]6583)(H) = log (H).
Since , we also plot the relation 1.33 / versus in Figure 7b. The trend is similar to that in Fig. 7a, log = log . Thus we can predict which value is expected for the ratio when observing the blend H + [N ii]6548, 6583. For instance, if this latter, EW(H) + 1.33EW([N ii]6583), is Å, the ratio 1.33 / should be . The value of the ratio [N ii]6548,6583 / H, as determined by Kennicutt (1992), is usually taken to be 0.5 to remove the contribution of [N ii] to (H+ [N ii]) blended emission. This is slightly larger than the typical value for our star-forming galaxy sample trend, presumably because Kennicutt’s sample contains a large fraction of early-type galaxies, which have systematically higher ratios (Tresse et al. 1999).
5.2 Fluxes of emission lines
Emission line fluxes are primary traces of the star formation rate (SFR) in galaxies (Kennicutt 1998). For star-forming galaxies, the Balmer emission line luminosities scale directly with the ionizing fluxes of the embedded young stars, and this makes it possible to use the Balmer lines to derive SFRs in galaxies. H is the best line for such applications, but beyond , this line is redshifted into the near infrared. To find other tracers of SFR we analyze the fluxes of other emission lines as a function of the intrinsic H flux.
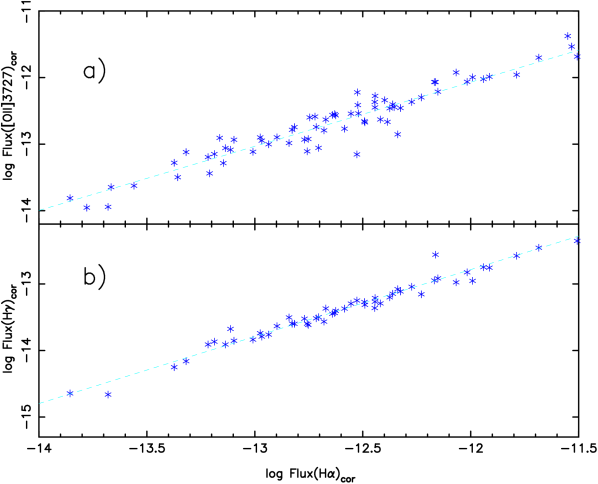
Since the various prominent emission lines correlate with each other, any of them is likely to be a first order ranking indicator of SFR of star-forming galaxies, but the strongest correlations are found between [O ii]3727, H4340, H and H. [O ii]3727 is the most useful star formation tracer in the blue. In Figure 8a, we show the flux of [O ii]3727 as a function of the intrinsic H flux. We found, as expected, these two lines have a strong correlation.
From purely astrophysical considerations, the most reliable star formation tracers in the blue should be the higher order Balmer lines, since the fluxes of these lines scale directly with the massive star formation and are nearly independent of the temperature and ionization level of the emitting gas. Figure 8b shows the relation between the fluxes of H and H. A strong, roughly linear correlation between H and H is apparent. This correlation confirms that the H line can serve as a reliable star formation tracer in strong emission line galaxies, such as the SFGs in our BCG sample. In addition, the correlation between the intrinsic fluxes of H and H is stronger than that between the fluxes of H and H, H is another good star formation tracer for SFGs.
Recently, Charlot & Longhetti (2001) quantified the uncertainties in these SFR estimators. They found SFR estimates based purely on one of emission line luminosity of galaxies could be in error by more than an order of magnitude. On the other hand, with the help of other emission lines, these errors can be substantially reduced. Based on our high quality spectrophotometric data, we can derive star formation rate for each galaxy, using these different star formation rate estimators.
5.3 Line ratios and metallicity
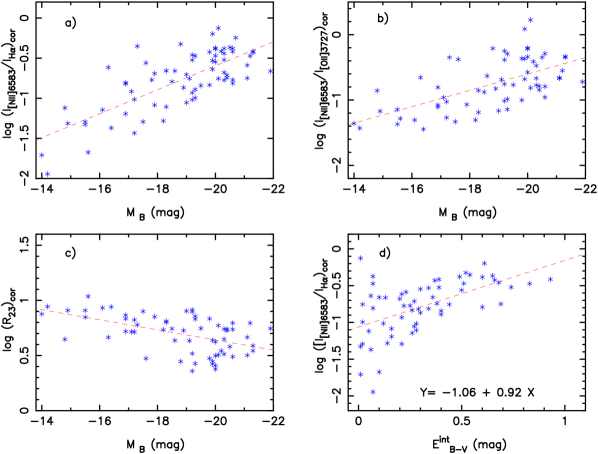
Numerous studies have claimed the existence of a metallicity-luminosity relation in a variety of classes of galaxies: dynamically hot galaxies, i.e. ellipticals, bulges, and dwarf spheroidals, dwarf H ii galaxies, irregular galaxies and spirals (Lequeux et al. 1979; Skillman, Kennicutt, & Hodge 1989; Stasińska & Sodré 2001). In Figure 9a–9c, we show the various metallicity indices, =([O ii]3727+[O iii]4959, 5007)/H (Pagel et al. 1979), [N ii]6583/H (van Zee et al. 1998) and [N ii]6583/[O ii]3727 (Dopita et al. 2000) as a function of the total absolute blue magnitude . The line flux ratios were corrected for both internal (using the value of ) and Galactic extinction, and underlying stellar absorption. Since the reddening correction becomes more uncertain for galaxies with small (H) and (H), we only use those objects that have (H) 5 Å and thus the most reliable reddening corrections. We do find a good correlation between and the metallicity indices [N ii]6583/H and . The correlation of the [N ii]6583/[O ii]3727 index with is statistically significant, but at a rather low level. These metallicity indices show clear trends with galaxy absolute magnitude, confirming that indeed there is a relation in blue compact galaxies between the overall metallicity of the star forming regions and the galaxy luminosity. The higher the galaxy absolute magnitude, the higher the heavy element content. This relation suggests that the metallicity of faint, low mass BCGs is low.
We now examine whether there is a relation between the color excesses due to internal extinction, , and the overall metallicity of the galaxies. So far, there have been contradictory claims in this respect. Zaritsky et al. (1994) found no evidence for a systematic dependence between reddening and abundance in a sample of 39 disk galaxies. In other contexts, Stasińska & Sodré(2001) found that the nebular extinction as derived from the Balmer decrement strongly correlates with the effective metallicity of the emission line regions of spiral galaxies.
Figure 9d shows as a function of the metallicity indicator [N ii]6583/H, which is less affected by the reddening correction. We find there is a clear correlation, . [N ii]6583/H tends to be larger for larger values of , when . Internal extinction indeed correlates with the overall metallicity of BCGs, especially among the galaxies with large . Since the metallicity indices correlate with , the correction between and also suggest the internal extinction of brighter, more massive BCGs is higher.
6 Summary
In this paper, we have measured the fluxes and equivalent widths of emission lines, the fluxes at several points of the continuum, the 4000 Å Balmer break index, and the equivalent widths of absorption lines for our BCGs sample. Then we have analyzed the fluxes and equivalent widths of emission lines for the star-forming galaxy subsample.
Our main results are:
-
1.
We have measured the fluxes and equivalent widths of emission lines for BCGs, and estimated their errors. The typical uncertainties of the measurements are less than 10% for the brightest H6563, H4861, [O ii]3727, [O iii]4959,5007, [N ii]6583, [S ii]6717,6731 lines and less than 20% for the weaker H4340, He i5876, [O i]6300 and [O iii]4363 lines. Our line intensity ratios are in good agreement with those of previous studies. The color excesses due to internal extinction was calculated based on the flux ratio of H/H.
-
2.
The equivalent widths of absorption features, the continuum colors and the 4000 Å Balmer break indices of BCGs were measured. The mean certainty in these measurements is better than 15%.
-
3.
The equivalent width of H emission line is correlated with ; lower luminosity systems tend to have larger equivalent widths. This can be explained by assuming blue galaxies dominate the faint SFG population, while redder galaxies dominate the bright SFG population.
-
4.
On average, luminous BCGs are likely to be enhanced in nitrogen abundance. This suggests that in faint, low-mass, BCGs nitrogen is a primary element, whereas in brighter, more massive BCGs nitrogen comes from a secondary source.
-
5.
A correlation is found between most of emission lines, the strongest correlations are found between [O ii]3727, H, H and H. Besides [O ii]3727, H and H lines can serve as a reliable star formation tracers for strong emission line galaxies.
-
6.
Metallicity indices show clear trends with galaxy absolute magnitude, confirming that there is a relation in galaxies between the overall metallicity of the star forming regions and the galaxy luminosity. Faint, low-mass BCGs have lower metallicity and internal extinction.
References
- Arimoto & Yoshii (1986) Arimoto, N. & Yoshii, Y. 1986, A&A, 164, 260
- Balogh et al. (1999) Balogh, M.L., Morris, S.L., Yee, H.K.C., Carlberg, R.G., et al. 1999, ApJ, 527, 54
- Bica (1988) Bica, E. 1988, A&A, 195, 76
- Bica et al. (1994) Bica, E., Alloin, D., & Schmitt, H. R. 1994, A&A, 283, 805
- Bruzual (1983) Bruzual, A. G. 1983, ApJ, 273, 105
- Carter et al. (2001) Carter, B. J., Fabricant, D. G., Geller, M. J., Kurtz, M. J., & McLean, B. 2001, ApJ, 559, 606
- Charlot & Fall (2000) Charlot, S. , & Fall, S. M. 2000, ApJ, 539, 718
- Charlot & Longhetti (2001) Charlot, S., Longhetti, M. 2001, MNRAS, 323, 887
- Cid Fernandes et al. (2001) Cid Fernandes, R., Sodré, L., Schmitt, H. R., et al. 2001, MNRAS, 325, 60
- Dessauges - Zavadsky et al. (2000) Dessauges-Zavadsky, M., Pindao, M., Maeder, A., & Kunth, D. 2000, A&A, 355, 89
- Dopita et al. (2000) Dopita, M. A., Kewley, L. J., Heisler, C. A., & Sutherland, R. S. 2000, ApJ, 542, 224
- González Delgado et al. (1999) González Delgado, R. M., Leitherer, C., & Heckman, T. M. 1999, ApJS, 125, 489
- Gordon & Gottesman (1981) Gordon, D., & Gottesman, T. S. 1981, AJ, 86, 161
- Guseva et al. (2000) Guseva, N. G., Izotov, Y. I., & Thuan, T. X. 2000, ApJ, 531, 776 (GIT00)
- Izotov et al. (2001) Izotov, Y. I., Chaffee, F. H., Green, R. F. 2001, ApJ, 562, 727
- Izotov et al. (1994) Izotov, Y. I., Thuan, T. X., & Lipovetsky, V. A. 1994, ApJ, 435, 647 (ITL94)
- Izotov & Thuan (1998) Izotov, Y. I. & Thuan, T. X. 1998, ApJ, 500, 188 (IT98)
- Izotov & Thuan (1999) Izotov, Y. I., & Thuan T. X., 1999, ApJ, 511, 639
- Jansen et al. (2000) Jansen, R. A., Fabricant, D., et al. 2000, ApJS, 126, 331
- Kauffmann et al. (2002) Kauffmann, G., Heckman, T. M., White, S. D. M., Charlot, S., et al. 2002, MNRAS, submitted (astro-ph/0204055)
- Kennicutt (1998) Kennicutt, R. C. 1998, ARA&A, 36, 189
- Kong & Cheng (1999) Kong, X., & Cheng, F. Z. 1999, A&A, 351, 477
- Kong & Cheng (2002) Kong, X., & Cheng, F. Z. 2002, A&A, 389, 845 (Paper I)
- Kunth & Östlin (2000) Kunth, D., & Östlin G., 2000, A&A Rev., 10, 1
- Lequeux et al. (1979) Lequeux, J., Rayo, J. F., Serrano, A., et al. 1979, A&A, 80, 155
- Longhetti et al. (1998) Longhetti, M., Rampazzo, R., Bressan, A., & Chiosi, C. 1998, A&AS, 130, 251
- Östlin et al. (2001) Östlin, G., Amram, P., Bergvall N., et al., 2001, A&A, 374, 800
- Pagel et al. (1979) Pagel, B. E. J., Edmunds, M. G., Blackwell, D. E., et al. 1979, MNRAS, 189, 95
- Papaderos et al. (1996) Papaderos, P., Loose, H.-H., Thuan, T. X., & Fricke, K. J. 1996, A&AS, 120, 207
- Popescu & Hopp (2000) Popescu, C. C. & Hopp, U. 2000, A&AS, 142, 247
- Saraiva et al. (2001) Saraiva, M. F., Bica, E., Pastoriza, M. G., & Bonatto, C. 2001, A&A, 376, 43
- Skillman, Kennicutt, & Hodge (1989) Skillman, E. D., Kennicutt, R. C., & Hodge, P. W. 1989, ApJ, 347, 875
- Smoker et al. (2000) Smoker, J. V., Davies, R. D., Axon, D. J., & Hummel, E. 2000, A&A, 361, 19
- (34) Stasińska, G. & Sodré, L. 2001, A&A, 374, 919
- (35) Tresse, L., Maddox, S., Loveday, J., & Singleton, C. 1999, MNRAS, 310, 262
- (36) Véron-Cetty, M.-P., Véron, P. 2001, Quasars and Active Galactic Nuclei (10th Ed.), ESO Scientific Report 20
- (37) van Zee, L., Salzer, J. J., Haynes, M. P., et al. 1998, AJ, 116, 2805
- Weiss, Peletier, & Matteucci (1995) Weiss, A., Peletier, R. F., & Matteucci, F. 1995, A&A, 296, 73
- Zaritsky et al. (1994) Zaritsky, D., Kennicutt, R. C., & Huchra, J. P. 1994, ApJ, 420, 87
Tables 1, 2, 3, 4, 6 are only available in electronic form at the CDS via anonymous ftp to cdsarc.u-strasbg.fr (130.79.128.5) or via http://cdsweb.u-strasbg.fr/cgi-bin/qcat?J/A+A/