X-Ray Jet Emission from the Black Hole X-Ray Binary
XTE J1550–564
with Chandra in 2000
Abstract
We have discovered an X-ray jet due to material ejected from the black hole X-ray transient XTE J1550–564. The discovery was first reported by Corbel et al. (2002b), and here, we present an analysis of the three Chandra observations made between 2000 June and 2000 September. For these observations, a source is present that moves in an eastward direction away from the point source associated with the compact object. The separation between the new source and the compact object changes from in June to in September, implying a proper motion of mas day-1, a projected separation of 0.31-0.85 pc and an apparent jet velocity between and times the speed of light for a source distance range of -7.6 kpc. These observations represent the first time that an X-ray jet proper motion measurement has been obtained for any accretion powered Galactic or extra-galactic source. While this work deals with the jet to the east of the compact object, the western jet has also been detected in the X-ray and radio bands. The most likely scenario is that the eastern jet is the approaching jet and that the jet material was ejected from the black hole in 1998. Along with a 1998 VLBI proper motion measurement, the Chandra proper motion indicates that the eastern jet decelerated between 1998 and 2000. There is evidence that the eastern jet is extended by - in the direction of the proper motion. The upper limit on the source extension in the perpendicular direction is , which corresponds to a jet opening angle of . The X-ray jet energy spectrum is well- but not uniquely described by a power-law with an energy index of () and interstellar absorption. The eastern jet was also detected in the radio band during an observation made within 7.4 days of the June Chandra observation. The overall radio flux level is consistent with an extrapolation of the X-ray power-law with . The 0.3-8 keV X-ray jet luminosity is in the range (3-24) erg s-1 for the June observation using the distance range above but is a factor of 2-3 lower for the later observations. We cannot definitively determine the X-ray emission mechanism, but a synchrotron origin is viable and may provide the simplest explanation for the observations.
Subject headings:
acceleration of particles — accretion, accretion disks — black hole physics — stars: individual (XTE J1550–564) — stars: winds, outflows — X-rays: stars1. Introduction
Outflows are observed in active galactic nuclei (AGN) and for some Galactic compact objects containing relativistic particles that are accelerated away from the compact objects in collimated jets. At least three types of radio jets are observed in Galactic X-ray binaries. In 1992, double-sided radio lobes were detected for two accreting black hole candidates: GRS 1758–258 (Rodriguez, Mirabel & Marti, 1992) and 1E 1740.7–2942 (Mirabel et al., 1992). For these sources, the compact object/radio lobe separations are 1-3 pc, and the lobes are stationary. Due to observational and likely physical similarities to AGN, the name microquasar was given to these sources. The number of X-ray binaries in the group of microquasars was greatly increased with the discovery of relativistic radio jets on much smaller size scales (0.02-0.06 pc). The two best known systems are GRS 1915+105 (Mirabel & Rodriguez, 1994) and GRO J1655–40 (Tingay et al., 1995; Hjellming & Rupen, 1995). For both of these systems, apparently superluminal jet velocities are observed, and the actual jet velocities inferred are 0.9c. Although not as relevant for this work, the third type of radio jet is often called a “compact jet” and has been detected for a relatively large number of X-ray binaries. Despite their small size ( pc), compact jets have been resolved for GRS 1915+105 (Dhawan, Mirabel & Rodríguez, 2000) and Cyg X-1 (Stirling et al., 2001).
The jets are usually detected at radio wavelengths, but, in AGN, optical and X-ray jets are also frequently seen. With the exception of the large-scale (40 pc) diffuse X-ray emission detected from the X-ray binary SS 433 with the Einstein Observatory (Seward et al., 1980), X-ray jets were not seen for Galactic systems prior to the launch of the Chandra X-ray Observatory (Weisskopf et al., 2002) in 1999. With a large improvement in angular resolution over previous missions, Chandra detected arcsecond (0.025 pc) X-ray jets in SS 433 (Marshall, Canizares & Schulz, 2002), but similar jets have not previously been reported for other accretion powered Galactic sources.
XTE J1550–564 was first detected by the Rossi X-ray Timing Explorer (RXTE) All-Sky Monitor (ASM) in 1998 September (Smith, 1998). It was identified as a probable black hole system based on its X-ray spectral and timing properties, and optical observations of the source in quiescence indicate a compact object mass near 10, confirming that the system contains a black hole (Orosz et al., 2002). Soon after the discovery of the source, a jet ejection with an apparent separation velocity 2c was observed in the radio band using Very Long Baseline Interferometry (VLBI), establishing that the source is a microquasar (Hannikainen et al., 2001). The VLBI observations followed a very bright radio and X-ray flare that was likely related to the ejection event (Sobczak et al., 1999; Wu et al., 2002). XTE J1550–564 has shown a high degree of X-ray activity over the last few years, having a major outburst in 2000 (Tomsick, Corbel & Kaaret 2001 and references therein) and mini-outbursts in 2001 and 2002 (Tomsick et al., 2001; Swank, Smith & Markwardt, 2002). Bright radio and X-ray flares like the 1998 flare have not been observed during these outbursts, but unresolved radio emission was detected, indicating the presence of a compact jet (Corbel et al., 2001).
During the 2002 X-ray outburst, radio observations of XTE J1550–564 were made with the Australia Telescope Compact Array (ATCA). The detection of a variable radio source west of XTE J1550–564 (Corbel, Fender & Tzioumis, 2002a) prompted us to examine Chandra observations of the source that were made in 2000. As reported by Corbel et al. (2002b), we discovered an X-ray source that is at approximately the same angular distance from XTE J1550–564 as the variable radio source and is to the east. In this paper, we present an analysis of the Chandra observations. The three sources (XTE J1550–564, the western radio source and the eastern X-ray source) are aligned with each other and with the VLBI radio jets that were detected in 1998. The alignment strongly suggests that the X-ray and radio sources are jets from XTE J1550–564. The jet size scale that we infer is in between those of the previously detected radio jets, providing an important connection between these two types of jets.
2. Observations
Seven XTE J1550–564 Chandra observations occurred in May and June during the 2000 outburst from this source, and two observations were made near the end of the outburst on 2000 August 21 and September 11. These observations were described in previous work where results for the XTE J1550–564 point source were presented (Tomsick, Corbel & Kaaret, 2001; Miller et al., 2001). Modes with two-dimensional imaging were used for the observations made on June 9, August 21 and September 11 (henceforth observations 1, 2 and 3), and, here, we focus on these observations. The rest of the May and June observations were grating observations made in “continuous clocking mode,” providing only one-dimensional imaging. In addition, a filter was used to block the zeroth order due to the high XTE J1550–564 flux level. Thus, with the exception of the June 9 observation, the May and June observations are not suitable for our search for extended emission from the source.
Table 1 provides information about observations 1, 2 and 3, including the observation time, the exposure time and the instrument configuration. All three observations were made using the Advanced CCD Imaging Spectrometer (ACIS). In each case, XTE J1550–564 was placed on one of the back-illuminated ACIS chips (S3), providing the best low-energy response. Observation 1 differs from the other two observations in that the High Energy Transmission Grating (HETG) was inserted. Although grating observations provide two-dimensional imaging, the sensitivity is reduced. Also, observation 1 includes data taken with two different ACIS CCD configurations with longer (1.1 s) and shorter (0.3 s) individual frame exposure times (“alternating exposure mode”). We carried out our analysis using the data from all exposures with a total exposure time of 4957 s. We made background light curves for all three observations and found that, for observation 2, there are brief time segments where excess background is observed. Removing these causes a drop in the exposure time from 5099 to 4985 s. Periods of high background are not seen for the other observations. For observation 3, we used data from the entire 4572 s exposure time.
| MJD111Modified Julian Date (JD2400000.5) at exposure midpoint. | Exposure | Instrument | ||
|---|---|---|---|---|
| Observation | (days) | UT Date | Time (s) | Configuration |
| 1 | 51704.538 | 2000 June 9 | 4957 | ACIS-S/HETG |
| 2 | 51777.405 | 2000 August 21 | 4985 | ACIS-S |
| 3 | 51798.245 | 2000 September 11 | 4572 | ACIS-S |
While a detailed analysis of the XTE J1550–564 energy spectrum is presented for observations 2 and 3 in Tomsick, Corbel & Kaaret (2001), similar results for observation 1 have not been reported. Thus, we extracted the ACIS grating spectrum for observation 1. We fitted 0.8-8 keV MEG (Medium Energy Grating) and 2-10 keV HEG (High Energy Grating) energy spectra with a model consisting of a power-law with interstellar absorption. A reasonably good (but not formally acceptable) fit is obtained () with a column density of cm-2, which is consistent with the Galactic value in the direction of XTE J1550–564, and a power-law photon index of (90% confidence errors). The fit is not significantly improved by the addition of a soft “disk-blackbody” component (Makishima et al., 1986), and no obvious emission lines are present in the residuals. The 0.3-8 keV source flux for observation 1 is erg cm-2 s-1. For observations 2 and 3, we obtain 0.3-8 keV source fluxes of and erg cm-2 s-1, respectively, using the spectral parameters from Tomsick, Corbel & Kaaret (2001).
This paper also includes a re-analysis of a 5 hr radio band observation made with ATCA on 2000 June 1, which is close in time to Chandra observation 1. The ATCA observation was carried out in the high spatial resolution 6B array configuration, and flux measurements were obtained at central frequencies of 1384, 2496, 4800 and 8640 MHz with a total bandwidth of 128 MHz. More details can be found in a previous publication where these observations were used (Corbel et al., 2001).
3. Results
We searched for X-ray sources in the 0.3-8 keV images for all three Chandra observations using the “wavdetect” program (Freeman et al., 2002) in version 2.2 of the CIAO (Chandra Interactive Analysis of Observations) software package. We only included photons with energies up to 8 keV as the ACIS effective area drops off rapidly above this energy. We used data from the ACIS chip containing XTE J1550–564 (ACIS-S3). For observation 1, we restricted the search to a square region of dimension 1′.5 centered on XTE J1550–564 to avoid regions that include the dispersed spectrum, while we searched over the entire S3 chip for observations 2 and 3.
For observation 1, only one other source besides XTE J1550–564 is detected at a significance level of 4.8-. The source is 21′′ east of XTE J1550–564, while the new radio transient is 22′′ west of XTE J1550–564. For observation 2, there are seven sources detected at 3- significance, excluding XTE J1550–564. Although none of the sources have positions consistent with that of the new radio transient (see Kaaret et al. 2002 for flux limits), the most significantly detected source (at 8.3-) is located 23′′ east of XTE J1550–564. For observation 3, there are two sources detected at 3- significance, excluding XTE J1550–564. Similarly to observation 2, the most significantly detected source (at 9.1-) is located 23′′ east of XTE J1550–564, but we do not detect a source at the position of the new radio transient.
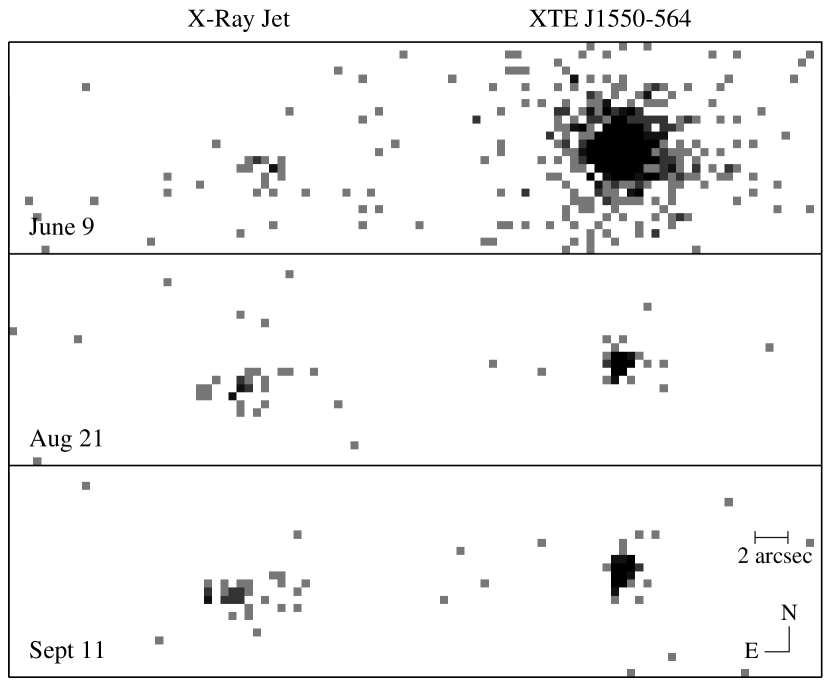
Figure 1 shows the portion of the 0.3-8 keV raw (i.e., un-smoothed) images for the three observations containing XTE J1550–564 and the source to the east of XTE J1550–564 that is detected in all three observations. For observation 3, the position of the eastern source is R.A. = 15h 51m 01s.47, Dec. = –56∘ 28′ 36′′.7 (equinox 2000.0). We calculated this position using the XTE J1550–564 radio position, which is known to (Corbel et al., 2001), and the separations between XTE J1550–564 and the X-ray jet in the Chandra images. The separation measurement is good to about (see §3.2), indicating an error of less than on the X-ray jet position. While we do not detect an X-ray source in these observations coincident with the western radio source, it is notable that the three sources (XTE J1550–564, the western radio source and the eastern X-ray source) are aligned (see Corbel et al. 2002b for a clear illustration of the alignment). In addition, it is remarkable that they are aligned with the radio jets that were resolved during the bright 1998 X-ray outburst from XTE J1550–564 (Hannikainen et al., 2001). This provides evidence for a connection between the radio jets, the eastern X-ray source and the western radio source, and the results presented below support this interpretation. Henceforth, we refer to the eastern X-ray source as the X-ray jet.
3.1. Proper Motion of the X-Ray Jet
We determined the separation between XTE J1550–564 and the X-ray jet for each observation. While an inspection of the images indicates that we obtain reasonable X-ray jet positions with wavdetect, we used a second measurement technique to obtain an estimate of the systematic error. For each observation, we determined the positions for XTE J1550–564 and the X-ray jet by calculating the source centroid using the 0.3-8 keV events from a 16-by-16 pixel (-by-.9) region centered on the wavdetect position. An inspection of the images (see Figure 1) indicates that this region contains all or nearly all of the events that are likely related to the source along with a small number of background events. We estimate that the number of background events in the 16-by-16 pixel regions are 4.0, 1.2 and 0.7 for observations 1, 2 and 3, respectively. Our technique for estimating the background surface brightness is described in §3.3. Compared to the wavdetect positions, the re-calculated XTE J1550–564 positions change by less than , and the X-ray jet positions change by less than . For observations 1 and 2, the re-calculated source separations are and larger, respectively, and, for observation 3, the re-calculated source separation is smaller. Based on these changes, we estimate that the error on the source separation is approximately and is dominated by systematics.
| Rate2220.3-8 keV count rate after background subtraction. | Separation333Separation between the XTE J1550–564 point source and the X-ray jet. | |||
| Observation | (counts s-1) | (arcseconds) | 444Power-law photon index (with 90% confidence errors) obtained with the column density fixed to the Galactic value of cm-2 | Flux555Absorbed 0.3-8 keV X-ray flux in erg cm-2 s-1 obtained from a simultaneous power-law fit to all three observations. We fixed to the Galactic value and found a photon index of . |
| 1 | ||||
| 2 | ||||
| 3 |

The angular separations between XTE J1550–564 and the X-ray jet are given in Table 2 and are plotted vs. time in Figure 2. The separations show that the X-ray jet is moving away from XTE J1550–564, and the data are well-described by a linear increase in the separation. The linear fit shown in the figure corresponds to a proper motion of mas day-1 (mas = milliarcseconds), and an extrapolation of the linear fit predicts zero separation on MJD . MJD 50699 corresponds to 1997 September 8, which is nearly a year before the first reported X-ray and radio activity for XTE J1550–564 in 1998 September. We obtained the RXTE/ASM light curve for the full RXTE mission to check for X-ray activity between early 1996 and 1998 September. XTE J1550–564 was not detected during this time with a 3- upper limit of erg cm-2 s-1 for daily 1.5-12 keV flux measurements. The largest gap in ASM coverage during this time was 14 days, which is much shorter than the duration of a typical outburst. Thus, it is most likely that the material responsible for the X-ray jet was ejected during the large 1998 September radio and X-ray flare (Wu et al., 2002). We note that the errors on the linear fit parameters are dominated by the systematic errors on the individual separations and, thus, do not correspond to 68% confidence statistical errors.
3.2. Source Morphology
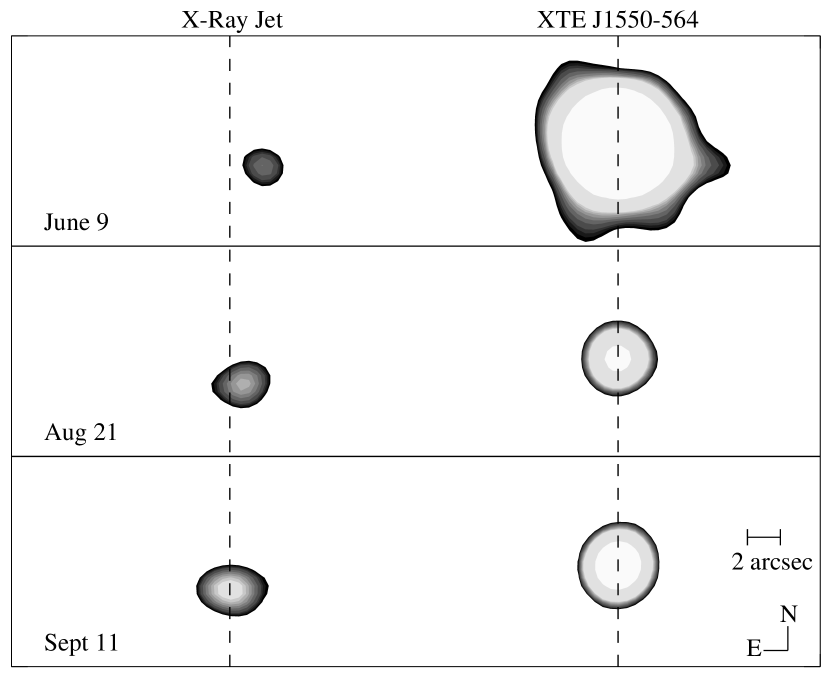
We produced the contour plots shown in Figure 3 for the three observations after convolving the raw images (from Figure 1) with a 2-dimensional Gaussian with a width () of 2 pixels in both directions. In addition to illustrating that the X-ray jet moves away from XTE J1550–564 over time, the contour plots for observations 2 and 3 suggest that the X-ray jet is elongated in the direction of the proper motion (roughly east-to-west).
To study the jet morphology for observations 2 and 3, we produced source profiles showing the number of counts as a function of position along and perpendicular to the jet axis. We determined the jet axis using the source positions obtained above. For observations 2 and 3, the jet position angles are and , respectively. Here, we use a value of , which is consistent with the position angle of derived for the VLBI radio jets (D. Hannikainen, private communication). In producing the source profiles, we used the source counts from a 16-by-16 pixel (-by-.9) region centered on the jet position and oriented so that the re-sampled pixels run along and perpendicular to the jet axis. We then binned the counts in 1 pixel strips in both directions. Each strip is expected to contain 0.07 and 0.05 background counts for observations 2 and 3, respectively, and we neglected this low background level for this analysis. We repeated the analysis for XTE J1550–564 to provide a comparison to the jet profiles. Figures 4 and 5 show the results for observations 2 and 3, respectively. In each case, panels a and b are the profiles along and perpendicular to the jet axis, respectively. The solid lines with Poisson error bars are the jet profiles and the dotted lines are the XTE J1550–564 profiles after re-normalizing so that the peak bin has the same number of counts for the jet and XTE J1550–564.
We performed Kolmogorov-Smirnov (KS) tests (Press et al., 1992) on the un-binned counts to obtain a formal comparison of the profiles. Using the KS statistic, we calculated the probability that the X-ray jet profiles along and perpendicular to the jet axis are taken from the same parent distribution as the XTE J1550–564 profiles (i.e., the probability that the X-ray jet is not extended in a direction). In addition, we compared the X-ray jet profiles to the profiles for the source PG 1634+706 (Observation I.D. 1269), which is used to calibrate the ACIS point-spread-function (PSF). The results shown in Table 3 indicate that it is unlikely that the X-ray jet profile for observation 3 is the same as the XTE J1550–564 and PG 1634+706 profiles along the jet axis with probabilities of 1.8% and 0.2% for the respective comparison sources. The extension along the jet axis is not significant for observation 2 with probabilities of 21% and 6.3% for XTE J1550–564 and PG 1634+706, respectively. In the direction perpendicular to the jet axis, the probabilities that the X-ray jet profiles are the same as the comparison source profiles are in the range 21-71%. Thus, there is no evidence that the X-ray jet is extended in this direction.
| Probability | Probability | ||
| Comparison | (Along | (Perpendicular | |
| Observation | Source666The X-ray jet profiles along the jet axis and perpendicular to the jet axis are compared to the 1-dimensional profiles for the comparison sources. | Jet Axis)777KS test probability that the X-ray jet profile along the jet axis is the same as the comparison profile. | to Jet Axis)888KS test probability that the X-ray jet profile perpendicular to the jet axis is the same as the comparison profile. |
| 2 | XTE J1550–564 | 0.208 | 0.465 |
| 2 | PG 1634+706 | 0.063 | 0.207 |
| 3 | XTE J1550–564 | 0.018 | 0.707 |
| 3 | PG 1634+706 | 0.0024 | 0.378 |
In summary, the KS tests show that it is likely (at least for observation 3) that the X-ray jet is extended along the jet axis. From Figures 4a and 5a, we estimate that the jets are extended by - along the jet axis, but by less than in the perpendicular direction. At an angular separation of from XTE J1550–564, the upper limit of corresponds to a jet opening angle of .
3.3. X-Ray Jet Energy Spectrum and Flux
We extracted energy spectra for each observation. For observations 2 and 3, we used a circular source extraction region with a radius of , and we extracted background spectra from an annulus with an inner radius of and an outer radius of . The source and background regions were both centered on the X-ray jet. For observation 1, the background count rate near the X-ray jet is several times higher than the rates for the other observations. It is likely that this is partly due to the XTE J1550–564 dust-scattering halo, but measurements of the observation 1 background rate far from XTE J1550–564 show count rates that are still about a factor of two higher than the other observations, indicating that the intrinsic observation 1 background rate is somewhat higher. Thus, we used a smaller circular source extraction region with a radius of for observation 1 to minimize contamination. Also, as the XTE J1550–564 X-ray halo contributes to the background near the X-ray jet, we estimated the background level using the counts in an annulus centered on XTE J1550–564 with an inner radius of and an outer radius of ( from the angular separation between XTE J1550–564 and the X-ray jet). We removed the parts of the annulus containing the X-ray jet and the read-out strip. In the 0.3-8 keV energy band, 17, 26 and 32 counts were collected in the source regions for observations 1, 2 and 3, respectively. In the same energy band, we estimate background levels of 1.3, 1.0 and 0.6 counts in the source extraction regions for observations 1, 2 and 3, respectively. We used the CIAO routine “psextract” to extract the spectra and create response matrices.


Although the low numbers of source counts do not provide high quality spectra, we fitted the spectra in an attempt to distinguish between models. As the same instrumental configuration was used for observations 2 and 3, we combined the data from these two observations to improve the statistics. For these initial fits, we re-binned the spectrum after combining the data from the two observations and fitted the spectra using -minimization. We used a power-law model, appropriate for non-thermal emission, and also a thermal bremsstrahlung model (“bremss” in XSPEC version 11.1) and included interstellar absorption. These two models provide fits of nearly identical quality, and in both cases the reduced- value is 0.9 for 7 degrees of freedom. The parameter constraints are poor with both models giving a column density () range of approximately (2-14) cm-2 (90% confidence, ). With left as a free parameter, the range of possible values for the power-law photon index is -2.5, and the bremsstrahlung temperature is only constrained to be 2.8 keV. The column density range quoted above is consistent with the Galactic value in the direction of XTE J1550–564 ( cm-2); thus, we fixed to this value for the fits described below. Detecting iron line emission would provide evidence that the X-ray emission has a thermal origin. No clear excess is observed in the X-ray jet spectrum at iron line energies, but the upper limit on the equivalent width of such a line is high (several keV).
We fitted the 0.3-8 keV spectra for each observation separately with a power-law model and interstellar absorption with the column density fixed to the Galactic value. Rather than -minimization, we used the Cash statistic (Cash, 1979), which does not require that the data be re-binned in energy. This is desirable since re-binning data necessarily removes spectral information. We did not perform background subtraction as the background levels are low enough to neglect. As shown in Table 2, we obtain , and (with 90% confidence errors) for the power-law photon index () for observations 1, 2 and 3, respectively. We conclude that there is no evidence for spectral variability. Thus, we re-fitted the three spectra simultaneously and obtained a value of (energy index = , ). Although we take this as our best estimate of the power-law photon index, we note that it was obtained with fixed to the Galactic value and that uncertainties in represent a possible source of systematic error.
We used the simultaneous power-law fit to the three spectra to obtain measurements of the X-ray jet flux. We obtain 0.3-8 keV absorbed fluxes of , and erg cm-2 s-1 for observations 1, 2 and 3, respectively, indicating that the flux dropped by a factor of 2-3 between the June observation and the August and September observations. The quoted errors are based on the numbers of source and background counts and Poisson statistics, and the observation 1 flux is corrected for the reduction of sensitivity due to insertion of the grating. A source of systematic error (not included in the quoted errors) comes from the fact that a smaller source extraction region was used for observation 1. For observation 2 and 3, 15% and 19% of the counts within the source regions lie outside a radius of (the observation 1 extraction radius), indicating that the observation 1 flux could be higher than the quoted value by 15-20%. Even if this source of systematic error is considered, the data are not strongly inconsistent with a smooth exponential or power-law decay (see also Kaaret et al. 2002). Based on the XTE J1550–564 source distance (-7.6 kpc, Orosz et al. 2002), the intrinsic 0.3-8 keV X-ray jet luminosity for observation 1 is in the range (3-24) erg s-1.

We re-analyzed the 2000 June 1 ATCA radio band observations and found a radio source coincident with the eastern jet. We measured flux levels of , , and mJy at frequencies of 1384, 2496, 4800 and 8640 MHz. We fitted the radio spectrum with a power-law model and obtained an energy index of and a flux density of mJy at 5000 MHz (90% confidence errors in both cases). The power-law fit is not formally acceptable with a reduced- near 5 for 2 degrees of freedom, but the overall radio spectrum is consistent with being an optically thin synchrotron spectrum in the sense that .
Figure 6 shows the four radio flux measurements along with the power-law fits to the Chandra energy spectra. We obtained the power-law fits to the Chandra data by fixing the power-law index to various values and fitting for the normalization. The normalization appropriate for observation 1 is used as it occurred closest in time to the radio observations. The power-law fits shown in the figure include the 90% confidence lower and upper limits on ( and ), the best fit value from the Chandra data () and the value that is most consistent with the radio data (). The “pivot point” for the power-law fits occurs at 2.9 keV, and the flux density is 17 nJy at that point. The overall radio flux level is consistent with an extrapolation of the X-ray spectrum with , and it is possible that the radio and X-ray emission are part of the same spectral component, which would provide evidence for a synchrotron X-ray emission mechanism. We note that lies slightly outside the error region for found from fitting the radio spectrum alone. Although the X-ray and radio observations were not strictly simultaneous, observation 1 and the radio observation were only separated by 7.4 days, and it is unlikely that the flux levels could change significantly over this time.
We also fitted the X-ray spectra for the three Chandra observations simultaneously using the thermal bremsstrahlung model. We used the Cash statistic and fixed the column density to cm-2. The 90% confidence lower limit on the bremsstrahlung temperature is 3.8 keV, and the only other free parameter in the fit is the normalization, which is related to physical parameters according to cm-5 (Rybicki & Lightman, 1979; Arnaud, 1996), where is the source distance, and and are, respectively, the electron and ion number densities within the volume . From the simultaneous fit, = (4-10) cm-5 (90% confidence) for observation 1.
4. Discussion
These results demonstrate that the eastern X-ray source detected in the 2000 Chandra observations is, in fact, X-ray jet emission from XTE J1550–564. In addition to the alignment between the XTE J1550–564 point source, the western radio source and the eastern X-ray source and the fact that these sources are aligned with the 1998 radio jets (Corbel et al., 2002b), the Chandra images indicate motion of the eastern X-ray source away from XTE J1550–564 along the jet axis and there is evidence that the eastern X-ray source is elongated in the direction of this motion. This is only the second Galactic X-ray binary, after SS 433 (Seward et al., 1980; Marshall, Canizares & Schulz, 2002), where X-ray jet emission has been resolved, and these observations represent the first time that an X-ray jet proper motion measurement has been obtained for any accretion powered Galactic or extra-galactic source.
4.1. Jet Kinematics
Our proper motion measurement of mas day-1 for the eastern X-ray jet and the source distance range of 2.8-7.6 kpc, determined from optical observations of XTE J1550–564 in X-ray quiescence (Orosz et al., 2002), indicate an apparent jet velocity () between and . To make progress in estimating the actual jet velocity (), it is necessary to determine what constraints we can place on the source geometry. As jet emission is detected on both sides of XTE J1550–564, we adopt the usual picture of a bipolar outflow with one approaching jet and one receding jet. Although perfect symmetry between the two jets is not critical to the discussion we present here, we note that the fact that one of the jets was detected first in X-rays and the other was detected first in the radio should not be taken as evidence for a lack of symmetry. In fact, another Chandra observation made in 2002 March indicates that there is X-ray emission coincident with the western jet (Kaaret et al., 2002).
The main evidence that the eastern jet is the approaching jet is that the X-ray and radio observations made in 2000 and 2002 indicate that the mean proper motion relative to XTE J1550–564 is greater for the eastern jet. We determine the mean proper motions assuming that the material for both jets was ejected during the large 1998 September radio and X-ray flare (Wu et al., 2002; Sobczak et al., 1999). Corbel et al. (2002b) present arguments for this interpretation. In addition, as mentioned above, an extrapolation of the linear fit to the X-ray jet/XTE J1550–564 separations predicts zero separation prior to 1998 September. Since the first detected activity from XTE J1550–564 occurred in 1998 September, it is very unlikely that the ejection time was earlier. We assume an ejection time of MJD 51078, which corresponds to the peak of the 1998 September radio flare (Wu et al., 2002) and is 2 days before the resolved radio jets were detected (Hannikainen et al., 2001). For the western jet, the separation between the jet and XTE J1550–564 was on MJD 52307 (Corbel et al., 2002b), implying a mean proper motion of 18.3 mas day-1. Based on the linear fit to the three X-ray jet measurements, the X-ray jet reached on MJD 51759, which implies a mean proper motion of 32.9 mas day-1. The larger mean proper motion for the eastern jet indicates that it is the approaching jet.
Although there is strong evidence that the eastern jet is the approaching jet, the actual jet velocity () depends on the exact angle the jet axis makes with the line-of-sight (), which cannot be determined from the jet observations presented in this work. Here, we derive a lower limit on the value of during 2000 June-September when the X-ray jet proper motion measurement was made. The lower limit is independent of but depends on the distance range given above. In general, for an approaching jet, the minimum value of occurs when . Using the minimum apparent velocity for the X-ray jet () and the equation , which relates the apparent velocity to the actual velocity for an approaching jet, we obtain a minimum value for of for . Thus, we conclude that the X-ray jet is moving at a velocity of at least 22% of the speed of light.
4.2. X-Ray Emission Mechanism
For the X-ray jets in AGN, three emission mechanisms are commonly considered: thermal bremsstrahlung, synchrotron and inverse Compton (Harris & Krawczynski, 2002). For most AGN jets, observations rule out thermal bremsstrahlung. When high quality X-ray jet spectra have been obtained for AGN (e.g., Marshall et al. 2001), thermal emission lines have not been detected. Further, the very large amount of hot gas necessary to explain the emission via thermal bremsstrahlung is inconsistent with radio polarization measurements (Harris & Krawczynski, 2002). In fact, the detection of radio polarization indicates that the synchrotron mechanism is operating in the radio band. In some cases, the broad-band (radio to X-ray) energy spectra can be fitted with a single power-law or a power-law with one break (Marshall et al., 2001; Hardcastle, Birkinshaw & Worrall, 2001; Hardcastle et al., 2002), supporting a model where the broad-band jet spectrum is dominated by synchrotron emission. However, inverse Compton emission in the form of synchrotron self-Compton (SSC) is known to dominate the X-ray emission for some AGN jets (Harris & Krawczynski, 2002).
Other than XTE J1550–564, the only X-ray binary where X-ray jet spectra have been obtained is the well-known system SS 433 that resides in the radio nebula W50. The large-scale SS 433 X-ray jets extend up to from the X-ray binary, and the energy spectrum of the jet shows significant spatial variation. On scales of arcseconds and smaller, the jets exhibit X-ray emission lines, indicating that thermal bremsstrahlung contributes to the X-ray emission (Marshall, Canizares & Schulz, 2002; Migliari, Fender & Mendez, 2002). However, on larger angular scales ( to ), emission lines are not detected with ASCA (Advanced Satellite for Cosmology and Astrophysics) in the X-ray band (Yamauchi, Kawai & Aoki, 1994) and RXTE observations indicate that the spectrum extends to 100 keV (Safi-Harb & Petre, 1999), indicating a non-thermal mechanism.
To study the implications of the various emission mechanisms for the XTE J1550–564 jets, it is necessary to estimate the volume of the emitting region. We assume that the shape of the emitting region is a section of a cone with its vertex at the compact object. The base of the conical section is at a distance of from the compact object, where is equal to the angular source separation given in Table 2 plus . The value of comes from our estimate of the source extension obtained in §3.2. Although there is some uncertainty associated with the size of the extension for the eastern jet, we obtained a Chandra image of the western jet with much better statistics and measured a similar extension (Kaaret et al., 2002). The top of the conical section is at a distance of from the compact object, where is equal to the angular source separation minus . As the opening angle of the cone is not well-constrained, we consider values for the full opening angle of (our upper limit for the eastern jet obtained in §3.2) and also . The latter may be more realistic as the upper limit on the opening angle for the western jet is (Kaaret et al., 2002). In addition, we considered the distance range of -7.6 kpc in determining the volume. A caveat is that the volume could be somewhat larger if (the angle between the jet axis and the line-of-sight) is small; however, the fact that the VLBI jets were two-sided and similar in brightness (Hannikainen et al., 2001) makes this unlikely. We obtain a minimum volume of cm3 for a distance of 2.8 kpc and an opening angle of and a maximum volume of cm3 for kpc and an opening angle of .
The volume estimates allow for a calculation of the mass implied by the thermal bremsstrahlung fits to the energy spectrum (see §3.3) for observation 1. Assuming that the plasma consists of electrons and protons (i.e., ) and that is constant over the emitting volume gives cm-3. We obtain a minimum mass of g for kpc, cm3 and cm-5 and a maximum mass of g for kpc, cm3 and cm-5. It is difficult to devise a scenario where the jet could contain such large masses. Even at the lower end of the mass range, it would take the black hole more than 1000 years to accumulate this much mass through accretion at a rate of g s-1, corresponding to the accretion rate for a luminosity of erg s-1 and an accretion efficiency of 10%. It would also be difficult for the jet to start out with much less mass and then to entrain most of its mass from the ISM gradually as it moves away from the compact object because momentum conservation would lead to rapid deceleration of the jet. However, we probably cannot rule out a scenario where the jet suddenly collides with a large amount of material that is far from the compact object such as material that is left from previous ejections. Thermal bremsstrahlung may still be a possible X-ray emission mechanism if the jet has sufficient kinetic energy associated with its bulk motion to heat such material to X-ray temperatures.
Here, we assume that the X-ray and radio spectra can be described by a single power-law with an index of as shown in Figure 6 to study the implications of a synchrotron X-ray emission mechanism. A lower limit on the strength of the magnetic field in the jet, , comes from the assumption of equipartition between the magnetic and electron energy densities (Burbidge, 1956). We derive the equipartition magnetic field using
| (1) |
(Pacholczyk, 1970) where is the integrated luminosity and is an expression, given in Pacholczyk (1970), that depends on the lower and upper frequency limits and the spectral index (). For both parameters, we used the frequency range from to Hz and . We calculated using a flux density of 17 nJy at Hz (appropriate for observation 1) and the range of distances and volumes derived in the previous paragraphs. Considering these distance and volume ranges, the lowest value of we obtain is 134 G for kpc and cm3, and the highest value of we obtain is 566 G for kpc and cm3. These values for are somewhat higher than the values found from radio observations of other Galactic objects (e.g., Rodriguez, Mirabel & Marti 1992). This is at least in part due to the fact that the equipartition energy is higher because the spectrum for the XTE J1550–564 jet extends to the X-ray band.
While it is important to keep in mind that the value for assumes equipartition, we can use our result to obtain estimates of other physical jet quantities such as the Lorentz factor () and lifetime () of the X-ray emitting electrons, the number of electrons in the jet and the total mass of material in the jet. From (Begelman, Blandford & Rees, 1984), where is the Larmor frequency, we obtain values of at 1 keV between and , and we obtain synchrotron lifetimes of 6-60 years at 1 keV using s (Begelman, Blandford & Rees, 1984), which is longer than the lifetime of the XTE J1550–564 X-ray jet. We note that if the flux decay by a factor of 2-3 we observe over a period of about 4 months during the Chandra observations is due to synchrotron losses, this would imply a significantly shorter lifetime and probably a magnetic field strength above the equipartition value. Following Fender et al. (1999), the number of electrons in the jet can be calculated from the parameters of the energy spectrum ( and luminosity) and , and we obtain a range of values from to electrons. Assuming one proton per electron gives values between g and g for the mass of material in the jet. For a mass accretion rate of g s-1, this amount of material could be accumulated in 700 s and s for the two masses, respectively. These times fit with the likely ejection time as the large X-ray and radio flare occurred 2 days before the jets were resolved using VLBI.
Although we have shown that a synchrotron mechanism is viable for the X-ray jet emission from XTE J1550–564, we cannot immediately rule out inverse Compton or SSC. However, we can determine how much emission these mechanisms are likely to contribute by comparing the photon energy density to the magnetic energy density. We calculate the magnetic energy density assuming that only the radio emission has a synchrotron origin, and we use the parameters from the power-law fits to the radio emission ( and a flux density of 1.1 mJy at 5000 MHz) described in §3.3. Using the same distance and volume ranges as above, we obtain -344 G and a magnetic energy density () range of (3-50) erg cm-3. We determine the photon energy density () due to the source itself using (Wilson, Young & Shopbell, 2000), where is the linear size of the source, and we use the approximation . It should be noted that is distance independent, and the main uncertainty in its determination is the opening angle of the cone that is used to estimate . For opening angles of and , respectively, is erg cm-3 and erg cm-3. As these values are considerably less than the magnetic energy density, SSC should not be important. Inverse Compton from the interstellar radiation field (ISRF) or the cosmic microwave background (CMB) are also possibilities. However, the maximum ISRF photon energy density in the Galaxy is erg cm-3 (Strong, Moskalenko & Reimer, 2000) and the CMB photon energy density is erg cm-3, which are both considerably less than the magnetic energy density.
4.3. Jet Deceleration
The mean proper motion for the eastern jet between its ejection in 1998 September and the Chandra detections in 2000 of 32.9 mas day-1 derived above is greater than the proper motion of mas day-1 that we measure during 2000 June-September, indicating a reduction in the jet velocity. The 1998 September VLBI observations of the radio jets provide information consistent with a higher initial ejection velocity. Hannikainen et al. (2001) find that the separation between the two radio jets increases at a rate of 115 mas day-1. Thus, with no additional information, we conclude that the initial proper motion for the eastern, approaching jet is at least 57.5 mas day-1, indicating that the apparent jet velocity decreased by a factor of at least . This also implies a drop in the actual jet velocity; however, the size of this drop depends on the distance to the source () and the angle between the jet axis and the line-of-sight (), and these quantities are not well-constrained.
Although the jet does decelerate, the fact that we detect a proper motion for the X-ray jet is in contrast to the apparently stationary radio lobes that are seen in GRS 1758–258 (Rodriguez, Mirabel & Marti, 1992) and 1E 1740.7–2942 (Mirabel et al., 1992). However, the projected separation between XTE J1550–564 and the X-ray jet (0.31-0.85 pc for -7.6 kpc) is a reasonable fraction of the compact object/radio lobe separations in the other two sources (2.5 pc in GRS 1758–258 and 1.1 pc in 1E 1740.7–2942 assuming kpc in both cases). Thus, the XTE J1550–564 X-ray jet may represent an intermediate stage in the evolution of the jet as the bulk motion velocity decreases from relativistic velocities to zero velocity.
Observations of AGN suggest that their initially relativistic jets also decelerate as they move away from the core of the galaxy (Bridle et al., 1994). A model has been developed to explain jet deceleration where material in the interstellar medium (ISM) or intergalactic medium (IGM) is entrained into the jet (Bicknell, 1994; Bowman, Leahy & Komissarov, 1996). As a consequence of momentum conservation, mass entrainment leads to deceleration of the jet. It is not clear if the XTE J1550–564 jet is entraining material, but even if it is not, elastic collisions between the jet and the ISM material will cause the jet to decelerate. The level of mass entrainment depends on how the jet pressure compares to the ISM gas pressure. The equipartition jet pressure () for the XTE J1550–564 X-ray jet is between erg cm-3 and a few times erg cm-3 for the range of values derived above (134-566 G assuming the X-rays have a synchrotron origin). These values for are considerably larger than the values typically measured for the ISM, which are between and erg cm-3 (Jenkins & Tripp, 2001), and this may suggest that elastic collisions are more important than entrainment in causing the jet to decelerate. A related question is whether we are observing the motion of the bulk flow of material in the jet or the motion of a shock front. Although the latter is a possibility, further deceleration of the eastern X-ray jet is reported in Kaaret et al. (2002), indicating that a mechanism would be necessary to explain the deceleration of the shock.
It is also possible to derive the total internal energy for the X-ray emitting electrons under the equipartition assumption. For the range of source distances and jet opening angles used above, we obtain energies between erg (for kpc and an opening angle of ) and erg (for kpc and an opening angle of ). With the deceleration of the jet, it is interesting to consider whether the change in the bulk motion kinetic energy can account for the internal energy of the electrons. From the Chandra proper motion measurement in 2000, the VLBI proper motion lower limit in 1998 and the total mass of protons in the jet of g derived above for an assumed distance of 2.8 kpc and an assumed opening angle of , we obtain a lower limit on the change in bulk motion kinetic energy () of erg for . For larger values of , which are probably more likely for XTE J1550–564, the lower limit on increases gradually to erg, which is nearly a factor of 2 larger than the internal electron energy. Although the internal electron energy estimates increase significantly with source distance and opening angle, for kpc, there are non-zero values for that give initial jet velocities of , leading to arbitrarily large values for . We conclude that, for certain values of , the bulk motion kinetic energy is sufficient to power the observed X-ray emission for most, if not all, of the allowed distance range. However, it is important to note that this calculation assumes that the total mass of protons in the jet is constant. A significant level of entrainment from the ISM would invalidate this assumption.
4.4. Observations of Quiescent Black Hole Transients
The discovery of X-ray jets from XTE J1550–564 has implications for X-ray observations of black hole transients at low flux levels or in quiescence using observatories without sufficient angular resolution to separate the black hole flux from the jet flux. For example, if XTE J1550–564 was observed with ASCA or BeppoSAX (Satellite per Astronomia X) during the times of our Chandra observations 2 and 3, the X-ray jet flux would significantly contaminate the black hole flux, but the X-ray jet would not be resolved due to the 1′-3′ angular resolution provided by these satellites. For XTE J1550–564, the measured X-ray jet fluxes are between and erg cm-2 s-1 (0.3-8 keV), which is considerably brighter than 5 of the 6 black hole systems observed by Chandra in quiescence (Garcia et al., 2001). For the 1996 March ASCA observation of the microquasar GRO J1655–40 (Asai et al., 1998), it is conceivable that an X-ray jet was responsible for at least part of the detected flux. The ASCA observation was made about 1.5 years after the discovery of powerful radio jets from this source (Tingay et al., 1995; Hjellming & Rupen, 1995). In addition, although it was thought that GRO J1655–40 was in quiescence during the ASCA observation, the source flux was an order of magnitude lower during an observation made by Chandra in 2000 (Garcia et al., 2001). Finally, we note that if X-ray jet fluxes in other sources are similar to the level we observe for XTE J1550–564, they will not significantly contaminate the non-imaging measurements made by RXTE as the quality of the PCA (Proportional Counter Array) background subtraction limits observations to sources brighter than a few erg cm-2 s-1 (3-20 keV).
5. Summary and Conclusions
In this paper, we present an analysis of Chandra observations and an ATCA radio observation of XTE J1550–564 made in 2000 where an X-ray jet is detected to the east of the black hole in the X-ray and radio bands. The discovery of the jet was first reported by Corbel et al. (2002b). The jet axis is aligned with the relativistic bipolar radio jets detected with VLBI in 1998 (Hannikainen et al., 2001). We argue that the material for the 2000 jet was likely ejected during the large X-ray and radio flare that occurred in 1998 (Wu et al., 2002), and that we detect the eastern jet (but not the western jet) during the 2000 observations because the eastern jet is the approaching jet. Although we do not detect a western jet for the 2000 observations, it is detected in the radio band (Corbel, Fender & Tzioumis, 2002a) and X-ray (Kaaret et al., 2002) during observations made in 2002. In fact, this paper is a result of a re-analysis of the 2000 Chandra data that was prompted by the radio detection of the western jet.
A main result of this work is the measurement of the proper motion of the X-ray jet using three Chandra observations made between 2000 June and 2000 September. The X-ray jet moves away from XTE J1550–564 with a proper motion of mas day-1, and these observations represent the first time that an X-ray jet proper motion measurement has been obtained for any accretion powered Galactic or extra-galactic source. Comparing this value to the lower limit on the proper motion of the eastern jet from the 1998 VLBI observations of 57.5 mas day-1 indicates that the jet has decelerated since its initial ejection. Assuming the source distance is in the range from -7.6 kpc, the apparent jet velocity () is between and , and we obtain a lower limit on the actual X-ray jet velocity in 2000 of that is independent of the angle between the jet axis and the line-of-sight (). There is evidence that the eastern jet is extended by - in the direction of the proper motion. The upper limit on the source extension in the perpendicular direction is , which corresponds to a jet opening angle of .
We consider thermal bremsstrahlung, synchrotron, SSC and inverse Compton mechanisms to explain the X-ray jet emission from XTE J1550–564. Assuming equipartition between the magnetic and electron energy densities, we derive a range of jet magnetic field strengths () between 134 G and 566 G, depending on the source distance and jet opening angles between and . From , the range of Lorentz factors () for the electrons responsible for the 1 keV X-rays is (1.2-2.7), and the range of synchrotron lifetimes (at 1 keV) is 6-60 years. The mass of material required by a synchrotron mechanism could be accumulated in the likely jet ejection time of 2 days, while the mass required by a thermal bremsstrahlung mechanism is about 8 orders of magnitude higher, requiring mass from a very large number of ejection events. A comparison between the magnetic energy density in the jet and estimates for the photon density suggest that synchrotron emission should dominate over SSC and inverse Compton mechanisms. We conclude that a synchrotron mechanism is viable and appears to provide the simplest explanation for the observations. The synchrotron hypothesis can be tested via constraints on the optical or IR flux from the jet or by obtaining better constraints on X-ray emission line strengths.
With a projected separation of 0.31-0.85 pc between XTE J1550–564 and the jet in 2000, the XTE J1550–564 jet is intermediate in size to the 0.02-0.06 pc relativistic radio jets that have been detected in several sources (e.g., GRS 1915+105 and GRO J1655–40) and the stationary 1-3 pc radio lobes that have been seen in GRS 1758–258 and 1E 1740.7–2942. Further, the fact that the XTE J1550–564 jets decelerated between 1998 and 2000 provides an additional connection between the two types of jets that have been observed previously. It is likely that the deceleration occurs when the jet collides with the ISM. However, the jet pressure we derive from equipartition suggests that the pressure is too high to entrain material, and that elastic collisions of the jet with ISM material may be a better way to model the jet evolution. More work is necessary to understand the details of the deceleration. Finally, studying the evolution of the XTE J1550–564 jet underscores the fact that jets in Galactic X-ray binaries can provide useful information about jets in AGN. In XTE J1550–564, the time scale for material to travel the length of the jet is several years, while this process takes tens of thousands of years for a typical AGN.
References
- Arnaud (1996) Arnaud, K. A., 1996, Astronomical Data Analysis Software and Systems V, Astronomical Society of the Pacific conference series, Vol. 101, Jacoby, G. H., & Barnes, J., (eds.), San Francisco, CA, Astronomical Society of the Pacific, p. 17
- Asai et al. (1998) Asai, K., Dotani, T., Hoshi, R., Tanaka, Y., Robinson, C. R., & Terada, K., 1998, PASJ, 50, 611
- Begelman, Blandford & Rees (1984) Begelman, M. C., Blandford, R. D., & Rees, M. J., 1984, Reviews of Modern Physics, 56, 255
- Bicknell (1994) Bicknell, G. V., 1994, ApJ, 422, 542
- Bowman, Leahy & Komissarov (1996) Bowman, M., Leahy, J. P., & Komissarov, S. S., 1996, MNRAS, 279, 899
- Bridle et al. (1994) Bridle, A. H., Hough, D. H., Lonsdale, C. J., Burns, J. O., & Laing, R. A., 1994, AJ, 108, 766
- Burbidge (1956) Burbidge, G. R., 1956, ApJ, 124, 416
- Cash (1979) Cash, W., 1979, ApJ, 228, 939
- Corbel, Fender & Tzioumis (2002a) Corbel, S., Fender, R., & Tzioumis, A., 2002a, IAU Circular, 7795
- Corbel et al. (2002b) Corbel, S., et al., 2002b, Science, 298, 196
- Corbel et al. (2001) Corbel, S., et al., 2001, ApJ, 554, 43
- Dhawan, Mirabel & Rodríguez (2000) Dhawan, V., Mirabel, I. F., & Rodríguez, L. F., 2000, ApJ, 543, 373
- Fender et al. (1999) Fender, R. P., Garrington, S. T., McKay, D. J., Muxlow, T. W. B., Pooley, G. G., Spencer, R. E., Stirling, A. M., & Waltman, E. B., 1999, MNRAS, 304, 865
- Freeman et al. (2002) Freeman, P. E., Kashyap, V., Rosner, R., & Lamb, D. Q., 2002, ApJS, 138, 185
- Garcia et al. (2001) Garcia, M. R., McClintock, J. E., Narayan, R., Callanan, P., Barret, D., & Murray, S. S., 2001, ApJ, 553, L47
- Hannikainen et al. (2001) Hannikainen, D., Campbell-Wilson, D., Hunstead, R., McIntyre, V., Lovell, J., Reynolds, J., Tzioumis, T., & Wu, K., 2001, Ap&SSS, 276, 45
- Hardcastle, Birkinshaw & Worrall (2001) Hardcastle, M. J., Birkinshaw, M., & Worrall, D. M., 2001, MNRAS, 326, 1499
- Hardcastle et al. (2002) Hardcastle, M. J., Worrall, D. M., Birkinshaw, M., Laing, R. A., & Bridle, A. H., 2002, MNRAS, 334, 182
- Harris & Krawczynski (2002) Harris, D. E., & Krawczynski, H., 2002, ApJ, 565, 244
- Hjellming & Rupen (1995) Hjellming, R. M., & Rupen, M. P., 1995, Nature, 375, 464
- Jenkins & Tripp (2001) Jenkins, E. B., & Tripp, T. M., 2001, ApJS, 137, 297
- Kaaret et al. (2002) Kaaret, P., Corbel, S., Tomsick, J., Fender, R., Miller, J., Orosz, J., Tzioumis, T., & Wijnands, R., 2002, ApJ, accepted
- Makishima et al. (1986) Makishima, K., Maejima, Y., Mitsuda, K., Bradt, H. V., Remillard, R. A., Tuohy, I. R., Hoshi, R., & Nakagawa, M., 1986, ApJ, 308, 635
- Marshall, Canizares & Schulz (2002) Marshall, H. L., Canizares, C. R., & Schulz, N. S., 2002, ApJ, 564, 941
- Marshall et al. (2001) Marshall, H. L., et al., 2001, ApJ, 549, L167
- Migliari, Fender & Mendez (2002) Migliari, S., Fender, R.P., & Méndez, M., 2002, Science, 297, 1673
- Miller et al. (2001) Miller, J.M. et al. 2001, MNRAS, accepted, astro-ph/0103215
- Mirabel & Rodriguez (1994) Mirabel, I. F., & Rodriguez, L. F., 1994, Nature, 371, 46
- Mirabel et al. (1992) Mirabel, I. F., Rodriguez, L. F., Cordier, B., Paul, J., & Lebrun, F., 1992, Nature, 358, 215
- Orosz et al. (2002) Orosz, J. A., et al., 2002, ApJ, 568, 845
- Pacholczyk (1970) Pacholczyk, A. G., 1970, Radio Astrophysics. Nonthermal Processes in Galactic and Extragalactic Sources, Series of Books in Astronomy and Astrophysics, San Francisco: Freeman, 1970)
- Press et al. (1992) Press, W. H., Teukolsky, S. A., Vetterling, W. T., & Flannery, B. P., 1992, Numerical Recipes in FORTRAN. The Art of Scientific Computing, Cambridge: University Press, 1992, 2nd ed.)
- Rodriguez, Mirabel & Marti (1992) Rodriguez, L. F., Mirabel, I. F., & Marti, J., 1992, ApJ, 401, L15
- Rybicki & Lightman (1979) Rybicki, G. B., & Lightman, A. P., 1979, Radiative Processes in Astrophysics, New York, Wiley-Interscience, 1979)
- Safi-Harb & Petre (1999) Safi-Harb, S., & Petre, R., 1999, ApJ, 512, 784
- Seward et al. (1980) Seward, F., Grindlay, J., Seaquist, E., & Gilmore, W., 1980, Nature, 287, 806
- Smith (1998) Smith, D. A., 1998, IAU Circular, 7008
- Sobczak et al. (1999) Sobczak, G. J., McClintock, J. E., Remillard, R. A., Levine, A. M., Morgan, E. H., Bailyn, C. D., & Orosz, J. A., 1999, ApJ, 517, L121
- Stirling et al. (2001) Stirling, A. M., Spencer, R. E., de la Force, C. J., Garrett, M. A., Fender, R. P., & Ogley, R. N., 2001, MNRAS, 327, 1273
- Strong, Moskalenko & Reimer (2000) Strong, A. W., Moskalenko, I. V., & Reimer, O., 2000, ApJ, 537, 763
- Swank, Smith & Markwardt (2002) Swank, J., Smith, E., & Markwardt, C., 2002, IAU Circular, 7792
- Tingay et al. (1995) Tingay, S. J., et al., 1995, Nature, 374, 141
- Tomsick, Corbel & Kaaret (2001) Tomsick, J. A., Corbel, S., & Kaaret, P., 2001, ApJ, 563, 229
- Tomsick et al. (2001) Tomsick, J. A., Smith, E., Swank, J., Wijnands, R., & Homan, J., 2001, IAU Circular, 7575
- Weisskopf et al. (2002) Weisskopf, M. C., Brinkman, B., Canizares, C., Garmire, G., Murray, S., & Van Speybroeck, L. P., 2002, PASP, 114, 1
- Wilson, Young & Shopbell (2000) Wilson, A. S., Young, A. J., & Shopbell, P. L., 2000, ApJ, 544, L27
- Wu et al. (2002) Wu, K., et al., 2002, ApJ, 565, 1161
- Yamauchi, Kawai & Aoki (1994) Yamauchi, S., Kawai, N., & Aoki, T., 1994, PASJ, 46, L109