Accretion and Outflow in Interacting Binary Systems: FUSE Observations of the Novalike Cataclysmic Variable, UX Ursae Majoris
Abstract
We present far-ultraviolet (905 – 1182 Å), time-series spectroscopy of the eclipsing, novalike cataclysmic variable, UX UMa, acquired with FUSE. The time-averaged spectrum is complex and is dominated by overlapping spectral features. The most prominent features are emission lines of C III, N III, N IV, and O VI. They are broad (FWHM 1800 km s-1) and double-peaked with a central absorption at zero velocity. During eclipse, the spectrum is simpler: the emission lines remain bright, but the absorption components of the lines and the weaker features between the emission lines disappear entirely, leaving a flat continuum. This behavior is also evident in GHRS (1149 – 1660 Å) spectra that we retrieved from the HST archive. The FUV spectra show flickering on time scales of several minutes. The flickering is seen primarily in the continuum and/or the weaker lines rather than in the prominent emission lines. The orbital light curve has a dip in the FUV flux between orbital phases 0.45 – 0.65, similar to a pre-eclipse dip detected in HST observations. The EWs of the line absorption features decrease during the dip. We have detected a systematic wavelength shift of spectral features on the orbital period, but with a phase lag of , a phenomenon that has been reported at optical wavelengths. We discuss the implications of our results in the context of models of an accretion disk with a chromosphere between the disk and the extended wind. Finally, we note that the observed FUV flux is too low to be consistent with the temperature and radius of the WD derived by Baptista et al. (1995), suggesting that their remaining binary parameters, including a mass ratio of 1, ought to be viewed with skepticism.
To appear in the Astrophysical Journal.
1 Introduction
Cataclysmic variables (CVs) are interacting binary systems in which a late-type donor star overflows its Roche lobe and transfers mass to a white dwarf (WD). In the non-magnetic CVs, mass is accreted through a disk around the WD. Novalikes (NLs) are the non-eruptive class of CVs; that is, they do not show dwarf novae outbursts. They are believed to have high mass-transfer rates, which keeps their disks in a permanent outburst state. The accretion disks in NLs are typically well described by optically thick, steady-state disk models with accretion rates yr-1 (e.g., Horne 1993). Because their underlying accretion behavior is fairly well understood, novalike CVs are excellent laboratories to study the more complicated processes associated with disk accretion.
Whether in the form of collimated jets or winds, outflows are closely linked to the disk accretion process. Wind signatures — broad, blueshifted absorption and/or P Cygni profiles in resonance lines such as C IV 1548,1552 Å, Si IV 1393,1402 Å, and N V 1232,1238 Å — are seen in most high accretion rate, disk-fed CVs, including dwarf novae in outburst and novalikes (e.g., Heap et al. 1978; Holm, Panek & Schiffer 1982; Córdova & Mason 1982). Typical terminal velocities in the wind lines range from 3000 – 5000 km s-1, near the escape velocity of the primary (Córdova & Mason, 1982). In eclipsing systems, the resonance lines — seen in emission — are only partially eclipsed or completely unocculted, indicating that the winds are vertically extended (e.g., Mauche et al. 1994).
Much of the phenomenology of disk accretion and outflow in CVs has been revealed by study of the novalike CV, UX UMa. UX UMa has an orbital period of 4.72 hr and is eclipsing (it is, in fact, the brightest eclipsing NL). The binary parameters for UX UMa are typically taken from Baptista et al. (1995), and are based on their identification of WD eclipse features in the UV light curve, a standard mass-radius relation, and previously published limits on the amplitude of the WD (Shafter, 1984). Baptista et al. (1995) obtained an inclination of and, surprisingly, a mass ratio . They also determined a WD flux and a temperature — 52,000 K, or 70,000 K if the lower half of the WD is obscured by the disk — that would indicate a strong WD contribution in the FUV.
Knigge & Drew (1997) modeled the profile changes in the C IV 1548,1552 Å doublet of UX UMa through eclipse. They showed that modeling the line with a biconical disk wind model provides a good fit to the line profile in and out of eclipse. The C IV line has narrow absorption reversals, or dips, that disappear at mid-eclipse. Knigge & Drew (1997) showed that the orbital behavior of the dips could be explained by the presence of a slow, dense transition region (between the disk and the fast, extended wind) that is occulted during eclipse. This transition region, or disk chromosphere, may correspond to the chaotic, slowly-outflowing wind regions that have appeared in some radiative transfer models of CV disk winds (Proga, Stone & Drew, 1998, 1999).
The structure and behavior of winds and chromospheres in UX UMa and other high state CVs is closely tied to unresolved questions concerning the structure of the underlying accretion disk. Knigge et al. (1998) modeled optical and UV spectra of UX UMa and found that steady-state accretion disk models provided poor fits to the shape of the continuum at blue wavelengths and at the Balmer jump (see also Baptista et al. 1998). The discrepancy between disk models and the observed spectrum is ameliorated if significant amounts of optically thin continuum emission are present in the system. An accretion disk chromosphere is a plausible, though currently ad hoc, source of such emission. Other possibilities have been suggested to resolve the mismatch between disk models and the observed spectrum in UX UMa and other NLs, such as a disruption of the inner accretion disk that removes the bluest emitting regions (Long et al., 1994).
To date, virtually all knowledge of the properties of the wind in UX UMa and its relationship with the accretion disk are based on observation and modeling of the C IV doublet. This is not ideal, since we do not know whether the behavior of C IV is representative of other wind-dominated lines. The strength and profile of C IV has been observed to change over a single orbit and over longer timescales (Mason et al., 1995). This variability may be due to asymmetries in the wind which cause orbital variations and/or to secular fluctuations in the mass loss rate; alternatively, it may indicate that there are components of the C IV line that do not originate in the wind at all.
There is a wealth of further information that can be gathered by extending high spectral and time resolution observations of UX UMa to shorter wavelengths. The FUV is an excellent window in which to probe the structure of disks and winds in CVs. For typical maximum temperatures in high state accretion disks ( K), the disk SED peaks in the FUV, so the FUV spectrum is a sensitive tracer of changes in the temperature and structure of the innermost regions of the disk. The FUV is also richly populated with spectral lines of a variety of elements and ionization states which, in principle, can be used to determine the thermal and ionization structure of the wind.
Consequently, we have pursued FUV spectroscopy of UX UMa with the Far Ultraviolet Spectroscopic Explorer (FUSE), which covers 905 – 1182 Å at spectral resolutions (through its large aperture) near 20,000 (Moos et al., 2000). We have also examined archival HST UV spectroscopy to obtain a broader picture of the UV spectrum in UX UMa. In this manuscript, we present observations (§2) and analysis (§3) of the FUV spectrum of UX UMa and discuss what the observations reveal about the structure of disks and outflows in disk accreting systems (§4). We present our conclusions in §5.
2 Observations and Data Reduction
We observed UX UMa with FUSE on 2001 March 23 – 25. A summary of the observations is given in Table 1. The observations were spread over six binary orbits and covered each orbital phase at least twice. The FUSE telescope collects data through four optical channels which cover the wavelength range of the instrument (905 – 1182 Å) with some redundancy. (For a summary of the FUSE optical design and its on-orbit performance, see Sahnow et al. 2000 or the FUSE Observer’s Guide111http://fuse.pha.jhu.edu/support/guide/obsguide.html.) The four channels were co-aligned during our observations, so no correction to the relative wavelength solutions or fluxes of the channels was necessary. All of the data were acquired through the LWRS aperture () in time-tag, or photon counting, mode, in which each photon event is recorded to an accuracy of 1 s.
We re-reduced the data using the latest version of the CALFUSE pipeline (V. 2.0.5), extracting spectra in 200 s intervals. For the orbital period of UX UMa (Baptista et al., 1995), this corresponds to an orbital phase resolution of 0.012 cycles per spectrum. We used the 200 s spectra as our base set of data, which we binned up in time and/or spectral resolution for specific tasks. When combining spectra from the four optical channels, we specified a linear dispersion scale for the output spectrum and added each input datum to the appropriate output bin, weighting the bin average by the sensitivity of the input pixels. Regions of poor flux calibration, most notably the “worm” in channel LiF1, were excluded.
We also created high time resolution light curves of the observations using the raw time-tag photon event files. To construct the light curves, we defined rectangular apertures for each optical channel and summed all of the events occurring in each channel each second. In defining the apertures, we excluded Ly airglow and the “worm”. We also screened photon events using the default pulse height limits adopted by the CALFUSE pipeline. The detector background, summed over astigmatic spatial height and dispersion direction (see the FUSE Observer’s Guide), is 0.5 counts/s/segment at night and 0.8 counts/s/segment during the day. The background is not negligible compared to the FUV count rate of UX UMa ( counts/s), particularly during eclipse, so we subtracted background emission from the counts in each 1 s time interval. The background was estimated by defining apertures away from the target spectrum of the same size as the target apertures and summing the counts therein.
3 Analysis
3.1 The Time-Averaged FUV Spectrum
The time-averaged spectrum of the complete data set is shown in Figure 1. The spectrum has been binned to a dispersion of 0.1 Å, which is the typical resultant resolution for a LWRS spectrum when the channels are combined (see Froning et al. 2001). The spectrum is dominated by strong, broad emission lines from a range of elements and ionization levels. The strongest lines are resonance lines and low-excitation energy excited state transitions of C III 977 Å and the C III blend at 1175 Å; N III 990 Å; the N IV blend at 923 Å; and O VI 1032,1038 Å. In between the strong emission lines, the spectrum is populated by a host of weaker spectral features. The line spectrum is quite complex, and a comparison of the time-averaged spectrum with the spectrum at mid-eclipse (see Figure 2) shows that many lines overlap and are blended with each other. Some of the other lines that can be identified in the time-averaged and/or the mid-eclipse spectrum are S VI 933,944 Å; P IV 951 Å; S III 1013 Å; S IV 1063 and 1073 Å; He II and/or N II 1085 Å; Si III 1108 Å,1109 Å, and 1113 Å; and Si IV 1122,1128 Å. There is a rise in flux at the shortest wavelengths, 965 Å. Some lines that contribute to the increase are identifiable, but they do not account for all of the emission observed. Excess emission near the Lyman limit is a common feature in the FUV spectra of CVs: a similar bump is seen in the outburst spectrum of the dwarf nova, WZ Sge, and in the quiescent spectrum of SS Cyg (Long et al. 2002, 2002b, in preparation). All of these spectra also show FUV lines in emission, which suggests that the blue excess is a blend of line features, dominated by emission from the upper order Lyman series lines. Neutral hydrogen emission is also evident in the presence of Ly and Ly emission features in the spectrum of UX UMa.
The profiles of the strongest lines in the FUV spectrum of UX UMa are entangled with those of the weaker features, but a rough examination of line shapes can be made. The emission lines are broad, with FWHM km s-1 (where the instrumental resolution is km s-1). They have double-peaked profiles with a central absorption reversal at the rest wavelength of each line. The line peaks are separated by 1000 – 1500 km s-1 and are roughly equidistant from the line center. In the strongest lines — N IV 923 Å, C III 977 Å, N III 990 Å, and O VI 1032,1038 Å — the red peak is enhanced relative to the blue peak. The FWHM of the absorption components of the lines are 600 km s-1. Both members of the O VI and S VI doublets are present. We fit the Ly and O VI doublet blend using the IRAF task “specfit” and assuming Gaussian profiles for all three lines. The equivalent widths of the two components of O VI are equal, indicating that the lines are optically thick. The FWHM of the O VI lines (fixed to a 1:1 ratio) are 3800 km s-1. In contrast to O VI, the red component of the S VI doublet appears to be weaker than the blue component, suggesting that these lines are not fully optically thick.
Finally, the time-averaged spectrum also shows narrow interstellar absorption lines from H I and metal transitions. Identified interstellar lines and their EWs are given in Table 2. We pursued a curve of growth analysis to determine the interstellar column density along the line to UX UMa, resulting in an estimate of the column density of . The curve of growth analysis is presented in Appendix A.
3.2 Light Curves and Spectra in Eclipse
The out of eclipse and mid-eclipse spectra of UX UMa are compared in Figure 2. Also shown is the difference between the two spectra; this is the spectrum of the eclipsed light. The out of eclipse spectrum was created by binning the time series 200 sec spectra into 80 phase bins (0.0125 cycles orbital phase resolution) and averaging the 18 bins preceding and following the eclipse (i.e., from orbital phases 0.85 – 0.95 and 0.05 – 0.15). It is qualitatively similar to, but slightly brighter than, the time averaged spectrum; see § 3.3 for a discussion of orbital variations in the FUV spectrum away from the eclipse. The mid-eclipse spectrum is the spectrum of the phase bin at the light curve minimum. The mid-eclipse spectrum and the difference spectrum are binned to a resolution of 0.6 Å. The eclipse spectrum is less complex than the out of eclipse spectrum. At mid-eclipse, the FUV spectrum is characterized by broad emission lines separated by regions of continuum emission. The average flux of the continuum regions of the mid-eclipse spectrum is ergs cm-2 s-1 Å-1 and the continuum is relatively constant over the FUV.
Many of the emission lines present in the out of eclipse spectrum remain strong in eclipse, indicating that they arise from regions that are largely unocculted. The excess emission at wavelengths 955 Å is not eclipsed either. Many features that were not readily identifiable in the time-averaged spectrum due to line blending can be identified at mid-eclipse. Mid-eclipse emission lines include transitions of C III, N III, N IV, O VI, Si III, Si IV, S III, and S IV. There is an emission line at 1085 Å from He II and/or N II and an unidentified feature at 1143 Å. Another emission feature at 951 Å may be from P IV, although H I 949 Å is also present in that region. Because of the presence of clean, line-free regions in the eclipse spectrum, we were able to measure the parameters of most of the emission lines seen at mid-eclipse. The EWs and line widths of these lines are given in Table 3.
A comparison of the out of eclipse and mid-eclipse spectra indicates that most of the weaker, blended features are occulted in eclipse. The difference spectrum shows that the lines are a complex blend of components, predominately in absorption. The line absorption can be just as strong or stronger than the line emission, so that some lines, like the Si IV doublet, can only be identified at mid-eclipse, after their absorption components are occulted. Along with the weaker features, the absorption reversals seen in the profiles of strong lines in the time-averaged spectrum are eclipsed.
We searched for evidence of a rotational component in the lines by examining changes in the FUV spectrum through the eclipse and comparing the profiles of the strong emission lines in the out-of-eclipse and mid-eclipse spectra. If the line regions are rotating in Keplerian motion, the blue wing and peak should be occulted earlier than the red peak and wing. This was seen in C IV 1548,1552 Å in UX UMa (Baptista et al., 1995; Knigge & Drew, 1997). Most of the lines in the FUV spectrum are too confused with other features to examine their eclipse behavior in different velocity bins, but we examined the eclipse of two relatively unblended lines, C III 1175 Å and S IV 1073 Å. In both of these lines, the FUV eclipse minimum occurs at earlier phases at blue velocities relative to the red components of the line. There also appears to be some narrowing of the lines in eclipse: the FWHM of C III and S IV 1073 Å decreases from 3000 km s-1 to 2000 km s-1 during the eclipse. A narrower line profile during eclipse has been seen in C IV in UX UMa (Mason et al., 1995; Knigge & Drew, 1997). Kinematic models predict narrowing of line profiles in eclipse for a collimated disk wind viewed at high inclination, as the more rapidly-rotating parts of the wind near the disk plane are occulted (Knigge & Drew 1997 and sources therein).
Figure 3 shows phase-binned FUV light curves of the eclipse in UX UMa. The upper panel shows the light curve over the full 910 – 1182 Å range, while the lower panel shows the mean light curve for four regions of the spectrum in which only continuum emission is present at mid-eclipse: 955 – 965 Å, 1045 – 1057 Å, 1090 – 1103 Å, and 1149 – 1164 Å. We created both light curves by phase-binning the 1 s count rate light curves into 5000 bins per orbit. We shifted both light curves earlier in phase by 0.006 cycles to bring the phases of full width at half depth of the lower, continuum-dominated, light curve symmetric about phase 0. This phase shift is typical of small-scale variations in the phasing of the eclipse as indicated by the scatter in the (O–C) diagram for the ephemeris (Baptista et al., 1995). Also shown in Figure 3 are the contact points for the eclipse of the WD as found by Baptista et al. (1995).
Figure 3 indicates a narrow eclipse in the FUV. The full eclipse width from start to end is 0.065 cycles in both light curves. The full width at half depth for the upper light curve is 0.043 cycles, but is 0.055 cycles for the lower light curve, suggesting that the emission lines are slightly more centrally concentrated than the continuum emission. The upper light curve is also more asymmetric than the lower curve: the minimum occurs at earlier phases in the former, and its egress is longer than its ingress. Both eclipses are fairly smooth, although there is a hint of a break around phase 0.0175 that could be an egress feature. The FUV eclipse is not total, although it is much deeper in the regions between the resonance emission lines. The eclipse depth over the full FUV range is 40% of the pre-eclipse flux, but it increases to an average depth of 82% for the four regions dominated by continuum emission.222The eclipse depths quoted were taken from flux-calibrated light curves of the eclipse. The raw count rate light curves shown in Figure 3 give slightly shallower eclipses of 45% and 73% for the upper and lower curves, respectively. The discrepancy between fluxed and raw eclipse depths most likely indicates that our method for estimating the background when creating the high time resolution light curves underestimated the true background. The residual continuum emission at mid-eclipse probably originates from the back of the accretion disk, which is not occulted during eclipse. Emission from disk annuli as close as 11–14 RWD from the center of the primary is still visible at mid-eclipse (the lower value assumes the system parameters of Baptista 1995, while the upper value is for the geometry of Smak 1994, and using M from Nauenberg 1972).
3.3 Orbital Variability Outside of the Eclipse
Past analysis of time and orbital variability outside of the eclipse has shed light on behavior of the inner disk and outflow in UX UMa. For example, UX UMa is known to occasionally exhibit low-amplitude 28-s oscillations in optical and UV light (e.g. Warner & Nather 1972; Nather & Robinson 1974; Knigge et al. 1998b). The oscillations originate very near or on the WD surface, and may indicate an appreciable magnetic field that affects the structure of the inner disk. On longer time scales, Mason, Drew, & Knigge (1997) found an orbital variability in the UV light curve of UX UMa in the form of a decline in flux, or “light curve dip”, centered on orbital phase 0.6. They attributed the phenomenon to asymmetric vertical extension in the outer accretion disk absorbing flux from the disk interior. They found a decrease in absorption line EWs during the dip, which indicates that the narrow absorption components seen in the UV lines in UX UMa occur not in the outermost accretion disk annuli but interior to the source of the orbital light curve dip.
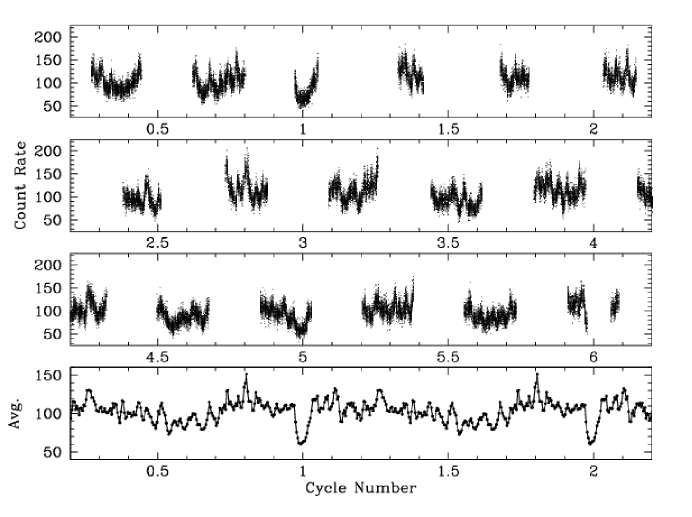
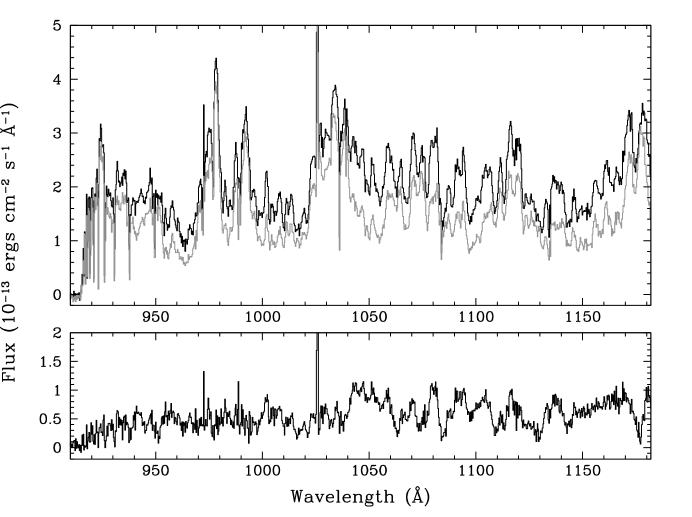
In an effort to search for the oscillations and orbital variability in UX UMa in the FUV, we examined the high time resolution light curves created from the raw photon event files of the FUSE observations and spectral variations in the 200 sec spectra. The top three panels of Figure 4 show the FUV light curve of UX UMa in 2001 March, with the count rate in each 1 s bin plotted vs. cycle number. The bottom panel shows the same data binned into 250 phase bins per orbit. The 1 s light curve shows significant flickering in the FUV light on short time scales, with flickering peaks typically separated by 200 – 1000 s. In several epochs, the count rate changed by a factor of 2 or more within a 5 min time period (0.02 cycles). We compared the spectrum of the flickers to the spectrum away from the flickers by averaging all of the 200 sec spectra that occurred at or near the peak of a flicker and all of the 200 sec spectra obtained between flickers (excluding the eclipse). The “flicker” and “non-flicker” spectra are shown in Figure 5. Also shown is the difference spectrum between the high and low states. The difference spectrum, which is the spectrum of the flickering light, is quite similar in morphology to the spectrum of the eclipsed light at mid-eclipse. That is to say, the source of the flickering is the same material, located near the accretion disk plane, that is occulted in eclipse. Although the continuum shows strong flickering, the prominent emission lines do not flicker.
To search for periodicity in the FUV flux variations, we carried out a power spectrum analysis of the 1 s overall FUV light curve. No sign of the 29 s oscillations was found. We also failed to detect an unambiguous periodicity to the flickering. By injecting sinusoidal signals of varying amplitude into the data stream, we found that we would certainly (probably) have detected the 29 s oscillations with an amplitude of 3% (1%) in our data set. For comparison, the average amplitude of the oscillations in Knigge et al.’s (1998b) HST data (which covered 2000Å – 8000 Å) was roughly 0.5%. However, in their data set, the oscillation amplitude rose to well over 1% near 2000 Å, due to the extremely blue spectrum of the oscillations. It therefore seems likely that we would have been able to detect oscillations of the same strength and spectral shape as those seen by Knigge et al. The absence of the oscillations from our data is not particular surprising, however. For example, Knigge et al. saw the oscillations in only two of their four observing runs.
The phase-binned FUV light curve in Figure 4 shows that in addition to the short time scale flickering, there is an orbital modulation in the form of a decline in flux centered on phase 0.55. On average, the FUV flux is 18% lower between phases 0.45 – 0.65 compared to the rest of the orbit outside of eclipse, and it reaches a maximum depth of 25%. The depth of the eclipse over the full FUV is 40%, so the light curve dip is over half the eclipse depth in the FUV. The dip in the FUV light curve occurs at roughly the same orbital phases as the dip observed by Mason, Drew, & Knigge (1997) in 1996 November HST/GHRS spectra of UX UMa (these spectra are discussed further in §3.4). The 1996 observations did not have full coverage of the orbit, but on two epochs (different binary orbits) the flux between phases 0.6 – 0.7 was 45% and 60% lower than the flux at orbital phases 0.25 – 0.4 (measured in the 1415 – 1433 Å region), a deeper modulation than seen in the FUV.
Mason, Drew, & Knigge (1997) also noted that the EWs of the absorption features in Si IV 1393,1402 Å decreased during the phases of the dip. We compared the FUV spectrum in the dip phases (0.45 – 0.65) to the spectrum outside of the dip (0.05 – 0.25 and 0.75 – 0.95). As with the short time scale flickering, the spectral changes in the orbital dip are seen in the weak lines and the continuum and not in the prominent line emission. The EWs of the absorption components of the FUV lines decrease during the light curve dip, consistent with the results of Mason et al. that place the material responsible for the line absorption interior to the source of the broadband light curve dip. This conclusion is based on UV and FUV observations that only covered the binary orbit approximately twice each, however, and an observation covering multiple binary orbits is necessary to ensure that orbital effects are not contaminated by the spectral variations from flickering.
Finally, we searched for orbital radial velocity variations in the FUV spectra using the 200 s spectra. With the “crosscor” task in IRAF, we cross-correlated the individual spectra with respect to the time-averaged spectrum of the observation in several different wavelength regions. We also measured the centroid of several of the narrow absorption features in the lines by fitting a Gaussian to their profiles in each spectrum. A representative example of the results is shown in Figure 6, which plots the wavelength shift of each 200 s time series spectrum as a function of orbital phase (corrected by 0.006 cycles; see §3.2) for the 1040 – 1182 Å region (this region is shown because this part of the spectrum is largely free of non-varying features from interstellar lines and airglow). The best-fit sinusoid, also shown in Figure 6, has an amplitude of 0.26 Å (or a total peak-to-peak shift of 0.52 Å) and a phase shift of 0.057 cycles. The amplitude corresponds to a velocity of 70 km s-1. The phase shift gives a 21 lag between the photometric phasing and crossing times in the line spectrum. In general, this amplitude and phase shift are descriptive of the orbital radial velocity variations of the FUV spectrum. One possible exception are the absorption reversals in the lines, which show much larger amplitudes, from 140 km s-1 for the S IV and Si III absorption features to a peak amplitude of 200 km s-1 for the absorption component of C III. The wavelength shift in the absorption lines shows the same phase offset as seen in the broader spectrum. We caution that, due to the complex line blending in the FUV spectrum, the apparent change in the velocities of the absorption component centroids could be an artifact of a profile change in the emission components of the lines.
The amplitude of the orbital variation in the overall FUV spectrum is smaller than the value of km s-1 found by Shafter (1984) from radial velocity variations in the emission wings of H (although the FUV absorption lines may show a range of motion equal to or larger than the determination). Schlegel, Honeycutt, & Kaitchuck (1983) performed a spectrophotometric study of the optical lines in UX UMa, observing it twice separated by a year. Although they did not observe a velocity amplitude as low as 70 km s-1, they found that the optical lines exhibited a range of radial velocity amplitudes (121 – 267 km s-1) that varied from line to line and within components of the same line from one epoch to another. More interesting, Schlegel et al. observed a 0.06 cycle phase shift, consistent with the lag we observe in the FUV, in the radial velocity curve of He II 4686 Å in their 1981 observations. The phase lag was not present in 1982. Because of the presence of a pre-eclipse light curve hump in 1981 but not 1982, Schlegel et al. attributed the phase lag at the earlier epoch to a substantial bright spot component in He II. There were problems with this interpretation, however, namely that there was no S-wave component and no eclipse in the He II line in 1981, both of which are expected for bright spot emission. As a result, they suggested that He II emission region may have had substantial vertical extent in that epoch. The phase shift in the FUV between the wavelength shifts and the photometric ephemeris likely derives from some asymmetry in the line formation region, but while the phasing is suggestive of an asymmetry tied to the bright spot, the FUV emission originates interior to the outside edge of the disk, so it is not obvious how to reproduce the observed amplitude and phase shifts.
3.4 Archival HST Spectra of UX UMa
As noted earlier, UX UMa has previously been observed at UV wavelengths with HST. Of particular interest for its combination of moderate spectral resolution and broad wavelength coverage is the 1996 November observation acquired with the GHRS. This observation obtained 1149 – 1660 Å wavelength coverage at 0.6 Å spectral resolution. The spectra were obtained in RAPID mode with 5 s integration time and sampled much of the binary orbit. Orbital light curves and spectra of Si IV 1393,1402 Å from this data set were presented by Mason, Drew, & Knigge (1997) as part of an analysis of the pre-eclipse dips discussed in § 3.3, but the full UV spectrum was not published. As these spectra provide a longer-wavelength complement to our FUV observations, we present them here.
Figure 7 shows the time-averaged, mid-eclipse, and difference spectra of the 1996 GHRS observation of UX UMa. The mid-eclipse spectrum covers the central 0.0125 cycles of the eclipse. The HST time-averaged spectrum is similar in character to the FUSE FUV spectrum: in both, continuum emission is everywhere overlaid by a rich spectrum of lines with emission and absorption components. Strong resonance lines of C IV, N V, and Si IV, as well as He II, are joined by a wealth of other lines, including transitions of C III, Si II and Si III. The strong emission lines have line profiles similar to those seen in the FUV. The lines are double-peaked, with central absorption at the rest wavelengths of the lines. At this epoch, the absorption reversal is relatively shallow in C IV 1548,1552 Å, N V 1238,1242 Å, and He II 1640 Å. The absorption dips are deeper in C III 1175 Å, C II 1334 Å, and Si IV 1393,1402 Å. In Si II and Si III, the lines are primarily or entirely in absorption outside of eclipse.
The FUSE and GHRS spectra overlap from 1149 – 1182 Å, a region including the C III 1175 Å blend. A comparison of the line at two epochs indicates that the profile of the line is variable. Although the line is double-peaked in both spectra, the blue peak dominates in the 1996 spectrum, while the red peak is stronger in 2001. Spectral minima (around 1150 Å, for example) are at the same flux in both spectra, as is the blue peak in C III, but other spectral peaks, at 1158 Å, 1162 Å, and the red peak of C III, are depressed by 15% – 25% in the 1996 observation relative to 2001. The C IV line also shows a strong peak blueward of the rest wavelengths of the doublet lines. This enhanced blue peak is not present in other high-resolution spectra of C IV (1993 GHRS spectra, see Mason et al. 1995, and unpublished 1998 STIS spectra).
The mid-eclipse HST spectrum is also quite similar to the FUSE FUV eclipse spectrum. The weaker line emission is gone, and the spectrum consists of strong emission lines separated by a flattish continuum. The mean continuum flux in the overlap region, 1149 – 1165 Å, is ergs cm-2 s-1 Å-1 in the HST spectrum, compared to ergs cm-2 s-1 Å-1 in the FUSE observation. The UV flux (and, by implication, the mass accretion rate) fluctuates in UX UMa (see, e.g., Knigge et al. 1998) and the difference in continuum flux between the 1996 and 2001 observations is typical for the system. In C III 1175 Å, the line profile is reversed in the HST spectrum compared to the profile in the FUSE observation, with the blue peak dominant in the former and the red peak in the latter. The difference spectrum in the HST observation shows that the eclipsed component of the lines, as in the FUSE observations, are mainly or entirely in absorption. (Note that here, because of phase coverage gaps, the difference spectrum is the difference between the time-averaged spectrum and the mid-eclipse spectrum, rather than a direct comparison of mid-eclipse to phases immediately preceding and following.) The absorption components are narrow, with typical FWHM of 600–900 km s-1, and very deep: several of the dips reach zero flux at their line centers, which did not occur in the FUSE observations. The absorption dips are occulted in some lines, such as C III, Si IV, and C IV, but remain at diminished EW in other lines, including N V and Si III. The broad Si III blend at 1300 Å appears weakly in emission only after its broad, deep absorption component is eclipsed.
Figure 8 shows the light curve of the HST observations for four regions of the spectrum away from the prominent lines and dominated by continuum emission at mid-eclipse. Also shown for reference is the fluxed eclipse light curve from the 2001 FUSE observation (at lower time resolution than the light curves in Figure 3 but created from flux-calibrated spectra). The pre-eclipse flux was higher than the post-eclipse flux in 1996, while the opposite trend was true in 2001. In other respects, the UV and FUV light curves are quite similar, however. The full width at half depth of the 1996 UV eclipse (where the out of eclipse flux was taken as the mean of the pre- and post-eclipse fluxes) is 0.052 cycles, consistent with the eclipse width in the FUV. Moreover, the depth of the eclipse does not change significantly with wavelength: the mean depth in the continuum-dominated regions is 82% in the FUV and 77% in the UV. Even in the longest wavelength range, 1565 – 1665 Å, the depth of the eclipse remains 70% of the out of eclipse flux.
4 Discussion
The FUV spectrum of UX UMa is everywhere characterized by line features. The FUSE and archival HST spectra show that from 910 – 1600 Å, the time-averaged spectrum is composed of prominent emission lines and a complex blend of weaker features. The emission lines arise from the usual transitions seen in CV spectra in the UV: resonance lines of neutral hydrogen and ionized metals and prominent excited state transitions. In eclipse, these lines are largely unocculted, while the weaker features are completely eclipsed. The spectrum of the eclipsed light suggests that the weaker line features are primarily in absorption.
Because of the severe line blending, it is difficult to determine where to place the continuum in the FUV and UV spectra, and some of the eclipsed line region may be in emission as well as in absorption. At mid-eclipse, the spectrum in between the prominent resonance emission lines is smooth and appears to consist only of continuum emission. As a result, the emission line component of the eclipsed light, if present, must have substantial asymmetry or originate very close to the WD to explain why it is not seen during eclipse, when much of the back of the accretion disk remains unocculted. A possible source for asymmetric emission is the mass accretion stream. Baptista et al. (1998) created spatially resolved spectra of the accretion disk in UX UMa from UV and optical HST/FOS observations. They found that the quadrant of the disk containing the mass accretion stream is a source of UV emission, including C IV line emission, down to 0.1R, which they attributed to overflow of the mass stream above the disk. The introduction of an asymmetry in the line emission by the mass stream is also consistent with the phase lag in the orbital radial velocity variations in the FUV spectrum with respect to the photometric ephemeris.
The origin of the line absorption also has important implications for the structure of the accretion disk and the wind. Knigge & Drew (1997) modeled the C IV 1548,1552 Å line profile in UX UMa in and out of eclipse with a kinematic model of a rotating, biconical disk wind. They found that to match the eclipse of the narrow absorption features at the rest velocity of the doublet, their model had to include a dense, slowly outflowing transition region between the fast wind and the disk, which they dubbed an accretion disk chromosphere. Some hydrodynamical models of radiatively-driven disk winds have predicted regions of chaotic, low velocity motion that may be the source of the chromospheric features seen in UX UMa (Proga, Stone & Drew, 1998). The results of Knigge & Drew were based on only one epoch of observation of UX UMa and only one line, however, which left open the possibility that secular variability and/or non-wind contributions to C IV could be responsible for the narrow absorption components of the line. An alternate explanation for the absorption components is absorption by low-velocity material in the outer disk; narrow, low-velocity absorption lines from the outer disk are present in the FUV spectrum of the dwarf nova U Gem in outburst, for example (Froning et al., 2001).
Mason, Drew, & Knigge (1997) showed that the narrow line absorption in UX UMa also occurred in Si IV 1393,1402 Å and that the absorption line EWs decreased during a broadband light curve dip that they attributed to asymmetric vertical extension in the outer disk. The EW decline suggested that the line absorption components were interior to the outer edge of the disk, which made the disk wind/chromosphere model of Knigge & Drew (1997) more attractive. The FUSE observations, obtained 5 years after the HST spectra, show that the line absorption components are present throughout the UV and FUV in a wide variety of species and ionization states and are persistent. The EWs of the absorption lines in the FUV spectrum also decrease during the broadband light curve dip. If the line absorption occurred in the outer disk edge, the line EWs would increase, not decrease, when the amount of absorbing material increased around phase 0.6. The low velocities and narrow profiles of the absorption lines are consistent with origin in the dense, slowly outflowing transition region between the accretion disk and the fast wind. Nevertheless, both the HST and FUSE observations sample a small number of orbits, so it remains possible that the orbital spectral changes are being confused with variability caused by flickering; additional broadband UV observations spread over the binary orbit of UX UMa will be necessary to properly average out the flickering effects.
Another ongoing question in UX UMa and in other CVs concerns the continuum source in the ultraviolet. In UX UMa, as in other NLs, the accretion disk is believed to be in a high mass-accretion rate steady-state, and we expect it to be the dominant continuum source in the optical and UV. Previous studies have not been successful in modeling the continuum emission in UX UMa with steady-state disk models, however. Knigge et al. (1998) explored model disk fits to broadband HST spectra (1250 – 9000 Å) of UX UMa. Their models were constructed from sums of appropriately weighted stellar atmosphere spectra at the temperature and gravity of each accretion disk annulus. They demonstrated that the model disk spectra provide a poor fit to the overall spectral shape. At optical wavelengths, the models overestimate the amplitude of the Balmer jump, while in the UV, the models are too blue to match the observed spectrum. The discrepancy at blue wavelengths between model and observed spectra becomes worse when the FUV spectrum is also taken into account: the model disk spectrum of Knigge et al. (1998) would exceed the observed 2001 March FUV flux by 50%.
We examined the FUV fluxes predicted by accretion disk models for the geometry of UX UMa (testing the geometries of both Baptista et al. 1995 and Smak 1994). Optical and UV eclipse mapping analyses have given mass accretion rates for UX UMa from to (Rutten et al., 1992; Baptista et al., 1995, 1998), where the range reflects a real variation in the observed flux and a likely variation in the mass flow rate through the disk. The distance to UX UMa has been estimated to lie from 215 – 345 pc (Baptista et al. 1995 and sources therein), and the reddening is E(B–V) = 0, or at most E(B–V) 0.04 (Knigge et al., 1998). We compared the fluxes of FUV and UV spectra of UX UMa to model disk spectra constructed from summed, area-weighted, Doppler-broadened spectra of stellar atmospheres set to the appropriate temperature and gravity for a given disk annulus, assuming the standard, steady-state temperature distribution in the disk (see Froning et al. 2001 for a full description of the models).
There is a continued discrepancy between the models and the observed fluxes at blue wavelengths. If the accretion disk is assumed to be the dominant FUV continuum source — which corresponds to scaling the model to something like the minima in the FUV spectrum away from the strong lines: ergs cm-2 s-1 Å-1 at 965 Å and ergs cm-2 s-1 Å-1 at 1095 Å — the predicted mass accretion rate is , assuming the upper range to the distance (increasing the reddening to the upper limit gives ). Although the 1996 November and 2001 March HST and FUSE spectra have the same out of eclipse fluxes in their region of overlap (1149 – 1182 Å), the same accretion disk model will not fit both spectra. The model that scales to the flux in the FUV only provides half of the flux observed in 1996 November at 1250 Å and one third of the observed flux at 1400 Å. Increasing the reddening to E(B–V) = 0.04 has a negligible effect on the slope of the spectrum in the UV. The unknown degree of line blanketing affecting the FUV and UV limits our ability to assess the discrepancy between the observed continuum and the disk models, but it is clear that a single accretion disk model cannot fit the continuum over the full FUV+UV range.
Although the discrepancy between the disk models and observed spectra in high state CVs could result from some problem with the physics of the models, a more likely cause is an incomplete description of the three-dimensional structure of the accretion disk. The presence of substantial vertical extent in the disk, as indicated by the absorption components in the spectral lines and the orbital dip at phase 0.6, points to a more complex accretion disk structure than current disk models assume. Knigge et al. (1998) discussed several ways in which to bring model continuum spectra in closer agreement with the observed spectrum in UX UMa. One possibility, first discussed by Long et al. (1994) with respect to discrepant disk model fits to the spectrum of the NL, IX Vel, is that the hottest, inner annuli of the disk are not present, causing the disk spectrum to be less blue than predicted by a standard disk model. The presence of 29 s oscillations in the optical and UV light in UX UMa is an inner disk phenomenon and may be indicative of disrupted accretion at the innermost annuli (Knigge et al., 1998b), but the oscillations are not always present and we do not detect them our observations. Another way to bring model spectra into agreement with observed spectra is to posit a second continuum source: Knigge et al. (1998) showed that the addition of optically thin recombination emission can flatten both the slope of the continuum from red to blue and fill in the Balmer jump. The optically thin continuum emission may originate from the accretion disk chromosphere; further modeling will be needed to determine if this picture is consistent with theoretical understanding of the properties of the disk-wind transition region.
The WD may also be a significant source of UV continuum emission. If so, its presence will worsen the discrepancy between the models and the observed continuum in UX UMa (Knigge et al., 1998). Baptista et al. (1995) concluded from their analysis of UV light curves that the WD is seen in the UV. They identified a signal in the derivative of the eclipse light curve from which they determined contact points for the WD eclipse ingress and egress. They also determined the flux of the WD at 1600 Å, 4.8 mJy (ergs cm-2 s-1 Å-1), which was 25% of the continuum flux at the time of their observation. From their identification of the WD in the UV eclipse and a distance estimate of 345 pc obtained from their optical and UV eclipse maps, Baptista et al. (1995) determined the WD diameter and a temperature: 52,000 K if the full WD is visible, or 70,000 K if the lower hemisphere of the WD is obscured by the disk. They combined their measure of the duration of WD eclipse with an empirical ZAMS mass-radius relation and limits on to determine the binary parameters for UX UMa, including the mass ratio, inclination, binary separation, and masses and radial velocities of the primary and the secondary. Their derived parameters have become the standard adopted values for UX UMa.
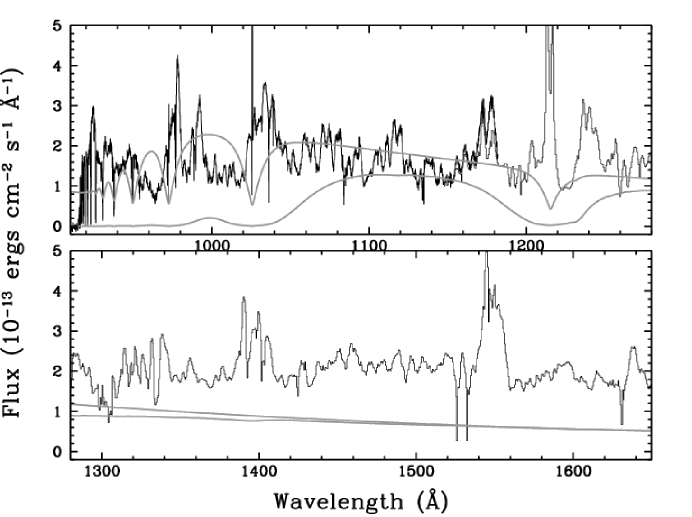
A simple extension of the spectrum of a WD with the flux and temperature found by Baptista et al. (1995) to FUV wavelengths indicates a problem with their analysis, however. This is illustrated in Figure 9, in which we compare model WD spectra to the 2001 FUV and (for reference) the 1996 November UV spectra of UX UMa. The DA WD models shown were created using TLUSTY and SYNSPEC (Hubeny, 1988; Hubeny, Lanz, & Jeffery, 1994; Hubeny & Lanz, 1995), and have . A WD with a 1600 Å flux of 4.8 mJy (ergs cm-2 s-1 Å-1) and a temperature of 52,000 K exceeds the observed flux at nearly every wavelength in the FUV; only in regions of strong FUV line emission does the model even fall below the observed flux. At its peak near 1000 Å, the model WD spectrum exceeds the observed flux by 60%. A 70,000 K WD (the Baptista et al. temperature if half the WD is obscured by the disk) will deviate even more severely from the observed FUV spectrum.
We examined the possibility that the WD flux found by Baptista et al. (1995) is correct but that their temperature is too high. The second WD model in Figure 9 shows that a cooler WD with a 4.8 mJy flux at 1600 Å is equally unlikely, however. The model shown is for a 20,000 K WD, which is the hottest WD of that UV flux consistent with the observed FUV spectrum. The problem with a cool WD with substantial UV flux is evident: its spectral shape is too variable with wavelength to be consistent with the observed spectrum. Moreover, such a WD would need to have a radius of – (for the 216 – 345 pc distance range to UX UMa) to emit the flux shown, substantially larger than the radius found by Baptista et al.
We conclude, therefore, that the WD in UX UMa is unlikely to have the high flux value determined by Baptista et al. A strong change in the WD flux over time is also unlikely. The 1600 Å flux in 1993 (the time of the Baptista et al. observations) is roughly the same as the flux in the 1996 HST spectrum. A comparison of the Baptista et al. WD model to that of the 1996 spectrum in Figure 9 shows that the model begins to overshoot the observed flux around 1200 Å, even before an accretion disk contribution to the FUV flux is taken into account. This inconsistency between the derived WD parameters and observed FUV spectra calls into question whether the features identified by Baptista et al. in the UV eclipse were actually the ingress and egress of the WD. The S/N of the UV eclipse light curve used by Baptista et al. to identify the WD was not high, and we consider their identification of the WD contact points in the derivative light curve as insecure. As all subsequent binary parameters found by Baptista et al. (1995) depend on the accurate identification of the WD in the eclipse, we also consider their determination of the WD temperature, WD radius, primary and secondary masses, and inclination unreliable. The derived parameters themselves indicate a problem: a mass ratio of 1, as found by Baptista et al., is theoretically inconsistent with stable mass transfer, for which there is ample and unambiguous evidence in UX UMa.
Although the WD does not have the large flux contribution found by Baptista et al., it may still be an important source of flux in the FUV. We do not see obvious WD eclipse features in the FUV high time resolution light curve, however. Figure 3 shows a slight notch in eclipse egress near phase 0.02, but that feature is only present in one of the two eclipses we observed (the individual eclipses in broadband FUV light can be seen in Figure 4). We can set limits on the WD contribution based on the spectrum of the eclipsed light, shown in the bottom panel of Figure 2. Since the WD is fully eclipsed, the flux in the eclipsed light spectrum gives an upper limit to the WD contribution. If we assume a standard WD mass , a corresponding radius of order cm (using the mass-radius relation from Nauenberg 1972), and a maximum distance of 345 pc, we find that the maximum temperature of the WD cannot exceed 40,000 K if the WD flux is to fall below the observed FUV eclipsed flux. At this temperature and projected area, the WD would be responsible for all of the eclipsed flux, which is unlikely, considering that most of the inner accretion disk and the chromosphere are also eclipsed, and no clear-cut WD eclipse features can be seen in the FUV light curve. If we assume therefore that the WD is only responsible for 50% of the FUV eclipsed flux, its temperature would drop to 25,000 K, and a 20% WD contribution would predict a cool WD of 20,000 K.
Theoretically, half of the energy of mass accretion is emitted in the boundary layer at or near the WD surface; for the typical accretion rates of UX UMa, this indicates that the surface of the WD (or some part thereof) should be quite hot (100,000 K). If the WD is hot, it must have a small emitting area to be consistent with the eclipsed FUV flux. If fully visible, a 50,000 K WD must have a radius equal to or smaller than , assuming the minimum distance to UX UMa of 216 pc. A 70,000 K WD would have to have a radius cm for its flux to be smaller than the observed FUV eclipsed flux. Both of these values correspond to a massive WD (M) if a standard WD mass-radius relation holds for for UX UMa. Observationally, a hot BL/WD has not been observed in UX UMa, whose X-ray luminosity ( ergs s-1 for a 340 pc distance) is too low to be consistent with the theoretically predicted BL emission (Wood, Naylor, & Marsh, 1995). This may indicate that we are not seeing the WD in UX UMa at all due to shrouding or occultation by the outer disk. Occultation of the WD has been demonstrated in the the NL DW UMa () when a low state in the disk exposed the normally hidden WD (Knigge et al., 2000). A clear detection of the eclipse of the WD would rule out the occultation hypothesis. Ideally, a search for the contact points of the WD would be conducted using multiple (at least 10) UV observations (with FUSE or HST) of the eclipse to decrease the effects of flickering and variability in the shape of the eclipse.
5 Conclusions
In this manuscript, we presented the observational characteristics of the first high resolution time series FUV spectroscopy of the eclipsing NL, UX UMa. Our main results are as follows:
1. The time-averaged FUV spectrum of UX UMa is dominated by line emission from numerous, overlapping transitions of H I, C III, N III, N IV, S III, S IV, S VI, Si III, Si IV and O VI, and additional unidentified, blended features. There is no region in the time-averaged spectrum in which the continuum alone can be discerned.
2. The emission lines have double-peaked profiles, with a narrow (FWHM 600 km s-1) central absorption reversal at the rest wavelength of each line. In the strongest lines — C III 977 Å, N III 992 Å, the N IV blend at 920–924 Å, and the doublet lines of O VI 1032,1038 Å — the red emission peak is enhanced relative to the blue peak.
3. The mid-eclipse spectrum is much less complex than the time-averaged spectrum. Most of the weaker spectral features are occulted in eclipse, exposing a flat continuum with the prominent emission lines superposed. The central absorption components of these lines are eclipsed. The spectrum of the eclipsed light is a mix of continuum and line emission, with the line features primarily in absorption. Several lines appear in emission only at mid-eclipse, when the strong absorption components of the lines are occulted. Archival HST spectra of UX UMa show similar morphology and behavior during eclipse.
4. Over the full FUV range (910–1182 Å), the mid-eclipse flux is 40% below the uneclipsed level. For regions of the spectrum away from the prominent emission lines, the mid-eclipse flux is on average 82% below the uneclipsed level. The eclipse depth does not change significantly at longer UV wavelengths: the mid-eclipse flux is 77% of the mean out of eclipse flux in the continuum-dominated regions of the HST (1149 – 1660 Å) spectra. The full width at half depth of the eclipse away from the prominent emission lines is roughly the same over the FUV and UV as well.
5. The high time resolution (1 s) light curve of the FUV observation shows strong flickering on time scales of several minutes. We do not detect a periodicity associated with the flickers and we do not detect the 29 s oscillations seen in some previous optical and UV observations. Spectra of the flickering peaks and minima show that the flickering occurs in regions near the plane of the disk (i.e., the regions that are eclipsed); the continuum fluctuates but the prominent emission lines do not flicker.
6. There is an orbital variation in the FUV light curve: the phase-binned flux around orbital phase 0.55 dips to a minimum 25% below the flux at other phases outside of eclipse. The light curve dip occurs at roughly the same orbital phase as but is shallower than the dip seen in HST observations of UX UMa. Spectra in the light curve dip, averaged over two orbits, show lower EWs for the line absorption features than spectra taken outside the dip. The same behavior was seen in the 1996 HST data.
7. We have detected a wavelength shift in the FUV spectrum phased on the orbital period. The amplitude of the shift is 70 km s-1 over broad regions of the FUV but may range as high as 140 – 200 km s-1 for the absorption components of the lines. The wavelength shifts lag the phasing of the photometric ephemeris by .
8. The WD parameters found by Baptista et al. (1995) from HST UV observations requires a FUV flux from the WD in excess of the observed FUV flux. A WD with a radius – (corresponding to a mass range 0.7 – 0.47 ) must be cooler than 40,000 K to remain below the observed FUV flux. Alternatively, the WD can be hotter but smaller in radius.
9. A curve of growth analysis of interstellar absorption lines in the FUV spectrum of UX UMa (see Appendix A) gives a range of for the column density along the line of sight to UX UMa.


Appendix A A Curve of Growth Analysis of the Interstellar Lines in the Spectrum of UX UMa
The time-averaged spectrum of UX UMa shows narrow interstellar (IS) absorption lines. Identified lines and their EWs are given in Table 2. The EWs of the lines are measured averages from time-averaged spectra of each of the four optical channels, giving two or four measurements of each line, depending on the wavelength region. The IS lines are from H I and metals; there is no molecular hydrogen absorption in the spectrum. The lack of H2 absorption is somewhat unusual since most FUSE spectra, especially for targets outside the local ISM, show interstellar H2, and distance estimates place UX UMa at least 216 pc away, and probably closer to 345 pc away (see Baptista et al. 1995 and sources therein). Non-local sight lines without molecular hydrogen absorption do exist, however (see Shull et al. 2000, for example), and UX UMa lies on a sight line directed out of the galactic plane (, ).
At least two distinct velocity components contribute to interstellar absorption along the line of sight to UX UMa. The IS H I lines have FWHM 0.36 Å, about twice that seen in the spectra of nearby CVs observed by FUSE (Froning et al. 2001; Long et al. 2002, in preparation). The strong, ionized metal lines — C III 977 Å the blend of N III 989.8 Å and Si III 989.9 Å, C II 1036 Å, and N II Å — have two components, one near zero velocity and a second at a velocity of -60 km s-1 (the resolution element in the individual channel spectra is 25 km s-1). We examined archival STIS high-resolution (R = 0.075 Å) spectra in the vicinity of C IV 1548,1552 Å (the spectra are unpublished). The interstellar component of the nearby Si II 1527.71 Å line also shows two absorption components separated by 60 km s-1. The IS EWs given in Table 2 for the FUSE spectra are integrated over the full IS absorption profile of each line.
A measure of the absorbing column is of general interest for analysis of UX UMa, particularly for X-ray and EUV observations, so we undertook a determination of the hydrogen column density along the line of sight to UX UMa using a curve of growth analysis. The higher order Lyman series lines of H I cannot be used to directly determine because they are all saturated. Instead, we used measurements of unblended O I and N I IS lines and assumed standard IS abundances relative to hydrogen for these species (see Mauche, Raymond & Córdova 1988 and Froning et al. 2001 for other applications of this method). The gas-phase interstellar abundances of oxygen and nitrogen have been well determined (Meyer et al., 1997, 1998) and are reliable tracers of hydrogen within several hundred parsecs of the sun (but see Moos et al. 2002 concerning nitrogen, which may be less reliable than oxygen as a tracer of hydrogen in the LISM).
Unfortunately, none of the measured metal lines are completely optically thin, so a direct measurement of the column density independent of the broadening parameter governing the line widths is not possible. The metals also cluster in a small range of optical depths and do not tightly constrain the column density. The best fit to the O I and N I line EWs gives cm-2 and = 4.5 km s-1 for the broadening parameter ( with 12 degrees of freedom). The best fit for O I alone gives the same result. Fits within the 95% confidence interval for (assuming Gaussian statistics) can be obtained for down to cm-2 ( km s-1). The fit deviates more rapidly from the data points for larger column densities as the growth curve becomes too flat to match the slope in the observed points, leading to an upper estimate of the column density (for a 95% confidence interval) of cm-2 ( km s-1). The resulting range for the column density for the line of sight to UX UMa is . The best fit and the upper and lower statistical limits are shown in Figure 10.
The curve of growth analysis assumes a single cloud with a single broadening parameter along the line of sight. The broad widths and large EWs of the IS H I lines show that multiple clouds must contribute to absorption in neutral hydrogen. If placed on the curve of growth, the H I lines are described by a broadening parameter of 24 km s-1. This value is implausibly large — if dominated by thermal broadening, = 24 km s-1 implies a thermal temperature of 34,600 K! The growth curve over-estimates the broadening parameter in H I with a single cloud; two or more clouds with offset velocities will have smaller, more physical, broadening parameters in each cloud and be consistent with observed EWs. The more pertinent question concerns the reliability of the column density derived above, based on O I and N I line measurements. In the absence of high resolution spectroscopy or complicated modeling of the sight line to UX UMa beyond the scope of this manuscript, we cannot know the number and parameters of IS absorption components along the sight line, and any number of scenarios could be devised to make the true H I column density larger or smaller than the range indicated by the curve of growth. There is reason to believe that the column density range given above is a reasonable estimation for the line of sight to UX UMa, however. Jenkins (1986) demonstrated that the curve of growth method can give column densities close to the true value even when multiple components with well-separated or partially overlapping velocities contribute to the absorption. This is true even when individual components are very optically thick, as long as the distribution of cloud parameters is smooth and no single or few highly saturated components dominate the absorption. There is no evidence from the IS spectrum of UX UMa that any divergent component dominates the absorption, so we conclude that, given the current data, the range of is the best estimate for the column density along the line of sight to UX UMa.
References
- Baptista et al. (1998) Baptista, R., Horne, K., Wade, R. A., Hubeny, I., Long, K. S., & Rutten, R. G. M. 1998, MNRAS, 298, 1079
- Baptista et al. (1995) Baptista, R., Horne, K., Hilditch, R. W., Mason, K. O., & Drew, J. E. 1995, ApJ, 448, 395
- Córdova & Mason (1982) Córdova, F. A. & Mason, K. O. 1982, ApJ, 260, 716
- Froning et al. (2001) Froning, C. S., Long, K. S., Drew, J. E., Knigge, C., & Proga, D. 2001, ApJ, 562, 963
- Heap et al. (1978) Heap, S. R., Boggess, A., Holm, A., Klinglesmith, D. A., Sparks, W., West, D., Wu, C. C., Boksenberg, A., Willis, A. & Wilson, R. 1978, Nature, 275, 385
- Holm, Panek & Schiffer (1982) Holm, A. V., Panek, R. J. & Schiffer, F. H., III 1982, ApJL, 252, L35
- Horne (1993) Horne, K. 1993, in Accretion Disks in Compact Stellar Systems, ed. J. C. Wheeler, Singapore: World Scientific Publishing Co. Pte. Ltd., 117
- Hubeny (1988) Hubeny, I. 1988, Comput. Phys. Commun., 52, 103
- Hubeny & Lanz (1995) Hubeny, I. & Lanz, T. 1995, ApJ, 439, 875
- Hubeny, Lanz, & Jeffery (1994) Hubeny, I., Lanz, T., & Jeffery, C. S. 1994, in Newsletter on Analysis of Astronomical Spectra (St. Andrews: St. Andrews Univ.), 20, 30
- Jenkins et al. (2000) Jenkins, E. B., et al. 2000, ApJL, 538, L81
- Jenkins (1986) Jenkins, E. B. 1986, ApJ, 304, 739
- Knigge et al. (2000) Knigge, C., Long, K. S., Hoard, D. W., Szkody, P., & Dhillon, V. S. 2000, ApJ, 539, L49
- Knigge et al. (1998b) Knigge, C., Drake, N., Long, K. S., Wade, R. A., Horne, K., & Baptista, R. 1998b, ApJ, 499, 429
- Knigge et al. (1998) Knigge, C., Long, K. S., Wade, R. A., Baptista, R., Horne, K., Hubeny, I., & Rutten, R. G. M. 1998, ApJ, 499, 414
- Knigge & Drew (1997) Knigge, C. & Drew, J. E. 1997, ApJ, 486,445
- Long et al. (1994) Long, K. S., Wade, R. A., Blair, W. P., Davidsen, A. F., & Hubeny, I. 1994, ApJ, 426, 704
- Mason, Drew, & Knigge (1997) Mason, K. O., Drew, J. E., & Knigge, C. 1997, MNRAS, 290, L23
- Mason et al. (1995) Mason, K. O., Drew, J. E., Córdova, F. A., Horne, K., Hilditch, R., Knigge, C., Lanz, T., & Meylan, T. 1995, MNRAS, 274, 271
- Mauche et al. (1994) Mauche, C. W., et al. 1994, ApJ, 424, 347
- Mauche, Raymond & Cordova (1988) Mauche, C. W., Raymond, J. C. & Cordova, F. A. 1988, ApJ, 335, 829
- Meyer et al. (1998) Meyer, D. M., Jura, M. & Cardelli, J. A. 1998, ApJ, 493, 222
- Meyer et al. (1997) Meyer, D. M., Cardelli, J. A. & Sofia, U. J. 1997, ApJ, 490, L103
- Moos et al. (2002) Moos, H. W., et al. 2002, ApJS, 140, 3
- Moos et al. (2000) Moos, H. W., et al. 2000, ApJ, 538, L1
- Morton (1991) Morton, D. C. 1991, ApJS, 77, 119
- Nauenberg (1972) Nauenberg, M. 1972, ApJ, 175, 417
- Proga, Stone & Drew (1999) Proga, D., Stone, J. M. & Drew, J. E. 1999, MNRAS, 310, 476
- Proga, Stone & Drew (1998) Proga, D., Stone, J. M. & Drew, J. E. 1998, MNRAS, 295, 595
- Robinson & Nather (1974) Robinson, E. L. & Nather, R. E. 1974, ApJ, 190, 637
- Rutten et al. (1992) Rutten, R. G. M., van Paradijs, J., & Tinbergen, J. 1992, A&A, 260, 213
- Sahnow et al. (2000) Sahnow, D. J., et al. 2000, ApJ, 538, L73
- Schlegel, Honeycutt, & Kaitchuck (1983) Schlegel, A. M., Honeycutt, R. K., & Kaitchuck, R. H. 1983, ApJS, 53, 397
- Shafter (1984) Shafter, A. W. 1984, AJ, 89, 155
- Shull et al. (2000) Shull, J. M., et al. 2000, ApJ, 538, L73
- Smak (1994) Smak, J. 1994, AcA, 44, 59
- Warner & Nather (1972) Warner, B. & Nather, R. E. 1972, MNRAS, 159, 429
- Wood, Naylor, & Marsh (1995) Wood, J. A., Naylor, T., & Marsh, T. R. 1995, MNRAS, 274, 31
| Observation | Date (UT) | Start (UT) | End (UT) | tobs (s) | ||
|---|---|---|---|---|---|---|
| 1 | 2001 March 23 | 22:42:36 | 0.27 | 13:39:55 | 3.62aaEach observation was acquired over about three binary orbits. | 20,038 |
| 2 | 2001 March 24 | 15:20:02 | 0.80 | 02:59:41 | 3.35aaEach observation was acquired over about three binary orbits. | 19,814 |
| Species | aaWavelengths and oscillator strengths are taken from Morton (1991). The oscillator strengths of some lines have been updated by D. C. Morton since the time of the previous publication; these were obtained from Jenkins et al. (2000). | aaWavelengths and oscillator strengths are taken from Morton (1991). The oscillator strengths of some lines have been updated by D. C. Morton since the time of the previous publication; these were obtained from Jenkins et al. (2000). | EW |
|---|---|---|---|
| (Å) | (Å) | ||
| H i | 915.329 | 0.000385 | 0.3908 |
| H i | 915.824 | 0.000468 | 0.3901 |
| H i | 916.429 | 0.000577 | 0.4184 |
| H i | 917.181 | 0.0007226 | 0.4226 |
| H i | 918.129 | 0.0009213 | 0.4346 |
| H i | 919.351 | 0.00120 | 0.4215 |
| H i | 920.963 | 0.001605 | 0.4290 |
| H i | 923.150 | 0.002216 | 0.4125 |
| O i | 924.950 | 0.001540 | 0.0473 |
| H i | 926.226 | 0.003183 | 0.426 |
| O i | 929.517 | 0.002295 | 0.0544 |
| H i | 930.748 | 0.004816 | 0.4600 |
| O i | 936.630 | 0.003650 | 0.0765 |
| H i | 937.803 | 0.007804 | 0.4451 |
| O i | 948.686 | 0.005420 | 0.0606 |
| H i | 949.743 | 0.01394 | 0.4349 |
| O i | 950.885 | 0.001570 | 0.0592 |
| N i | 953.415 | 0.01314 | 0.0619 |
| N i | 953.655 | 0.02492 | 0.0608 |
| N i | 953.970 | 0.03479 | 0.1231 |
| N i | 963.990 | 0.0148 | 0.0534 |
| N i | 964.626 | 0.0094 | 0.0607 |
| N i | 965.041 | 0.00675 | 0.0676 |
| O i | 971.738 | 0.01367 | 0.0729 |
| H i | 972.537 | 0.0290 | 0.3131bbLine is contaminated by terrestrial airglow. |
| O i | 976.448 | 0.003310 | 0.0700 |
| C iii | 977.020 | 0.7620 | 0.2482 |
| O i | 988.578 | 0.000553 | 0.2021 |
| O i | 988.655 | 0.0083 | ccLine is blended with the previous transition. |
| O i | 988.773 | 0.04650 | ccLine is blended with the previous transition. |
| N iii | 989.799 | 0.1066 | 0.1892 |
| Si ii | 989.873 | 0.1330 | ccLine is blended with the previous transition. |
| H i | 1025.722 | 0.0791 | bbLine is contaminated by terrestrial airglow. |
| O i | 1025.762 | 0.01705 | b,cb,cfootnotemark: |
| C ii | 1036.337 | 0.1231 | 0.2602 |
| O i | 1039.230 | 0.009200 | 0.0760 |
| Ar i | 1048.220 | 0.26275 | 0.0404 |
| Ar i | 1066.660 | 0.06652 | 0.0236 |
| N ii | 1083.990 | 0.1031 | 0.2357 |
| N i | 1134.165 | 0.01342 | 0.0692 |
| N i | 1134.415 | 0.02683 | 0.085 |
| N i | 1134.980 | 0.04023 | 0.1102 |
| Species | EW | FWHM | FWZI | ||
|---|---|---|---|---|---|
| (Å) | (Å) | (Å) | (km s-1) | (km s-1) | |
| N iv | 923.2aaThis feature is a blend of multiple transitions of the same ion. The laboratory wavelength given is for the transition with the largest oscillator strength in the blend. | 924.5 | bbMeasurement uncertain due to line blending or the detector edge. | bbMeasurement uncertain due to line blending or the detector edge. | bbMeasurement uncertain due to line blending or the detector edge. |
| P iv | 950.7 | 950.0 | -50 | 2100 | 2900 |
| C iii | 977.0 | 976.7 | -90 | 2600 | 4900 |
| N iii | 989.8aaThis feature is a blend of multiple transitions of the same ion. The laboratory wavelength given is for the transition with the largest oscillator strength in the blend. | 992.1 | -69 | 2550 | 5300 |
| S iii | 1012.5 | 1012.8 | -30 | 3400 | 5300bbMeasurement uncertain due to line blending or the detector edge. |
| H i | 1025.7 | 1025.0 | -25 | 1600 | 4100bbMeasurement uncertain due to line blending or the detector edge. |
| O vi | 1031.9,1037.62 | 1034.4 | -160 | 3300 | 5800 |
| S iv | 1062.7 | 1062.9 | -58 | 2050 | 4900 |
| S iv | 1073.0 | 1073.2 | -58 | 2200 | 4750 |
| N ii/He ii | 1085.0 | 1085.1 | -19 | 1750 | 3700bbMeasurement uncertain due to line blending or the detector edge. |
| Si iii | 1108.4aaThis feature is a blend of multiple transitions of the same ion. The laboratory wavelength given is for the transition with the largest oscillator strength in the blend. | 1110.9 | -113ccEquivalent width for this line and the following together. | 2700 | 5500bbMeasurement uncertain due to line blending or the detector edge. |
| Si iv | 1122.5,1128.3 | 1124.8 | 3600 | 6000bbMeasurement uncertain due to line blending or the detector edge. | |
| ?? | 1142.7 | -61.2 | 2300 | 5200 | |
| C iii | 1175.3aaThis feature is a blend of multiple transitions of the same ion. The laboratory wavelength given is for the transition with the largest oscillator strength in the blend. | 1176.0 | -88.0 | 1950 | 4500bbMeasurement uncertain due to line blending or the detector edge. |