X-Ray and Optical Observations of XTE J0052-723 a Transient Be/X-Ray Pulsar in the Small Magellanic Cloud
Abstract
On December 27th 2000 during our regular SMC monitoring program with Rossi X-ray Timing Explorer () strong pulsations were detected with a period of 4.78 seconds. Subsequent slew observations performed on Jan 9th and 13th across the field of view allowed localisation of the pulsar’s position to RA: 0h52m17s, Dec: 721951 (J2000). The outburst continued until Jan 24th, 7 PCA observations were obtained during this period, yielding a maximum X-ray luminosity 1038 ergs/s. Following calculation of the pulsar position, optical observations of the error box were made on Jan 16th 2001 with the 1m telescope of the South African Astronomical Observatory (SAAO) while the source was still in X-ray outburst. Candidate Be stars identified from their photometric colours were subsequently observed with the SAAO 1.9m on Nov 7th 2001 to obtain spectra. Only one of the photometrically identified stars [MA93]537 showed prominent H emission, with a double peaked line-profile (EW= -43.30.7Å, separation velocity=20015 km/s) confirming the presence of a substantial circumstellar disk.
keywords:
stars - X-rays: binaries: pulsars: SMC1 Introduction
High Mass X-ray Binaries (HMXBs) are traditionally divided on the basis of the nature of the optical counterpart, into Be and supergiant binary systems. A recent survey of the literature reveals that of the 96 proposed massive X-ray binary pulsar systems, 67% of the identified systems fall within the Be/X-ray group of binaries [Coe 2000]. In the Small Magellanic Cloud (SMC), almost all of the systems identified so far (except SMC X-1, a B0I Supergiant) are believed to be of this type [Haberl & Sasaki 2000]. The orbit of the Be star and the compact object, a neutron star, is generally wide and eccentric. The optical star exhibits H line emission and continuum free-free emission (revealed as excess flux in the IR) from a disk of circumstellar gas. The Be star disk phenomenon is a consequence of these stars’ rapid rotation, which is typically 60% of breakup velocity [Porter 1996] Most of the Be/X-ray sources are transient in the emission of X-rays due to a combination of orbital motion and timescales for changes in the Be star disk. X-ray outbursts appear to fall into two classes on the basis of luminosity and periodicity: So-called ’normal’ outbursts reach 1037 ergs/s and are associated with periastron passage of the neutron star through the Be star’s circumstellar disk. Giant outbursts may reach over an order of magnitude brighter and occur sporadically, uncorrelated with the orbital phase of the system. See for example Negueruela [Negueruela 1998] for a review.
The X-ray pulsar population of the SMC is far greater than expected on the basis of the its size. Although only 1/50 the mass of the Milky Way, the SMC contains at least 1/3 as many HMXBs, i.e. 24 known SMC pulsars rather than the expected 1. Given the expected lifetime of a Be/X-ray binary is 1My [van den Heuvel 1983], the existence of so many implies they all formed at about the same time. In the standard evolutionary scenario of van den Heuvel [van den Heuvel 1983] 15 My elapses between formation of a massive binary and its transition to an HMXB. The exact nature of the event which triggered star formation in the SMC 15-20 My ago is unclear, however there are important clues from dynamical simulations and recent photometric & radio surveys. Simulations of tidal interactions between the Magellanic clouds and Milky Way over the past 2 Gy by Gardiner & Noguchi [Gardiner & Noguchi 1996] indicate that the Clouds have experienced two close encounters, 1.5 & 0.2 Gy ago. During the most recent interaction, the clouds passed within 14 kpc of each other and the total tidal force exerted on the SMC rose by a factor of 30. Subsequent extension of this model to include star formation (Yoshizawa & Noguchi 1999, Gardiner 1999) appears to predict a time-lag between the tidal disruption and resulting star formation rate, which may only be peaking today. Observational evidence shows that the SMC consists of two distinct stellar populations [Zaritsky et al. 2000]. The older (pre LMC encounter) population shows a smooth, spheroidal distribution. In contrast, the main sequence population is highly irregular, with the very youngest stars concentrated almost entirely in the ’Bar’ and ’Wing’ regions [Maragoudaki et al. 2001]. These are also the regions in which the majority of X-ray pulsars have been found. There are still inconsistencies in this overall picture which point to the influence of hydrodynamic processes [Li & Thronson 1999], indeed the complex structure of the ISM shows clear evidence of having been sculpted by supernovae and winds from massive stars. The radio survey of Stanimirovic [Stanimirovic et al. 1997] reveals that the large-scale structure of giant HI shells in the SMC shows evidence of hierarchical arrangement. Smaller shells are distributed around the larger ones, suggesting that star formation has proceeded in an impulsively triggered sequence, rather than simultaneously due to large-scale gravitational collapse.
A detailed investigation of the luminosity and period distributions and long-term behaviour of X-ray pulsar systems in the SMC is underway. The low extinction and unobstructed line of sight to the SMC enable accurate measurements of X-ray luminosity and useful observations of the optical counterparts with 1-2m telescopes. Since the distance to the SMC is significantly greater than its ’depth’ all of the objects in the SMC can be considered to lie at an equal distance for the purposes of luminosity calculations.
The source that is the subject of this paper, XTE J0052-723 [Corbet et al. 2001] is thought to be a new Be/X-ray binary system. It was detected in the course of our regular pulsar search program of the SMC, which has been running since January 1999, previously described by Laycock et al. [Laycock et al. 2002]. At the time of XTE J0052-723’s discovery our observing strategy employed approximately weekly observations with a duration of 5 ksec centred on RA: 0h50m DEC: -736, in the south eastern arm of the SMC. From this position the PCA’s large 2°wide field of view encompasses the positions of 16 of the 24 confirmed X-ray pulsars in the SMC. The range of known pulse periods spans 0.716 - 755 seconds.
2 X-ray Observations
2.1 RXTE PCA
The RXTE Proportional Counter Array (PCA) [Jahoda et al. 1996] consists of 5 collimated proportional counter units (PCU), each with a collecting area of 1300 cm2. The field of view of the PCA is approximately 2°FWZI with a triangular collimator response as a function of off-axis viewing angle. Each PCU has 3 xenon filled detector-anode layers, and an additional upper layer filled with propane. The propane layer is operated as a veto detector in order to reduce particle background. In certain data modes (e.g. Good Xenon and Standard 2) separation of data by detector is maintained in the telemetry, allowing data from each layer and PCU to be analysed independently. The highest timing and spectral resolution are obtained in Good Xenon mode, in which the energy and arrival time of of every detector event is registered. The timing resolution is 1s with an absolute accuracy limited by the spacecraft clock to 8s, photon energy is recorded by a 256 channel pulse-height discriminator with a resolution of 18% at 6 keV. Standard 2 mode provides time-binned data with 16s resolution and 129 energy channels. Both of these data modes were used in our analysis. The signal-to-noise for low energy X-rays 225 keV is at its maximum in the uppermost xenon layer (layer 1), while the full (nominal) 2-60 keV energy range of the PCA is achieved when data from all 3 layers are combined.
2.2 Monitoring and Detection
In our SMC monitoring program we adopt an automated reduction/analysis pipeline that is optimised for pulsar detection. Good Xenon event mode data from the PCA [Jahoda et al. 1996] are used to construct lightcurves at 10ms timing resolution. In order to maximise signal to noise, only events from the top anode layer of the PCA are included. We use the energy range 3-10 keV in order to cover the peak emission expected for X-ray pulsars. Few filtering criteria are applied, in order to preserve our time coverage and hence temporal resolution. Background count rates are estimated using the L7 PCA faint background models. The count-rates are then normalised to Counts PCU-1 s-1 and bin times corrected to the solar-system barycentre.
For the detailed study of the new pulsar, additional reduction steps were required to eliminate systematic uncertainties introduced by the defective PCU 0. Since the loss in May 2000 of the propane layer on PCU 0, the background event rate in this detector no longer matches the L7 background model. Additionally we found significant differences between count rates and spectra obtained from PCU 0 and the rest of the PCA and consequently excluded PCU 0 data from our analysis. The active PCUs in each observation are indicated in Table 1, taking , as indicative of the sensitivity of each observation, the range of relative sensitivity spans a factor 1.7 between observations 4 and 7. Data obtained within 30 minutes following passage of through the South Atlantic Anomaly were excluded, as were data taken during any time the particle background exceeded 0.1 electrons/sec in PCU 2. These conditions were applied retrospectively to all observations within 3 weeks either side of the outburst of XTE J0052-723 in order to obtain an accurate mean count rate with which to estimate the contribution from interfering sources in the field of view.
| Obs. | Date | Observation | Active PCUs |
|---|---|---|---|
| 1 | 27/12/00 | 3.85ksec stare | 0124 |
| 2 | 03/01/01 | 5.12ksec stare | 023 |
| 3 | 09/01/01 | slews | 0234 |
| 4 | 09/01/01 | 2.91ksec stare | 0234 |
| 5 | 13/01/01 | slews | 01234 |
| 6 | 18/01/01 | 4.15ksec stare | 01234 |
| 7 | 24/01/01 | 5.12ksec stare | 01234 |
2.3 Source Location
The position of the new pulsar was determined by slew observations on Jan 9th and 13th 2001 (see Table 1). Orthogonal slews were made in RA and DEC over slightly different position on each occasion, with the second set of slews used to further refine the source position determined from the first. As the source moves through the collimator field of view, it samples different values of the collimator response function, which modulates the detected count rate. Given a trial position and intensity for the source, a model light curve can be constructed using the response function, and compared to the observed light curve. The position and intensity are then varied iteratively using least squares fitting until the best-fit parameters are obtained. The 99% confidence contour determined for XTE J0052-723 is a rectangular region (J2000).
2.4 Timing Analysis
The 10ms resolution lightcurves obtained from the 5 pointed observations were analysed using the Lomb-Scargle periodogram [Scargle 1982] at a resolution of 0.0001Hz (2.5ms or 0.05% at 5s). The Lomb-Scargle method was used to calculate the power density spectrum (PDS) owing to gaps in the data caused by SAA passage, earth occultation and slews. Additionally this procedure is suited to the uneven time sampling introduced by barycentre correction of the lightcurve bin-times. The fast Lomb-Scargle code of Press & Rybicki [Press & Rybicki 1989] was implemented in double precision.
Owing to the highly non-sinusoidal nature of the pulse profiles, the periods found in the PDS were investigated using Phase Dispersion Minimization (PDM) [Stellingwerf 1978]. The lightcurves were folded on a series of trial periods centred on the period of interest, at each trial period the folded data were binned in 10 (non overlapping) phase intervals to create a template. The variance of points belonging to each bin was then combined with the overall variance in the lightcurve to create a measure of the goodness-of-fit between the derived template and the lightcurve. This approach has an advantage over Fourier techniques that use an assumed fitting function. We found that PDM detected the 4.782s fundamental pulse period as the strongest periodogram feature even in observations where the PDS showed only the P/2 harmonic. Resulting pulse periods and their errors estimated from the PDM are given in Table 2. In Figure 8 the 4.78s feature is displayed for each observation in order to assess the evidence for changes in the pulse period. For this plot we show the PDM-statistic calculated for trial periods in the range 4.77 to 4.79s which is appropriate for the width of the feature.
| Obs. | Pulse period | Pulse amplitude | Mean flux |
|---|---|---|---|
| number | seconds | Ct PCU-1s-1 | Ct PCU-1s-1 |
| 1 | 4.7817 0.0001 | 2.58 0.71 | 11.4 |
| 2 | 4.7818 0.0001 | 3.83 0.69 | 11.8 |
| 4 | 4.782 0.001 | 3.88 0.79 | 8.6 |
| 6 | 4.7820 0.0001 | 2.88 0.42 | 7.5 |
| 7 | 4.7823 0.0001 | 2.04 0.51 | 5.6 |
Values are corrected for collimator response and interfering source contribution (0.9Ct PCU-1s-1). Appropriate collimator response is 0.21 for obs 1,2,4,7 & 0.99 for obs 6. See Section 2.4 for explanation. note: timing analysis not applied to slew observations 3 & 5
Having established the pulse period in each observation, the lightcurves were folded to produce pulse profiles. From these profiles peak-peak pulse amplitudes were obtained in units of Counts PCU-1s-1 Following determination of the source position (Section 2.1) the epoch-folded fluxes from each observation were corrected for collimator response due to their different pointing positions.

Although XTE J0052-723 was the only pulsar detected in these observations, there is expected to be a non zero contribution to the X-ray flux due to other sources in the SMC. No pointings were made at the exact co-ordinates of the new pulsar after it had faded from view and so it is difficult to estimate this component. However observations were made at the standard monitoring position (see Section 2) before, during, and after the outburst. Our estimated value for the persistent background at this pointing was 0.9 Counts PCU-1s-1, which is consistent with the post outburst flux seen for 3 consecutive weeks after the end of the observed outburst. Observations immediately before the outburst show higher fluxes and pulsations at 46s and 173s which we attribute to the known X-ray pulsars 1WGA J0053.8-7226 [Singh et al. 1995] and AX J0051.6-7311 [Yokogawa et al. 2000]. Figure 2 shows the mean count rate as a function of time during this period. For all observations showing 4.78s pulsations the count rate has been corrected for the collimator response to the best-fit position and the 0.9 Counts PCU-1s-1 background contribution.

As an additional indicator of the outburst profile, the variation in pulsed-flux was investigated as it is independent of assumptions about the background. Figure 3 shows the pulse amplitudes given in Table 2 before and after correction for pointing offset (collimator response). The errors in these points are dominated by the propagation of errors in measured amplitude through the collimator response function.

Upper limits were estimated on the flux from XTE J0052-723 in the observation preceeding the first detection and following the last detection. The power in the Lomb-Scargle periodogram at the pulse period in these observations was converted into pulse amplitude and corrected for collimator response, giving values of 0.2 and 0.5 counts/PCU/s. Because the pre-outburst observation contained other pulsars (see above) the upper limit was also estimated by alternative means. Simulated data consisting of white noise plus a periodic modulation were sampled onto the window function of the actual observation and analysed as described in Section 2.4. The procedure was repeated, incrementally increasing the signal amplitude until positive detection occurred. Two different types of modulation were considered in order to investigate any effects of pulse profile on sensitivity. The upper limit for a sinewave plus white noise was 0.1 Counts PCU-1s-1 pulsed amplitude, rising to 0.3 Counts PCU-1s-1 for a template derived from the actual pulse profile seen in observation 6 (see Figure 1).
2.5 PCA X-ray Spectrum
The X-ray spectrum of XTE J0052-723 (Figure 4) was obtained in observation 6 with the PCA pointing directly at the best-fit position. All 5 PCUs were on during the first 2.5 ksec of this observation, the spectrum was extracted from the Good Xenon data for PCUs 1-4, PCU0 was excluded (see Section 2.2). Background subtraction was performed with the L7 model for faint sources. Spectra were not extracted for the other pointed observations in which XTE J0052-723 was 0.8°off axis.
Of the spectral models tested, the spectrum was well fitted by a power law with high energy cutoff (=1.77, =14 keV, =16 keV, =3.61022 cm-2) and by bremsstrahlung (kT=19.47 keV, =2.11022 cm-2) (DOF) for the two models was 1.13(38) and 0.92(40) respectively. A simple absorbed power law model gave a significantly worse and proved a poor representation of the high energy end of the spectrum, demonstrating the the existence of a high energy cut-off above about 15 keV. A blackbody model was not able to fit the data. The suitability of the cutoff powerlaw model for X-ray pulsars has been discussed by e.g. White, Swank & Holt [White et al. 1983]. The luminosity (cut-off power law) of XTE J0052-723 using DSMC=63 kpc [Groenewegen 2000] was found to be L5.31037 erg/s, L2.91037 erg/s. Assuming the fraction attributable to other sources (see Section 2.4) is around 12% (0.9 counts in 7.52 for this observation) these luminosities scale down to 4.7 and 2.3 for a total =71037erg/s.

We note that the parameters obtained for the high energy cut-off model were obtained by starting the fitting process at reasonable values as given by White, Swank & Holt [White et al. 1983]. If instead no assumptions were made, and all parameters set to unity, the fit converged to a lower but with a cut-off energy which is unusually low for an accreting pulsar (=6.4 keV, =27 keV). The value of 6.4 keV is strongly suggestive of the presence of an iron K line which has been observed in many pulsars (Nagase [Nagase 1989]). This possibility was investigated by adding a gaussian component to the model. The line energy was set initially at 6.4 keV but was fitted as a free parameter. (Best fitting line energy 6.3990.22 keV, width 1.40.8keV, EW=281 eV). This fit gave parameters consistent with our original result (, keV, keV, ) and is a slight improvement (DOF)=0.75(35). The SMC background contribution mentioned above, may also contribute to peculiarities in the spectral fitting.
3 Optical Observations
3.1 Photometry
In order to try and identify the counterpart, optical observations were made at SAAO with the 1m telescope on 16th January 2001 while the X-ray pulsar was in outburst. The STE4 CCD chip was used which gives a 55 arcminute field. The region of sky included the full area of the XTE 99% confidence region (Figure 5), and it was imaged in Johnson B,V,R and narrow-band H filters. Full field aperture photometry was performed on the images and B and V instrumental magnitudes were calibrated against a star in the field listed in the TYCHO2 catalogue [Hog et al. 2000]. The chosen calibration star was TYC 9138-1734-1. The resulting B and V magnitudes for the stars indicated are given in Table 3.

| Object | Bmag | Vmag | Jmag⋆ | Hmag⋆ | Kmag⋆ |
|---|---|---|---|---|---|
| A | 15.8 | 14.3 | |||
| B | 17.4 | 17.3 | |||
| 537 | 15.9 | 15.8 | 16.46 | 15.65 | 15.7 |
| AzV129 | 14.3 | 14.3 | 14.46 | 14.59 | 14.6 |
⋆Infrared magnitudes from NASA/IRSA catalogue.
The resulting magnitudes were then used to plot the colour-colour diagram: B-V versus R-H, shown in Figure 6. The calibrated (B-V) colour axis compares favourably with the colour-magnitude diagram for the SMC of Udalski et al. [Udalski et al. 1998]. These plots were used to identify candidates for an optical counterpart to the X-ray pulsar. The B-V colour provides a measure of effective stellar temperature, with B0-B2 objects (the typical counterparts to these systems) lying in the (B-V) = 00.2 region. The R-H value estimates the strength of the H emission line relative to the surrounding (red) continuum. For hot blue stars lying to the left of this plot, a relatively large R-H cannot be consistent with the stellar emission and implies the presence of a significant mass of cooler material radiating at longer wavelengths. This situation provides the photometric classification of a Be star [Jascheck & Jaschek 1990].
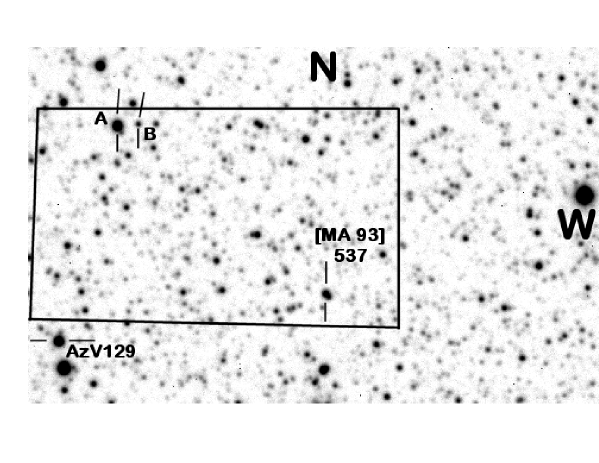
The R band image of the field obtained at SAAO is shown in Figure 5. The XTE 99% confidence error box is outlined and Be stars identified by the above procedure are indicated. Each candidate is cross-referenced to its position on the 2-colour diagram (Figure 6). Two candidate Be stars appear in the XTE error box, the brighter of the two is a known emission-line star [MA93]537 [Meyssonnier & Azzopardi 1993]. The one labelled Object B has a slightly more extreme R-H but is much fainter.
3.2 Spectroscopy
H spectra were taken on November 7th 2001 with the SAAO 1.9m, for four objects in the field. These were the two objects identified from the photometry, plus AzV129 (a 14th mag B1 star [Azzopardi & Vigneau 1978]) and object A which was in the slit with object B. Only [MA93]537 shows H in emission, with a strong double peaked line-profile shown in Figure 7. Such a double-peaked line implies that H emission comes from a circumstellar disk [Slettebak et al. 1992], the disk providing the reservoir of fuel to power the X-ray pulsar. The equivalent width was determined to be -43.3 0.7Åand the line was centred at 6566Å. The separation velocity of the peaks was found to be 200 15 km/s.

4 Discussion
The position of the H peak in [MA93]537 corresponds to a red shift of 137 km/s. The agreement of this value with the general recessional (red-shift) value for the SMC of 148 km/s confirms its membership of that body. The observed V magnitude of this object corresponds to a B0V-B1V star in the SMC, though the (B-V) colours are slightly too blue. However, close inspection of the image for [MA93]537 reveals it to be a double star with one object approximately 3-4 times brighter than the other in the R band. It is quite possible that the blend of the fainter star with the brighter one is affecting the colours in the manner observed. Notwithstanding this small effect, there can be little doubt that [MA93]537 must be the prime candidate for the optical counterpart to the X-ray source. Table 3 also lists archival infrared magnitudes which show a rising flux into the IR, it should be noted that these values are not from the same epoch as the SAAO photometry.
The maximum attained by XTE J0052-723 reached 1038erg/s as inferred from its luminosity in observation 6 and its peak 2-10 keV flux (observation 2). The outburst appears to have brightened rapidly from 8 1036erg/s (upper limit) to 1038erg/s within 6 days, and then declined slowly over the next month.
Using the relation of Bohlin et al. [Bohlin et al. 1978] the measured implies E(B-V)=3.55, the apparent colours of the proposed counterpart (Table 3) do not support this degree of reddening, which if in front of the star would imply B-V -3. Thus the large must be due to local material around the neutron star.
The pulse profile (Figure 1) is double peaked and rather asymmetric at all times. Timing analysis shows evidence for changes in pulse period between the observations. This is revealed in Figure 8 as an apparently continuous shift in the position of the 4.782s feature in the PDM periodogram during the 28 days spanned by our observations. The total period change is 6.410-4s giving a mean period derivative ( of 2.6510-10s/s.The direction of the effect is an apparent lengthening of the pulse period.

Since the distance to the SMC is known to within 10% we can estimate the likely contributions to pulse period variation, due to accretion torques and binary motion. The maximum possible spin derivative given the observed luminosity, was calculated using the standard model for accretion torque as described by, for example, Rappaport & Joss [Rappaport & Joss 1977].
Re-arranging for and solving for a 1.4M☉ neutron star of radius 15 km radiating 1038 erg/s and spinning once every 4.782 sec, gives a maximum spin-up rate of 1.5210-11 Hz/s. Since /= - we have =3.4910-10s/s. This is similar to the observed but of the opposite sign. We note that spin-down as well as spin-up has been seen for a number of X-ray pulsars e.g. Bildsten [Bildsten 1998], and that the spin-down rates may be similar to the spin-up rates.
If XTE J0052-723 is similar to other Be HMXBs then its orbital period may be expected from the diagram [Corbet 1986] to be 20 to 40 days, comparable with the duration of this outburst.
To estimate the possible contribution of orbital doppler shifts to the observed pulse period changes we made a simple estimate of the neutron star’s orbital velocity and compared this to the projected velocity implied by the observed change in pulse period. We assume a primary, orbital period of 30 days, circular orbit, negligible mass secondary. The orbital radius for such a system is 6.1107 km, and the orbital velocity is 147 km/s. If the correct optical counterpart is the Be star we have identified, then the inclination of the system must be fairly high to generate the double-peaked spectral line profile. Taking the maximum and minimum measured values for the pulse period as given in Table 2 implies a velocity shift of 38 km/s.
We therefore conclude that the observed variations in the pulse period may have contributions from both orbital doppler shifts and accretion torques. In order to measure the contributions of both of these effects, and to determine the orbital parameters of the system, more extensive pulse timing measurements are required.
5 Conclusions
XTE J0052-723 has been identified as a transient X-ray pulsar in the SMC. It was observed in X-ray outburst from 27/12/00 - 16/01/01. Non-detections before and after constrain the duration of the outburst to be 365days. The peak X-ray luminosity reached 1038ergs/s. An X-ray spectrum obtained during the decline of the outburst was equally well fitted by a cut-off powerlaw (=1.7, =15 keV) or bremsstrahlung model (=19.47 keV), both requiring a large amount of absorbing gas (cm-2) around the neutron star. A pulse-period derivative was detected, with an amplitude consistent with that expected for binary motion. The X-ray source position was localised by performing slews. Optical photometry was used to search for an optical counterpart during the X-ray outburst. Spectroscopy of selected candidates has identified the probable counterpart, which is a BOV-B1V SMC member, exhibiting a strong, double peaked H emission line (EW=-43.3Å, VSeparation=20015 km/s). Archival infrared magnitudes indicate an IR excess as expected for a Be star.
This discovery further increases the number of known HMXBs in this remarkable galaxy. It is becoming increasingly clear that the SMC contains an unusually high abundance of massive stars and the domination of the HMXB population by Be/X-ray binaries is intriguing. Our monitoring program continues to follow the outbursts of the SMC’s X-ray pulsars and results on the long term behaviour of a large fraction of that population will be published in the near future.
Acknowledgments
SGTL is in receipt of a PPARC studentship. This work has made use of the SIMBAD database, operated at CDS, Strasbourg, France. The optical observations were made at the South African Astronomical Observatory.
References
- [Azzopardi & Vigneau 1978] Azzopardi M., Vigneau J., 1978, A&AS, 50, 291
- [Bildsten 1998] Bildsten L., 1998, ”The Angular Momentum of Accreting Neutron Stars”, in ”Accretion Processes in Astrophysical Systems: Some Like it Hot!”, AIP Conference Proceedings 431, ed. S.S. Holt & T.R. Kallman, pp. 299-308
- [Bildsten et al. 1997] Bildsten L., Chakrabarty D., Chiu J., Finger M. H., Koh T., Nelson R. W., Prince T. A., Rubin B. C., Scott D. M., Stollberg M., Vaughan B. A., Wilson C. A., Wilson R. B. 1997, ApJS, 113, 367
- [Bohlin et al. 1978] Bohlin R. C., Savage B. D., Drake J. F., 1978, ApJ, 224, 132
- [Coe 2000] Coe M. J., 2000, in ”The Be Phenomenon in Early-Type Stars”, IAU Colloquium 175, ASP Conference Proceedings, Vol. 214, eds M. A. Smith and H. F. Henrichs. Astronomical Society of the Pacific, p.656
- [Corbet 1986] Corbet, R. H. D., 1986, MNRAS, 220, 1047
- [Corbet et al. 2001] Corbet R. H. D., Marshall F. E., Markwardt C. B., 2001, IAUC, 7562
- [Gardiner & Noguchi 1996] Gardiner L. T., Noguchi M., 1996, MNRAS, 278, 191
- [Gardiner 1999] Gardiner L. T., 1999, in ”New Views of the Magellanic Clouds”, IAU Symposium, Vol. 190, Y.-H. Chu, N.B. Suntzeff, J.E. Hesser & D.A. Bohlender, eds.
- [Groenewegen 2000] Groenewegen M. A. T., 2000, A&A, 363, 901
- [Haberl & Sasaki 2000] Haberl F., Sasaki M., 2000, A&A, 359, 573
- [Hog et al. 2000] Hog E., Fabricius C., Makarov V. V., Urban S., Corbin T., Wycoff G., Bastian U., Schwekendiek P., Wicenec A., 2000, A&A, 355, L27
- [Jahoda et al. 1996] Jahoda K., Swank J. H., Stark M. J., Strohmayer T., Zhang W., Morgan E. H., 1996, Proc.SPIE,2808,59
- [Jascheck & Jaschek 1990] Jaschek C., Jaschek M., 1990, The Classification of Stars, Cambridge University Press
- [Laycock et al. 2002] Laycock S., Corbet R. H. D., Perrodin D., Coe M. J., Marshall F. E., Markwardt C., 2002, A&A, in press, astro-ph/0201468
- [Li & Thronson 1999] Li P. S., Thronson H. A., 1999, in ”New Views of the Magellanic Clouds”, IAU Symposium, Vol. 190, Y.-H. Chu, N.B. Suntzeff, J.E. Hesser & D.A. Bohlender, eds.
- [Maragoudaki et al. 2001] Maragoudaki F., Kontizas M. Morgan D. H., Kontizas E., Dapergolas A., Livanou E., 2001, A&A, 379, 864
- [Meyssonnier & Azzopardi 1993] Meyssonnier N., & Azzopardi, M., 1993, A&AS, 102, 451
- [Nagase 1989] Nagase F., 1989, PASJ, 41, 1
- [Negueruela 1998] Negueruela I., 1998, A&A 338, 505
- [Porter 1996] Porter J., 1996, MNRAS, 280, L31
- [Press & Rybicki 1989] Press W. H., Rybicki G. B., 1989, ApJ, 338, 277
- [Press et al. 1993] Press W. H., Teukolsky S. A., Vetterling W. T., Flannery B. P., Numerical Recipies in Fortran 2nd Ed., 1993, Cambridge University Press
- [Rappaport & Joss 1977] Rappaport, S. & Joss, P. C. 1977, Nature, 266, 683
- [Scargle 1982] Scargle J. D., 1982, ApJ, 263, 835
- [Singh et al. 1995] Singh K. P., Barrett P., Schlegel E., White N. E., 1995, IAUC 6195
- [Slettebak et al. 1992] Slettebak A., Collins G. W., Truax R., 1992, ApJS, 81,335
- [Stanimirovic et al. 1997] Stanimirovic S., Staveley-Smith L., Dickey J. M., Sault R. J., Snowden S. L., 1999, MNRAS, 302, 417
- [Stellingwerf 1978] Stellingwerf R. F., 1978, ApJ, 224, 953
- [Udalski et al. 1998] Udalski A., Szymanski M., Kubiak M., Pietrzynski G., Wozniak P., Zebrun K., 1998, Acta Astron., 48, 147
- [van den Heuvel 1983] van den Heuvel E. P. J., 1983, In: Accretion Driven Stellar X-ray Sources, Lewin W. H. G. & van den Heuvel E. P. J., eds.
- [White et al. 1983] White, N. E, Swank, J. H., Holt, S. S., 1983, ApJ, 263, 277
- [Yokogawa et al. 2000] Yokogawa J., Torii K., Imanishi K., Koyama K., 2000, PASJ, 52, L37
- [Yoshizawa & Noguchi 1999] Yoshizawa A. M., Noguchi M., Galaxy Interactions at Low and High Redshift, IAU Symposium 186, Edited by J. E. Barnes & D. B. Sanders, 1999, p.60
- [Zaritsky et al. 2000] Zaritsky D., Harris J., Grebel E. K., Thompson I. B., 2000, ApJ, 534, L53