The Cosmic Microwave Background Anisotropy Power Spectrum measured by Archeops
We present a determination by the Archeops experiment of the angular power spectrum of the cosmic microwave background anisotropy in 16 bins over the multipole range . Archeops was conceived as a precursor of the Planck HFI instrument by using the same optical design and the same technology for the detectors and their cooling. Archeops is a balloon–borne instrument consisting of a 1.5 m aperture diameter telescope and an array of 21 photometers maintained at mK that are operating in 4 frequency bands centered at 143, 217, 353 and 545 GHz. The data were taken during the Arctic night of February 7, 2002 after the instrument was launched by CNES from Esrange base (Sweden). The entire data cover % of the sky. This first analysis was obtained with a small subset of the dataset using the most sensitive photometer in each CMB band (143 and 217 GHz) and 12.6% of the sky at galactic latitudes above 30 degrees where the foreground contamination is measured to be negligible. The large sky coverage and medium resolution (better than arcmin.) provide for the first time a high signal-to-noise ratio determination of the power spectrum over angular scales that include both the first acoustic peak and scales probed by COBE/DMR. With a binning of =7 to 25 the error bars are dominated by sample variance for below 200. A companion paper details the cosmological implications.
Key Words.:
Cosmic microwave background – Cosmology: observations – Submillimeter1 Introduction
Observations of the Cosmic Microwave Background (CMB) temperature anisotropies have provided answers to fundamental questions in cosmology. The observational determination of the CMB angular power spectrum has already led to important insights on the structure and evolution of the universe. Most notable are the conclusions that the geometry of space is essentially flat (Miller et al. 1999 ; de Bernardis et al. 2000 ; Hanany et al. 2000 ) and that the measurements are consistent with the inflationary paradigm (Netterfield et al. 2002 ; Lee et al. 2001 ; Halverson et al. 2002 ; Sievers et al. 2002 ; Rubiño-Martin et al. 2002 ). Since the first detection of CMB anisotropy with COBE/DMR (Smoot et al. 1992 ), a host of experiments have measured the spectrum down to sub–degree scales, but measurements at large angular scales remain difficult, due to the large sky coverage required to access these modes. This difficulty will be overcome by the future full–sky space missions MAP and Planck.
This paper presents the first results from Archeops, an experiment designed to obtain large sky coverage in a single balloon flight. A detailed description of the instrument inflight performance will be given in Benoît et al. (2002c); here we provide only essential information. Archeops111see http://www.archeops.org. is a balloon–borne experiment with a 1.5 m off–axis Gregorian telescope and a bolometric array of 21 photometers operating at frequency bands centered at 143 GHz (8 bolometers), 217 GHz (6), 353 GHz (63 polarized pairs) and 545 GHz (1). The focal plane is maintained at a temperature of mK using a 3He–4He dilution cryostat. Observations are carried out by turning the payload at 2 rpm producing circular scans at a fixed elevation of deg. Observations of a single night cover a large fraction of the sky as the circular scans drift across the sky due to the rotation of the Earth.
2 Observations and processing of the data
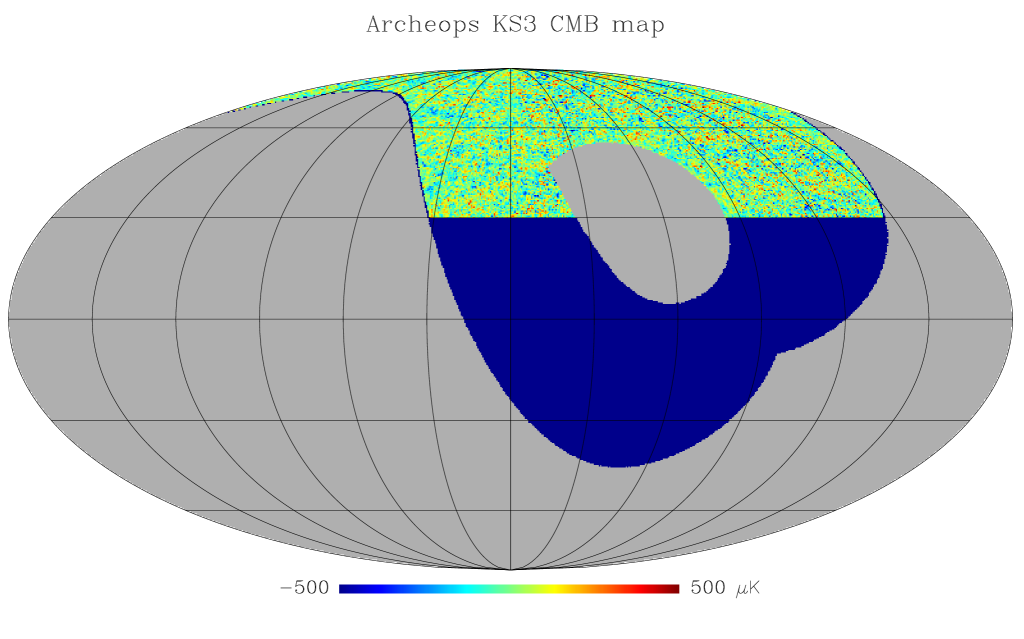
The experiment was launched on February 7, 2002 by the CNES222Centre National d’Études Spatiales, the French national space agency from the Swedish balloon base in Esrange, near Kiruna, Sweden, N, E. It reached a float altitude of km and landed 21.5 hours later in Siberia near Noril’sk, where it was recovered by a Franco–Russian team. The night–time scientific observations span 11.7 hours of integration from 15.3 UT to 3.0 UT the next day. Fig. 1 shows the Northern galactic part of the sky observed during the flight.
A detailed description of the data processing pipeline will be given in Benoît et al. (2002d). Pointing reconstruction, good to 1 arcmin., is performed using data from a bore–sight mounted optical star sensor aligned to each photometer using Jupiter observations. The raw Time Ordered Information (TOI), sampled at 153 Hz, are preprocessed to account for the readout electronics and response variations. Corrupted data (including glitches), representing less than 1.5%, are flagged. Low frequency drifts correlated to various templates (altitude, attitude, temperatures, CMB dipole) are removed from the data. To remove residual dust and atmospheric signal, the data are decorrelated with the high frequency photometers and a synthetic dust timeline (Schlegel et al. 1998 ).
The CMB dipole is the prime calibrator of the instrument. The absolute calibration error against the dipole measured by COBE/DMR (Fixsen et al. 1994 ) is estimated to be less than 4% (resp. 8%) in temperature at 143 GHz (resp. 217 GHz). Two other independent calibration methods, both with intrinsic uncertainty of , give responsivities relative to the dipole calibration at 143 (resp. 217 GHz) of (resp. %) on Jupiter and (resp. %) with COBE–FIRAS Galactic Plane emission.
The beam shapes of the photometers measured on Jupiter are moderately elliptical, having a ratio of the major to minor axis of 1.2 (resp. 1.5) at 143 GHz (resp. 217 GHz), and have an equivalent FWHM of 11 arcmin. (resp. 13). The error in beam size is less than 10%. The effective beam transfer function for each photometer, determined with simulations, is taken into account in the analysis and is in excellent agreement with analytical estimates (Fosalba et al. 2002 ).
3 Analysis
In this paper, we use data from only a single detector at each of the CMB frequencies, 143 and 217 GHz, with a sensitivity of 90 and 150 respectively. To avoid the necessity of detailed modelling of Galactic foregrounds, we restrict the sky coverage to , giving a total of 15 arcmin. pixels (HEALPIX nside = 256) covering 12.6% of the sky (see Fig. 1). To extract the CMB power spectrum, we use the MASTER analysis methodology (Hivon et al. 2002 ), which achieves speed by employing sub–optimal (but unbiased) map–making and spectral determinations.
First, the Fourier noise power spectrum is estimated for each photometer. Signal contamination is avoided by subtracting the data projected onto a map (and then re–read with the scanning strategy) from the initial TOI. This raw noise power spectrum is then corrected for two important effects (Benoît et al. 2002e ): (i) pixelisation of the Galactic signal that leads to an overestimate of the noise power spectrum: sub–pixel frequencies of the signal are not subtracted from the inital TOI leaving extra signal at high frequency; (ii) due to the finite number of samples per pixel, noise remains in the map and is subtracted from the initial TOI, inducing an underestimation of the actual noise in the final TOI (Ferreira & Jaffe 2000 , Stompor et al. 2002 ). Simulations, including realistic noise, Galactic dust and CMB anisotropies, indicate that both corrections are independent of the shape of the true noise power spectrum, and thus permit an unbiased estimate of the latter with an accuracy better than 1% at all frequencies. The corresponding uncertainty in the noise power spectrum estimation is included in the error bars of the spectrum.
We construct maps by bandpassing the data between 0.3 and 45 Hz, corresponding to about 30 deg. and 15 arcmin. scales, respectively. The high–pass filter removes remaining atmospheric and galactic contamination, the low–pass filter suppresses non–stationary high frequency noise. The filtering is done in such a way that ringing effects of the signal on bright compact sources (mainly the Galactic plane) are smaller than on the CMB power spectrum in the very first –bin, and negligible for larger multipoles. Filtered TOI of each absolutely calibrated detector are co–added on the sky to form detector maps. The bias of the CMB power spectrum due to filtering is accounted for in the MASTER process through the transfer function. The map shown in Fig. 1 is obtained by combining the maps of each of the photometers. A weighting of the data was done in each pixel, where is the variance of the data in that pixel. This map shows significant extra variance compared to the difference map on degree angular scales which is attributed to sky–stationary signal.
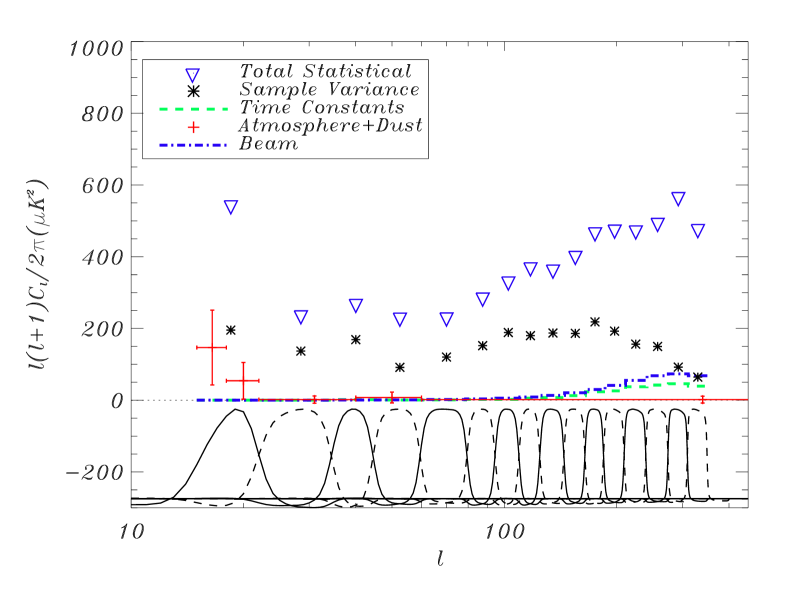
We estimate the CMB power spectrum in 16 bins ranging from to . The window functions derived from the multipole binning and renormalized to equal amplitude for clarity are shown at the bottom of Fig. 3. They are nearly top–hat functions due to the large sky coverage. The bins can therefore be approximated as independent: off–diagonal terms in the covariance matrix are less than . For the purpose of estimating the power spectrum we made a map that combines the data of the two photometers using two different weighting techniques. Up to the data of each photometer has equal weight and at larger values the data is noise weighted. This is valid because the multipole bins are nearly independent. It is also advantageous because it minimizes the overall statistical noise over the entire spectrum; equal weighting gives smaller error bars at small and noise weighting gives smaller error bars at large .
4 Results and consistency tests
The Archeops power spectrum is presented in Fig. 2 and in Tab. 1. Two different binnings corresponding to overlapping, shifted window functions (therefore not independent) were used. Archeops provides the highest resolution up to ( from 7 to 25) and most precise measurement of the angular power spectrum for to date. Sample–variance contributes 50% or more of the total statistical error up to .
| SD | D | ||||||
|---|---|---|---|---|---|---|---|
| 15 | 22 | ||||||
| 22 | 35 | ||||||
| 35 | 45 | ||||||
| 45 | 60 | ||||||
| 60 | 80 | ||||||
| 80 | 95 | ||||||
| 95 | 110 | ||||||
| 110 | 125 | ||||||
| 125 | 145 | ||||||
| 145 | 165 | ||||||
| 165 | 185 | ||||||
| 185 | 210 | ||||||
| 210 | 240 | ||||||
| 240 | 275 | ||||||
| 275 | 310 | ||||||
| 310 | 350 | ||||||
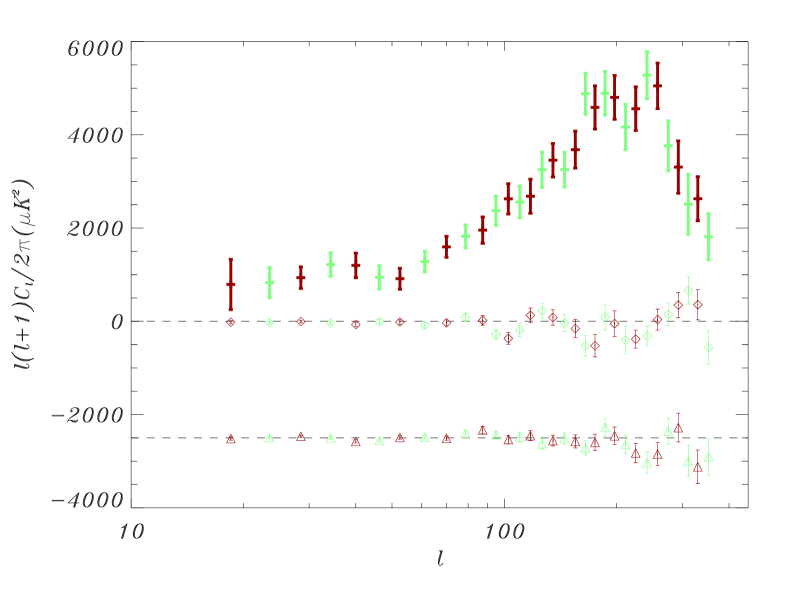
The Archeops scanning strategy (large circles on the sky) provides a robust test of systematic errors and data analysis procedures: by changing the sign of the filtered TOIs every other circle, a TOI that should not contain any signal is obtained once it is projected on the sky. This TOI has the same noise power spectrum as the original one. This null test is referred to as the self–difference (SD) test. The angular power spectrum of such a dataset should be consistent with zero at all multipoles because successive circles largely overlap. This test has been performed with the two photometers independently. The spectra are consistent with zero at all modes: of 21/16 (resp. 27/16) at 143 GHz (resp. 217 GHz). Performed on the two–photometers co–added map, the same test gives a power spectrum consistent with zero, with a of 25/16 (see Fig. 2). These results show that there is no significant correlated noise among the two photometers and that the noise model is correct. They limit the magnitude of non–sky–stationary signals to a small fraction of the sky–stationary signal detected in the maps.
A series of Jack–knife tests shows agreement between the first and second halves of the flight (the difference of the power spectra has ), left and right halves of the map obtained with a cut in Galactic longitude (). Individual power spectra of the two photometers agree once absolute calibration uncertainties are taken into account. The power spectrum measured on the differences (D) between the two photometers is consistent with zero with a of 22/16 (Fig. 2) showing that the electromagnetic spectrum of the sky–stationary signal is consistent with that of the CMB. The measured CMB power spectrum depends neither on the Galactic cut (20, 30 and 40 degrees north from the Galactic plane), nor on the resolution of the maps (27, 14 and 7’ pixel size) nor on the TOI high–pass filtering frequencies (0.3, 1 and 2 Hz).
Several systematic effects have been estimated and are summarized in Fig. 3, along with the statistical errors (blue triangles). The high frequency photometer (545 GHz) is only sensitive to dust and atmospheric emission, and thus offers a way to estimate the effect of any residual Galactic or atmospheric emission. Extrapolation of its power spectrum using a Rayleigh–Jeans spectrum times a emissivity law between 545 and 217 GHz and as between 217 and 143 GHz gives an upper–limit on the possible contamination by atmosphere (dominant) and dust. The combination of both is assumed to be much less than 50% of the initial contamination after the decorrelation process. The subsequent conservative upper–limit for dust and atmosphere contamination is shown in red crosses in Fig. 3. The contamination appears negligible in all bins but the first one ( to 22). High frequency spectral leaks in the filters at 143 and 217 GHz were measured to give a contribution less than half of the above contamination. In the region used to estimate the CMB power spectrum there are 651 extragalactic sources in the Parkes–MIT–NRAO catalog. These sources are mainly AGN, and their flux decreases with frequency. We have estimated their contribution to the power spectrum using the WOMBAT tools (Sokasian et al. 2001 ). At 143 (resp. 217) GHz this is less than 2 (resp. 1) percent of the measured power spectrum at . The beam and photometer time constant uncertainties were obtained through a simultaneous fit on Jupiter crossings. Their effect is shown as the dot–dashed blue and green–dashed lines in Fig. 3. The beam uncertainty includes the imperfect knowledge of the beam transfer function for each photometer’s elliptical beam. Beam and time constants uncertainties act as a global multiplicative factor, but in the figure we show the effect on a theoretical power spectrum that has a good fit to the data. After the coaddition of the two photometers, the absolute calibration uncertainty (not represented in Fig. 3) is estimated as 7% (in CMB temperature units) with Monte–Carlo simulations.
As a final consistency test, the Archeops are computed using two additional independent methods. The first is based on noise estimation with an iterative multi–grid method, MAPCUMBA (Doré et al. 2001 ), simple map–making and estimation using SpICE (Szapudi et al. 2001 ) which corrects for mask effects and noise ponderation through a correlation function analysis. The second is based on MIRAGE iterative map–making (Yvon et al. 2002 ) followed by multi–component spectral matching (Cardoso et al. 2002 ; Patanchon et al. 2002 ; Delabrouille et al. 2002 ). All methods use a different map–making and estimation. Results between the three methods agree within less than one . This gives confidence in both the and in the upper–limits for possible systematic errors. Table 1 provides the angular power spectrum which is used for cosmological parameter extraction (Benoît et al. 2002b ).
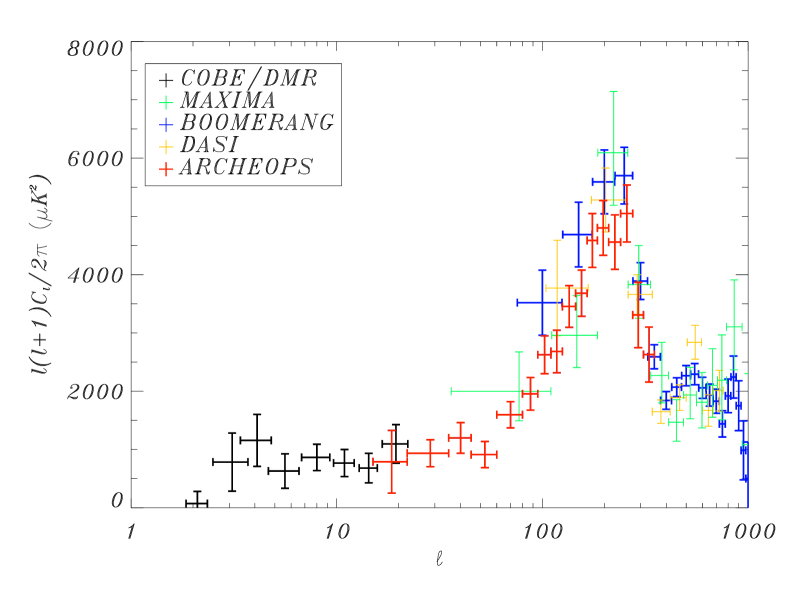
A comparison of the present results with other recent experiment and COBE/DMR is shown in Fig. 4. There is good agreement with other experiments, given calibration uncertainties, and particularly with the power COBE/DMR measures at low and the location of the first acoustic peak. Work is in progress to improve the intercalibration of the photometers, the accuracy and the range of the power spectrum: the low range will be improved increasing the effective sky area for CMB (which requires an efficient control of dust contamination), the high range will be improved by including more photometer pixels in the analysis.
5 Conclusions
The Archeops experiment has observed a large portion of the sky. Maps from the two highest sensitivity detectors at 143 and 217 GHz show consistent, sky–stationary anisotropy signal that appears inconsistent with any known astrophysical source other than CMB anisotropy. The angular power spectrum of this signal at multipoles between and shows a clear peak at . These results are consistent with predictions by inflationary–motivated cosmologies. Archeops provides the highest signal–to–noise ratio mapping of the first acoustic peak and its low– side of any experiment to date and covers the largest number of decades in . It has been obtained with a limited integration time (half a day) using a technology similar to that of the Planck HFI experiment. An extensive set of tests limits the contribution of systematic errors to a small fraction of the statistical and overall calibration errors in the experiment. More data reduction is under way to increase the accuracy and range of the power spectrum. The determination of cosmological parameters are discussed in a companion paper (Benoît et al. 2002b ).
Acknowledgements.
The authors would like to thank the following institutes for funding and balloon launching capabilities: CNES (French space agency), PNC (French Cosmology Program), ASI (Italian Space Agency), PPARC, NASA, the University of Minnesota, the American Astronomical Society and a CMBNet Research Fellowship from the European Commission. Healpix package was used throughout the data analysis (Gorski et al. 1998 ).References
- (1) Benoît, A., Ade, P., Amblard, A. et al. 2002a, Astropart. Phys., 17, 101
- (2) Benoît, A., Ade, P., Amblard, A. et al. 2002b, A&A, in press, astro-ph/0210306
- Benoît et al. (2002c) Benoît, A., Ade, P., Amblard, A. et al. 2002c, in preparation
- Benoît et al. (2002d) Benoît, A., Ade, P., Amblard, A. et al. 2002d, in preparation
- (5) Benoît, A., Ade, P., Amblard, A. et al. 2002e, in preparation
- (6) de Bernardis, P., Ade, P. A. R., Bock, J. J. et al. 2000, Nature, 404, 955
- (7) Cardoso, J. F., Snoussi, H., Delabrouille, J., & Patanchon, G. 2002, Proceed. EUSIPCO02 conf., Toulouse, Sep. 2002, astro-ph/0209466
- (8) Delabrouille, J., Cardoso, J. F., & Patanchon, G. 2002, MNRAS, submitted, astro-ph/0211504
- (9) Doré, O., Teyssier, R., Bouchet, F. R., Vibert, D.; Prunet, S. 2001, A&A, 374, 358
- (10) Ferreira, P. G., Jaffe, A. H. 2000, MNRAS, 312, 89
- (11) Fixsen, P. J., Cheng, E. S., Cottingham, D. A., et al. 1994, ApJ, 420, 445
- (12) Fosalba, P., Doré, O., Bouchet, F. R. 2002, Phys. Rev. D, 65, 63003
- (13) Gorski, K. M., Hivon, E., & Wandelt, B. D. 1998, Proceed. of the MPA/ESO Conf. on Evolution of Large-Scale Structure: from Recombination to Garching, 2-7 August 1998, eds. A.J. Banday, R.K. Sheth and L. Da Costa, astro-ph/9812350
- (14) Halverson, N. W., Leitch, E. M., Pryke, C. et al. 2002, ApJ, 568, 38
- (15) Hanany, S., Ade, P., Balbi, A., et al. 2000, ApJ, 545, L5
- (16) Hivon, E., Gorski, K. M., Netterfield, C. B., et al. 2002, ApJ, 567, 2
- (17) Lee, A. T., Ade, P., Balbi, A., et al. 2001, ApJ, 561, L1
- (18) Miller, A. D., Caldwell, R., Devlin, M. J., et al. 1999, ApJ, 524, L1
- (19) Netterfield, C. B., Ade, P. A. R., Bock, J. J., et al. 2002, ApJ, 571, 604
- (20) Patanchon, G.,et al. 2002, in preparation.
- (21) Rubiño-Martin, J. A., Rebolo, R., Carreira, P., et al. 2002, MNRAS, submitted, astro-ph/0205367
- (22) Schlegel, D., Finkbeiner, D., Davis, M. 1998, ApJ, 500, 525
- (23) Sievers, J. L., Bond, J. R., Cartwright, J. K., et al. 2002, ApJ, submitted, astro-ph/0205387.
- (24) Smoot, G. F., Bennett, C. L., Kogut, A., et al. 1992, ApJ, 396, L1
- (25) Sokasian, A., Gawiser, E., Smoot, G. F. 2001, ApJ, 562, L88
- (26) Stompor, R., Balbi, A., Borrill, J. D., et al. 2002, Phys. Rev. D, 65, 022003
- (27) Szapudi, I., Prunet, S., Pogosyan, D., Szalay, A. S., Bond, J. R., et al. 2001, ApJ, 548, L115
- (28) Tegmark, M. 1996, ApJ, 464, L35
- (29) Yvon, D. et al. 2002, in preparation.