Particle Accelerators in the Hot Spots of the Radio Galaxy 3C 445, Imaged With the VLT
Hot spots (HSs) are regions of enhanced radio emission produced by supersonic jets at the tip of the radio lobes of powerful radio sources. Obtained with the Very Large Telescope (VLT), images of the HSs in the radio galaxy 3C 445 show bright knots embedded in diffuse optical emission distributed along the post shock region created by the impact of the jet into the intergalactic medium.
The observations reported here confirm that relativistic electrons are accelerated by Fermi-I acceleration processes in HSs. Furthermore, both the diffuse emission tracing the rims of the front shock and the multiple knots demonstrate the presence of additional continuous re-acceleration processes of electrons (Fermi-II).
HSs are common features in powerful extragalactic lobe-dominated radio sources (Fanaroff-Riley class II). Their radio spectra are interpreted in terms of synchrotron radiation. Detection of optical radiation from HSs is difficult due to the natural decay of the synchrotron spectrum toward higher frequencies. Yet, the optical detection of HSs has a number of fundamental implications in our understanding of the physics of particle acceleration in these regions. Relativistic electrons rapidly lose their energy-emitting synchrotron radiation and the radiative lifetime of the electrons responsible for the emission in the optical band is times shorter – between a few hundred to a few thousand years, depending on the magnetic field strength – than that of the less energetic electrons emitting in radio wavelengths. As a consequence, optical detection of HSs implies either an extremely efficient transport of the ultra-relativistic particles from the core to the HS (1), or the in-situ production of such energetic particles with Lorentz factors to , where the Lorentz factor is defined as (2). Although the search for optical emission from radio HSs has a long history (3 - 5), few HSs have been detected as synchrotron emitters at optical frequencies (6). Indeed, at high frequencies most well studied HSs show an abrupt steepening of the spectrum below the straight power law extrapolated from the low frequencies, which is interpreted as a result of a high energy cut-off in the spectrum of the synchrotron emitting electrons. Thus far, there are only two known HSs in which the radio power law spectrum can be extrapolated up to the optical or ultraviolet regime (3C 303, 7) or even to the X-ray regime (3C 390.3, 8), indicating the continuation of the synchrotron emission to higher energies. In the case of optical detection, the short radiative lifetime of the emitting electrons as well as their diffusion length scale of much less than 1 kpc make high-resolution optical imaging (so far obtained only with Hubble Space Telescope) 9 an unequaled tool with which to sample those regions where high energy electrons are injected and/or re-accelerated.
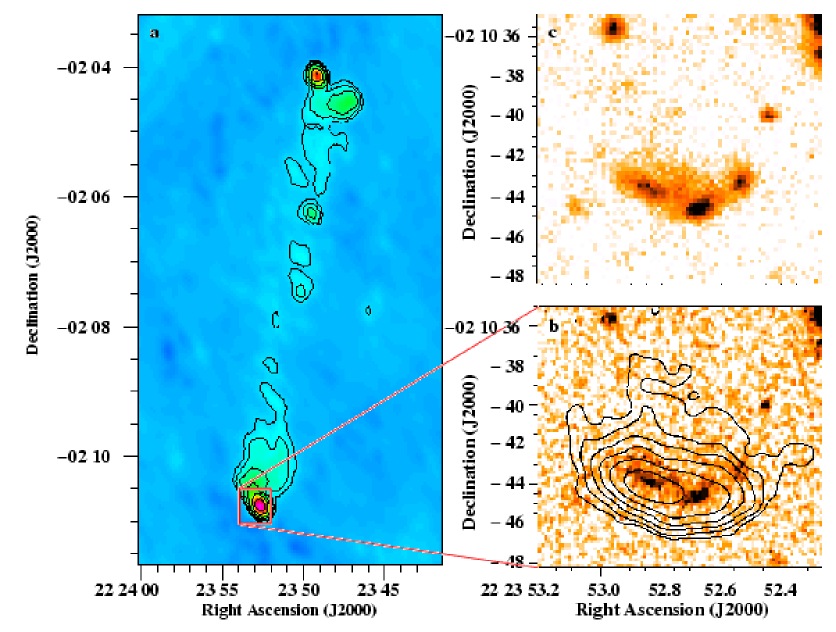
Here, we report on the imaging of the local accelerator regions in the southern HS of the radio galaxy 3C 445. 3C 445 is a classical double-lobe radio source at redshift z=0.0562. At the tips of each lobe are the southern HS, placed at kpc (, ), and the northern HS at a projected distance of kpc from the core (10). Both HSs were observed with the Very Large Telescope (VLT) of the European Southern Observatory and the Infrared Spectrometer and Array Camera, at the bands Ks (2.2 m), H (1.7 m) and Js (1.2 m), and the Focal Reducer/low dispersion Spectrograph, at the I-band (0.9 m). Each final image is the result of stacking between 10 (I-band) and 30 to 40 (Js-, H- and Ks-band) slightly shifted frames. Sky background removal was done by a median filter of several adjacent frames. The integration time ranged from 35 to 60 min depending on the band. The final image quality has an equivalent full width at half maximum of 06 in Ks, 05 in H, 045 in Js, and 055 in I. The counterpart of the radio emission from each HS was detected in all bands. The emission is extended in both cases and in all filters, but only the emission in the southern HS could be resolved in several compact regions. Thus, we focus our analysis and discussion on the southern HS.
The emission from the southern HS of 3C 445 is resolved in at least three compact regions (Fig. 1). These regions are further enclosed by diffuse emission detected at about the 5 level in all bands; the diffuse emission is more evident in the lower-frequency images. The overall optical emission has an arc-like shape and size as in the radio image, presenting the typical structure of a post-shock region usually seen at radio waves (10). We checked whether the electrons responsible for the synchrotron emission could have been transported by the jet from the core of the galaxy to the HS. The maximum distance electrons can travel away from the galaxy nucleus depends on both their synchrotron and inverse Compton (IC) radiative lifetimes () as well as on the velocity of the jet. The Lorentz factor of the electrons emitting synchrotron radiation in the I-band is , where is the magnetic field strength in the HS region in nT. A first estimate of can be derived assuming the usual equipartition conditions (11): From the observed synchrotron luminosity (Fig. 2) and the radio HS size (48), nT and the corresponding Lorentz factor is thus . The maximum distance (projected on the plane of the sky) the optical electrons in 3C 445 South could have reached away from the nucleus of the galaxy is less than 100 kpc, independent of the jet velocity and assuming that the electrons suffer only IC losses due to the interaction with the microwave photons (i.e. the intrinsic magnetic field is neglected, 12) Yet, HS 3C 445 South is 450 kpc from the core and, thus, the optical electrons witnessed must be produced in place.
An effective mechanism to accelerate relativistic electrons in the HSs of radio galaxies to the required energies, to , to emit optical light, is strong shocks. Strong shocks are expected to be produced by the impact of the jet into the intergalactic medium (6,13). From an observational point of view, the bow-shock shape seen in the images of the southern HS in 3C 445, at the tip of the radio lobe supports the shock-wave scenario. The integrated magnitudes in the Ks- (), H-(), Js- () and I-bands () of the HS, together with the integrated emission at 8.4 GHz ( mJy), were fit to theoretical synchrotron spectra produced by a population of accelerated electrons [after (14)]. Assuming a power-law electron distribution with typical injection spectral indices to 2.2, the models can successfully reproduce the data with a best fit cut-off frequency (, the synchrotron frequency emitted by the electrons accelerated at the maximum energy), Hz (Fig. 2). For those parameters, the break of the synchrotron spectrum (, the synchrotron frequency emitted by electrons of Lorentz factor beyond that radiative losses cause a steepening of the electron spectrum) occurs at for , and at for (errors at 90% confidence level). Because there are no radio observations with sufficiently high resolution, attempts to determine individual synchrotron spectra for the brightest compact regions in the HS are currently inconclusive; however Hz is obtained for the three main knots in the HS.
Numerical simulations of HSs (15 - 18) show that a high pressure cap is formed at the tip of the jet, from where the pressured plasma escapes backward into a larger, diffuse region, or cocoon, that forms around the jet. The VLT observations show a ‘primary’ knot, identified as the tip of the jet characterized by its enhanced brightness; two ‘secondary’ fainter knots, on each side of the primary; and diffuse emission with a bow-shock shape that we associate with the emission from the plasma which escapes from the shock region into the cocoon. However, the detection of emission up to 3 to 5 kpc away from the primary knot, is surprising because, assuming an equipartition magnetic field in the HSn the optical emitting electrons have a radiative lifetime of yr and thus a typical travel length kpc. Consequently, unless an improbably low intrinsic magnetic field nT is assumed, optical and infrared emission on scales larger than 1 kpc provides direct evidence for additional in-situ re-acceleration in the HS region with an acceleration time scale of the order of yr. Similar evidence has recently been observed in extragalactic optical jets (e.g., 3C 273, 19).
In addition, the appearance of multiple knots may indicate the presence of incipient Rayleigh-Taylor instabilities that produce variations in the plasma density and path length, leading to multiple emitting components such as those expected by simulated synchrotron images of HSs (18,20). The development of Rayleigh-Taylor instabilities in the cocoon may power magnetohydrodynamic (MHD) turbulence that can account for the required additional re-acceleration of the relativistic electrons downstream. Assuming Alfvénic turbulence in the cocoon, the MHD Fermi-II-like acceleration time (21) and ref. therein] is :
| (1) |
where is the typical distance between the peaks of turbulence responsible for Fermi-II acceleration, is the Alfvén velocity, and c is the speed of light. In following with Eq. 1, the acceleration efficiency , is proportional to the energy density in turbulence waves with scales , defined as . The scale should be between the minimum scale (, and being the sound velocity and the cyclotron frequency of the ions, respectively) and the maximum scale of the turbulence in the plasma. Two regimes of plasma temperatures are considered. For K, the largest possible scale of the undamped Alfvénic turbulence is , where m-1 [(22) and references therein]. The dissipation coefficient relevant for the damping of the turbulence waves is , whereas (J kg-1 s-1) is the energy source of the fluctuations that balances the dissipation. For proton thermal densities m-3 assuming J kg-1 s-1 typical of HSs (22), the maximum scale of the turbulence is found pc. Substituting this value in Eq. 1, with and m s-1, the Fermi-II-like acceleration time is
| (2) |
As a consequence, waves with turbulence scales of (which account for the bulk of the energy) can easily power Fermi-II processes. For K, which is typical of the intracluster medium, damping processes are less efficient and the largest turbulence scale is limited by the injection scale: here, of the order of the transverse dimension of the downstream region, i.e., kpc. Assuming ( is the differential energy density in waves between k and k+dk and in the Kolmogorov case, in the Kraichnan case) and , we find that in the Kraichnan case, yr for pc. Waves with that turbulence scale contain enough energy density to accelerate the optical emitting electrons. However, in the Kolmogorov case MHD Fermi-II-like acceleration is less efficient and very strong turbulence, , is required.
To test whether additional Fermi-II-like
acceleration in the downstream region can account for
the observed properties of the observed HS,
a calculation in three phases was considered.
This calculation attempts to mimic the behavior of the plasma in the HSs as
seen in MHD simulations.
First, the relativistic electrons diffuse, expanding from the high pressure
region (central primary knot), being also subject to synchrotron and IC losses.
Second, an approximate pressure balance is reached and electrons suffer only
synchrotron and IC losses. Finally, the plasma is recompressed in the regions
of the two secondary knots, possibly due to the development of non-linear
plasma instabilities.
During the three phases, relatively efficient ( yr) second-order Fermi re-acceleration
mechanisms are assumed.
We calculated the evolution of the electron energy considering
a magnetic field frozen into the plasma (homogeneous) and
obtained the synchrotron cut-off frequency, , as
a function of the distance from the primary knot for different model
parameters (Fig. 3).
Assuming a canonical transport velocity from the primary knot
in the range 0.03 to 0.1 c, we found that
the combined effect of adiabatic expansion (during the first phase)
and second-order Fermi
processes can maintain high enough to have optical and infrared
emission from
secondary knots located at 3 kpc distance from the primary
knot and still have detectable residual extended optical and infrared
emission in between the knots.
More specifically, we find that
this scenario works only if we assume relatively strong expansion
factors during the first phase (, is defined as the
ratio between the size of the plasma region after and before the
compression or expansion), to alleviate the strong synchrotron
losses in the region of the primary knot, and if we assume
a relatively low initial magnetic field strength nT (at
least for a conservative during the third phase).
We also found that such a limit
yields a magnetic field strength averaged over the total
HS region , which is consistent with the
field strength estimated from equipartition.
The above limit on the magnetic field strength and the derived
from the synchrotron spectrum allow constraining the
efficiency of the acceleration in the primary knot, where the
relativistic electrons are accelerated directly by the
shock (Fermi-I).
The acceleration efficiency here is higher:
year, as expected.
References and Notes
-
1.
W. Kundt, Gopal-Krishna, Nature, 288, 149, 1980
-
2.
K. Meisenheimer et al., A&A 219, 63, 1989
-
3.
W.C. Saslaw, J.A. Tyson, P. Crane, ApJ 222, 435, 1978
-
4.
S.M. Simkin, ApJL 222, 55, 1978
-
5.
P. Crane, J.A. Tyson, W.C. Saslaw, ApJ 265, 681, 1983
-
6.
K. Meisenheimer, M.G. Yates, H.-J. Röser, A&A 325, 57, 1997
-
7.
W.C. Keel, ApJ 329, 532, 1988
-
8.
M.A. Prieto, MNRAS 284, 627, 1997
-
9.
R.C. Thomson, P. Crane, C. Mackay, ApJL 446, 93, 1995
-
10.
J.P. Leahy et al., MNRAS 291, 20, 1997
-
11.
A.G. Pacholczyk, Freeman & Co., San Francisco, 1970
-
12.
Gopal-Krishna, P. Subramanian, P.J. Wiita, P.A. Becker, A&A 377, 827, 2001
-
13.
G. Brunetti et al., ApJL 561, 157, 2001
-
14.
G. Brunetti, M. Bondi, A. Comastri, G. Setti, A&A 381, 795, 2002
-
15.
M.L. Norman, K.-H.A. Winkler, L. Smarr, M.D. Smith, A&A 113, 285, 1982
-
16.
S. Massaglia, G. Bodo, A. Ferrari, A&A 307, 997, 1996
-
17.
J.M. Marti, E. Müller, J.A. Font, J.M. Ibanez, A. Marquina, ApJ 479, 151, 1997
-
18.
M.-A. Aloy, J.-L. Gomez, J.-M. Ibanez, J.-M. Marti, E. Müller, ApJL 528, 85, 2000
-
19.
S. Jester, H.-J. Röser, K. Meisenheimer, R. Perley, R. Conway, A&A 373, 447, 2001
-
20.
M.D. Smith, M.L. Norman, K.-H.A. Winkler, L. Smarr, MNRAS 214, 67, 1985
-
21.
M. Gitti, G. Brunetti, G. Setti, A&A 386, 456, 2002
-
22.
C. Lacombe, A&A 54, 1, 1977
-
23.
The positional coincidence between optical, infrared and radio data has been very carefully checked using the galaxy core position (for the radio maps) and the position of nearby stars taken from the USNO-A2.0 catalogue (for the optical maps, accuracy: 025).
-
24.
KHM was supported by a Marie-Curie-Fellowship of the European Commission. GB aknowledges partial finantial support from the Italian MIUR (Ministero dell’Istruzione dell’Università e della Ricerca) under grant Cofin01-02-8773. We would like to thank the staff at the VLT Paranal Observatory for their professional service. We are grateful to M. Bondi, I.M. Gioia, M.J.M. Marchã, K. Meisenheimer, M.-A. Pérez-Torres, G. Setti and S.R. Spangler for their valuable comments on the manuscript.