The Infrared Spectrum of R Doradus
Abstract
Here, we present our modelling (Ryde & Eriksson, 2002) of the spectrum of the red semiregular variable R Doradus observed with the Short-Wavelength Spectrometer on board the Infrared Space Observatory. We will also present the entire spectrum of R Dor up to based on our model photosphere in order to show which molecules are important for the emergent spectrum.
McDonald Observatory and Department of Astronomy, University of Texas at Austin, USA
Uppsala Astronomical Observatory, Sweden
1. Observations and analysis
Our goal is to discern whether a moderately varying M giant, such as R Doradus, could be modelled satisfactory with a hydrostatic model photosphere. We observed the region with the ISO SWS 06 at a resolution of and the full region with the SWS 01 at . The low-resolution SWS01 observation is used to ensure that the different SWS06 observations in this region were properly aligned.
We have calculated hydrostatic model photospheres with the marcs code in spherical geometry. Synthetic spectra were calculated using these model photospheres. The synthetic spectra, also calculated in spherical geometry, include lines from H2O (Partridge & Schwenke 1997), CO (Goorwitch 1994), SiO (Langhoff & Bauschlicher 1993), CH (Jørgensen et al. 1996), CN (Jørgensen & Larsson 1990 and Plez 1998, priv. com.), OH (Goldman et al. 1998), C2 (Querci et al. 1971 and Jørgensen 2001, priv. com.), and CO2 (Hitemp; Rothman et al. 1992).
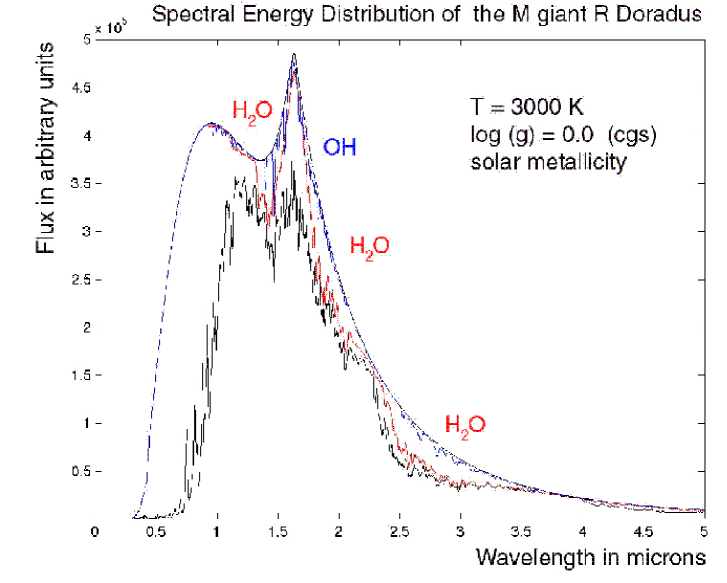
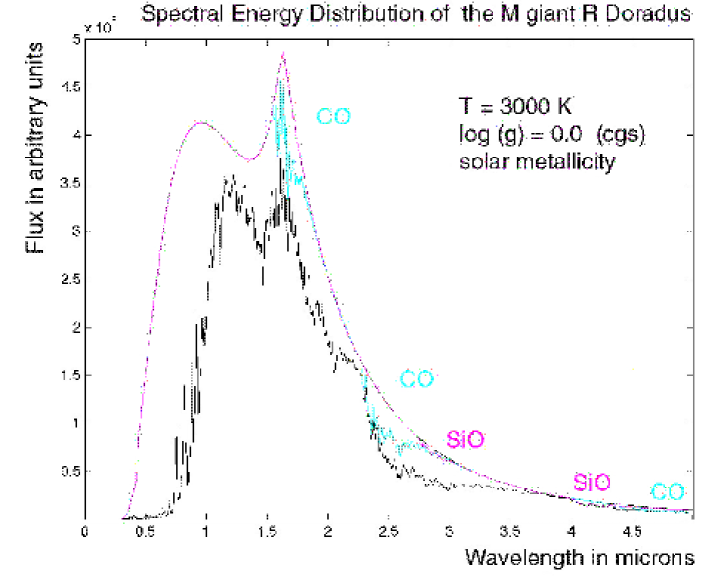
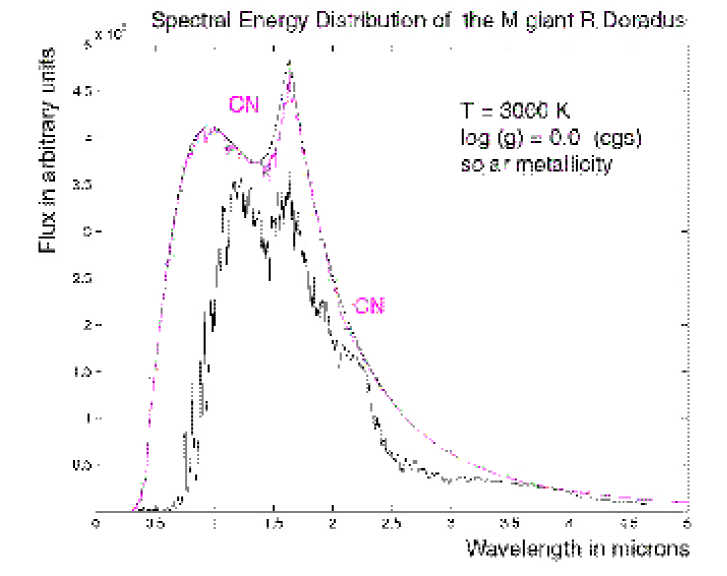
We are able to fit the observed range well with a hydrostatic model photosphere, see Figs. 1 and 2. Our best fit model have the fundamental parameters of K, , and solar metallicity. We find that the wavelength region investigated is sensitive to the effective temperature used in the modeling of the photosphere. The agreement between the synthetic spectrum and the ISO observations is encouraging, especially in the wavelength region of , suggesting that a hydrostatic model photosphere is adequate for the calculation of synthetic spectra in the near infrared for this moderately varying red giant star. However, an additional absorption component is needed at . Thus, we also find that the model does not account for this extra absorption component at the beginning of the interval. For a discussion of this discrepancy see Ryde & Eriksson (2002). The spectral signatures are dominated by water vapour in the stellar photosphere, but several photospheric OH, CO, and SiO features are also present.
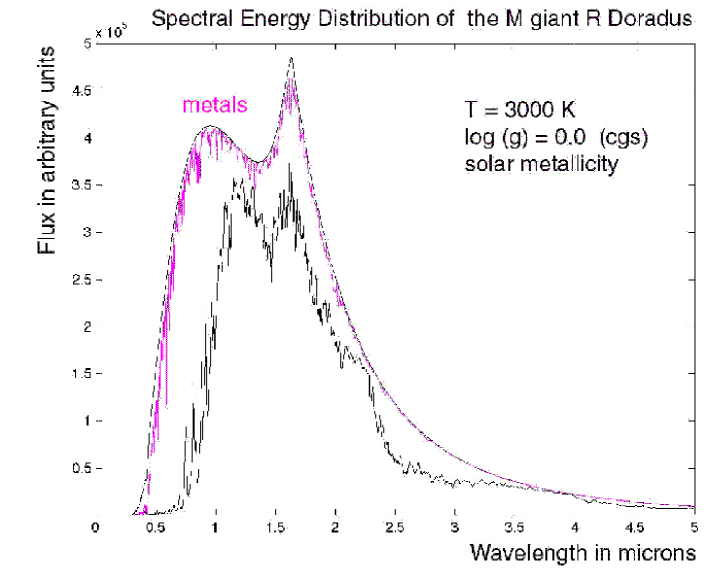
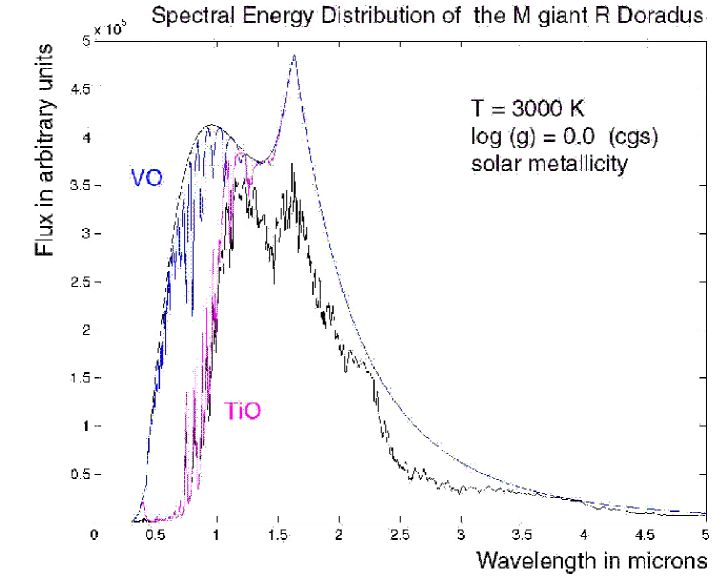
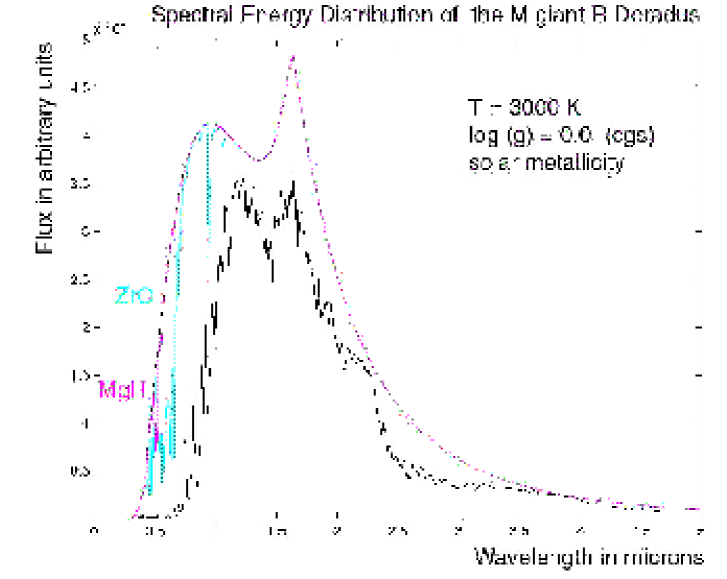
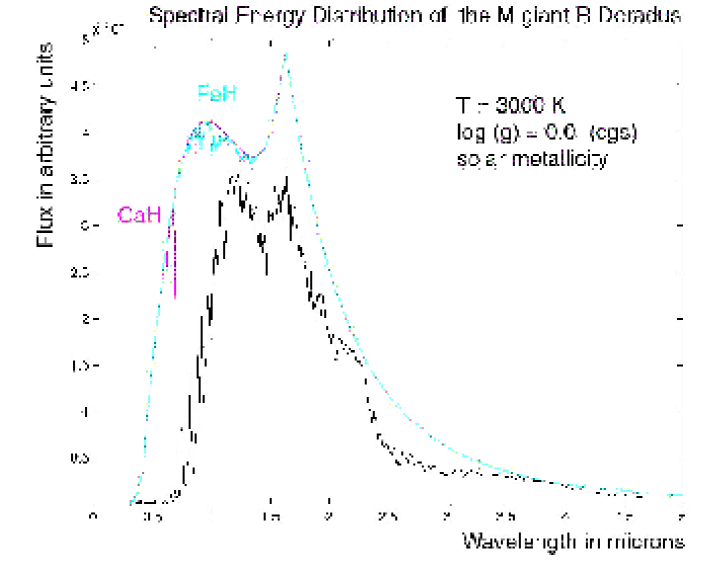
Figs. show which molecules are important contributors to the emergent spectrum (up to ) of R Doradus. The synthetic spectra shown there are all calculated using our R Dor model atmosphere. However, the spectra are synthesized with only one molecule at a time.


2. Concluding remarks
R Dor is a moderately varying M Giant. We have modelled its 3 micron ISO spectrum (resolving power is ca 2000) successfully with a hydrostatic model photosphere. Dynamical models are, however, certainly needed for the Mira stars, which show larger variations with time. Line opacities contributing at microns are H2O, CO, OH, and SiO. The region is found to be very temperature sensitive, and it is found that an extra absorption is needed at 2.6 - 2.8 microns.
Acknowledgments.
We should like to thank Drs. B. Gustafsson and D. L. Lambert for inspiration and enlightening discussions. This work was supported by the P.E. Lindahl Foundation Fund of the Royal Swedish Academy of Sciences and the Swedish Foundation for International Cooperation in Research and Higher Education.
References
Goldman et al. 1998, JQSRT 59, 453
Goorwitch 1994, ApJS 95, 535
Jørgensen & Larsson 1990, A&A238, 424
Jørgensen et al. 1996, A&A 315, 204
Langhoff & Bauschlicher 1993, Chem. Phys. L. 211, 305
Partridge & Schwenke 1997, J. Chem. Phys. 106, 4618
Querci et al. 1971, A&A 15, 256
Rothman et al. 1992, JQSRT 48, 469
Ryde & Eriksson 2002, A&A 386, 874