Spectral Response of the Pulsationally-Induced Shocks in the Atmosphere of BW Vulpeculae
Abstract
BW Vul is remarkable for exciting an extremely strong radial pulsation mode. This instability grows in its outer envelope and forms visible shock features in the continuum flux and spectral line profiles at two phases separated by 0.8 cycles. Material propelled upwards energetically in the atmosphere from the shock returns to the lower photosphere where it creates a second shock just before the start of the next cycle. We have obtained three nights of echelle data for this star over about five pulsation cycles (P = 0.201 days) in order to evaluate the effects of atmospheric shocks on a number of important red lines in the spectrum. These lines include He I 5875 and 6678, C II 6578-83 doublet, and other moderate (e.g., Si II 6371) and high excitation (Si III 5737) lines. We have added to these data 37 archival IUE/SWP echelle spectra obtained in 1994. We have investigated the equivalent widths and shapes of the optical lines for evidence of inter alia lags and have compared our results to the IUE fluxes extracted from the far-UV continuum, He II 1640, and several resonance lines.
A comparison of He I 5875 and 6678 line profiles during the peak of the infall activity suggests that differences in the development of the blue wing at this time are due to heating and a short-lived formation of an optically thin layer above the region compressed by the infall. This discovery and the well-known decreases in equivalent widths of the C II doublet at the two shock phases leads us to suggest that shock heating flattens the atmospheric temperature gradient, whether it is the infall shock preferentially heating of the upper atmospheric layers from infall, or the pulsational wave shock, which takes on an isothermal character as it emerges into the more tenuous upper photosphere.
Except for evidence of wind in the far blue wings of the UV resonance lines, we find no evidence for a shock delay arriving at different regions of line formation of the photosphere (i.e., a “Van Hoof effect’). Phase lags attributed by some former observers may be false indicators arising from varying degrees of desaturation of multiple lines, such as for the red He I lines. In addition, an apparent lag in the equivalent width curve of lines arising from less excited atomic levels could instead be caused by post-shock cooling, followed by a rebound shock, as suggested by subtle variations in the photospheric 1640 and UV continuum flux curves.
keywords:
stars: variable: other – stars: individual: BW Vul – line profiles – line formation – shock waves.1 Introduction
The Cephei variable BW Vul (HR 8007, HD 199140; B1 V to B2 III) is in kinematic terms the largest amplitude pulsator known in the Galaxy. Its fundamental radial pulsation mode (Stamford & Watson 1981, Aerts 1995) is so strongly excited as to produce discontinuous “standstill” features in the star’s light curve and, immediately following this, a longer standstill in the radial velocity curve as well. These features result from highly nonlinear processes associated with upward propagating pulsation waves. These waves emerge into the photosphere as highly supersonic shocks. During the pulsation cycle, the optical line profiles remain in absorption but undergo extreme variations in shape and velocity. Equivalent width variations are also noticeable at certain phases. In the often-used convention that = 0 occurs at light maximum (minimum radius), the radial velocity standstill becomes centered at = 0.98-1.00. Line profiles exhibit double lobes at phases just before (centered at 0.90), and during some cycles just after ( 0.06) the velocity standstill phase (e.g., Mathias et al. 1998). Adding to the complexity of description, the radial velocity curve is somewhat sensitive to the method of measurement, the spectral and temporal resolution of the observation, and especially to the momentary pulsational amplitude of the star, for the amplitude of the pulsations fluctuate by several percent from night to night (Crowe & Gillet 1989, Aerts et al. 1995, Mathias et al. 1998, Garnier et al. 2002). The equivalent widths of some metal lines vary with phases as a function of excitation potential (Furenlid et al. 1987). The finite signal-to-noise ratio and temporal sampling frequency of the International Ultraviolet Explorer (IUE) observations set practical limits on the otherwise considerable complementary UV information that they offer to optical spectra.
Despite these observational limitations, important effects of the star’s pulsation cycle are readily visible on the atmosphere. One of these is a variation of the effective surface gravity and especially the instantaneous “effective temperature” of the star during the cycle. Recently, Stickland & Lloyd (2002) have compared flux variations at a range of wavelengths from the far-UV to the near-UV to show that the effective temperature varies from 20,000 K to 25,000 K during the cycle. Temperature variations this large may well cause observable modulations in the mass loss and X-ray luminosity (cf. Cohen 2000) of the cycle.
Historically, controversy has surrounded the interpretations of the profile and strength variations caused by shock waves moving through the atmosphere of BW Vul. One of these is the so-called “Van Hoof effect,” named after its primary discoverer (Van Hoof & Struve 1953). This effect is the purported phase lag between the velocity curves extracted from lines formed at different atmospheric depths. This is thought to be the result of the finite travel time required for a pulsational shock wave to move up from one region of line formation to another. In the most recent such report, Mathias et al. (1998) reported that double line profiles of various lines observed near 0.9 and sometimes 0.1 can exhibit equal blue-red strengths at slightly different phases. A related issue is the cause of the line doubling itself. Odgers (1955) and Goldberg, Walker, & Odgers (1976) first attributed the velocity discontinuities to atmospheric absorptions just below and above the shock. These authors argued that as an upward-propagating pulsation wave breaks into a shock it accelerates the line forming regions of the atmosphere from the lower photosphere, thereby creating a density discontinuity with respect to the lower photosphere. The semi-ejected “shell” coasts to some maximum height and returns ballistically to these lower strata. In contrast, Young, Furenlid, & Snowden (1981; YFS) suggested that turbulence and pressure effects are the chief causes of the profile doublings at these phases. In their picture the standstills are caused by line formation in both a lower stationary atmospheric region as well as an infalling zone rendered transparent by its lower density. All these studies have pointed to the extended displacements of the line formation region (several percent of a stellar radius) as well as its virtual free fall from maximum to minimum radius.
In the most recent kinematical description, Mathias et al. (1998) and Garnier et al. (2002) have summarized the present consensus that there are two shocks per cycle. The first, “pulsation,” shock is the result of the evolution of the upward-propagating wave which grows in amplitude from the envelope where it is excited. As it emerges into the atmosphere at , this shock has a moderately high Mach (5-7) number, as referenced by the velocity “discontinuity” just prior to the velocity standstill. A subsequent, “infall,” shock, occurring 0.8 cycles after the first, is due to the extreme compression of the upper atmospheric strata as they fall back and catch up to the slower moving layers of the lower photosphere. In this picture the line profiles exhibit double lobes during the main (and often infall) shock because of the velocity jump associated with it. Mathias et al. also note that because the density of the atmosphere decreases monotonically outwards, the infalling region cannot be described as a disconnected shell. In addition, Mathias et al. suggested that shock progresses inward in terms of absolute (Eulerian; radius from star center) coordinates even as it moves outwards in mass. Thus, their description reconciles the idea expressed by several previous authors that two outward-moving shocks per cycle propagate up through the atmosphere. In the past the infall shock, which forms at 0.90, has been mistaken for a reflection of a shock from the previous cycle off an interior density gradient discontinuity. In this study we adopt the view of Mathias et al. that this shock is a natural consequence of infall, and that any earlier reflected shock is likely to be damped within the star, rendering it invisible at the surface.
The elusiveness of even a qualitative interpretation of the shocks in BW Vul has slowed the necessary development of self-consistent radiative hydrodynamical models. Early on, Stamford & Watson (1978) assumed that a large-amplitude velocity piston at the base of the atmosphere developed into a thin, isothermal shock as it progressed through the line formation region. Using this dynamical model atmosphere, they constructed line profiles of Si III 4552 at several key phases in the cycle. Profiles at phases we now call the infall shock exhibited line doubling (albeit over only a brief interval). In subsequent work Stamford & Watson (1981) placed a large, adiabatic sinusoidal velocity variation at the base of a gray model atmosphere and demonstrated that an isothermal shock developed in the line formation region. Although they did not compute line profiles in these simulations, Stamford & Watson stated that they anticipated that the shock would produce line doubling during the shock passage. The 1978 Stamford & Watson paper to date represents the only attempt to compute the line transfer for a spectral line in a moving model atmosphere appropriate to BW Vul. Recently, Owocki & Cranmer (2002) have developed hydrodynamic models that roughly simulate the velocity and light variations of the pulsating star. Their models assume strong outgoing shocks in realistic atmospheres. The shocks begin in the envelope as a large-amplitude pulsation wave, break into a small-amplitude shock in the lower photosphere, and evolve into an isothermal, large-amplitude (60 in density) shock in the wind. Owocki & Cranmer’s results show that the shock has the effect of flattening the atmospheric density gradient well out into the wind, thereby explaining the large range in phase over which the shock can be traced in the UV resonance lines. As these waves emerge into the wind, they can impact slower flows, causing reverse shocks and the formation of Discrete Absorption Components (DACs) in the far blue wings, indeed as observed in the Si IV and C IV lines (Burger et al. 1981, Blomme & Hensberge 1985, Massa 1994).
The idea of a strong shock front moving through the atmosphere is of course not limited to Cephei variables. In fact, the concept of a vertically propagating “hot front” was first used by Merrill (1955), referring to line doubling in both absorption and emission lines in long period variable stars. While this still represents the common interpretation of this spectroscopic phenomenon in the LPV stars (e.g., Alvarez et al. 2000), the idea of shocks heating the atmosphere have not taken root in most discussions of the dynamics of the BW Vul atmosphere. This is perhaps because emission components have not been observed in BW Vul’s spectrum. In fact, the only evidence given for shock dissipation and heating appeared rather recently, in Furenlid et al.’s (1987) discussion of variable O II lines. The subject has been virtually ignored since, and we will revive this discussion in this paper.
The present paper was motivated partially by our impression that an understanding of the shock wave properties has been hampered by uncertainties in spectroscopic measurements and interpretation. For example, YFS and Crowe & Gillet (1989) found widely different average equivalent widths for the important C II 6578-82 lines. Yet the “large” values found by YFS during the distension phases formed the basis of their conclusion that line doubling and strengthening is caused by changes in atmospheric continuous opacity. This suggestion though oft-quoted has gone untested. We also realized in planning our program that the existence of a Van Hoof effect could be tested by comparing the responses of the red He I 5875 (triplet) and 6678 (singlet) lines, which probe slightly different column lengths through their difference, and also volume densities because of the triplet line’s mild sensitivity to density through the partial metastability of its lower level. These lines have heretofore not been monitored in BW Vul. Other significant but so far unremarked lines in the red region are the Si II 6371 and Si III 5737 features, which together provide a measure of variations in the atmosphere’s ionization equilibrium. The echelle data we have obtained sample formation conditions of many lines at the same time and thus can provide accurate phasing information from this variable-amplitude pulsator. This simultaneity permits us to remove past ambiguities in correlating behaviors of various lines at different epochs. A second reason for undertaking this study is the availability of largely unanalyzed IUE data from several cycles at nearly the same epoch. This dataset permits us to tie together the resonance lines and high-excitation optical lines formed deeper in the atmosphere at a large number of phase reference points in the pulsation cycle.
| Night 1 (Sept. 17/18) | Night 2 (Sept 18/19) | Night 3 (Sept. 19/20) |
|---|---|---|
| 51805.574 | 51806.560 | 51807.568 |
| 51805.579 | 51806.564 | 51807.578 |
| 51805.583 | 51806.569 | 51807.585 |
| 51805.588 | 51806.574 | 51807.593 |
| 51805.593 | 51806.579 | 51807.599 |
| 51805.597 | 51806.584 | 51807.604 |
| 51805.602 | 51806.589 | 51807.609 |
| 51805.607 | 51806.593 | 51807.613 |
| 51805.612 | 51806.600 | 51807.617 |
| 51805.616 | 51806.606 | 51807.621 |
| 51805.621 | 51806.612 | 51807.651 |
| 51805.625 | 51806.620 | 51807.655 |
| 51805.629 | 51806.626 | 51807.659 |
| 51805.633 | 51806.632 | 51807.754 |
| 51805.637 | 51806.638 | 51807.759 |
| 51805.643 | 51806.646 | 51807.764 |
| 51805.649 | 51806.653 | 51807.767 |
| 51805.653 | 51806.657 | 51807.771 |
| 51805.657 | 51806.662 | 51807.775 |
| 51805.661 | 51806.666 | 51807.781 |
| 51805.665 | 51806.671 | 51807.785 |
| 51805.672 | 51806.677 | 51807.789 |
| 51805.676 | 51806.681 | 51807.793 |
| 51805.680 | 51806.686 | 51807.797 |
| 51805.684 | 51806.691 | 51807.801 |
| 51805.688 | 51806.696 | 51807.805 |
| 51805.692 | 51806.701 | 51807.809 |
| 51805.696 | 51806.705 | 51807.813 |
| 51805.700 | 51806.710 | 51807.817 |
| 51805.704 | 51806.715 | 51807.821 |
| 51805.708 | 51806.720 | 51807.826 |
| 51805.715 | 51806.724 | 51807.830 |
| 51805.719 | 51806.728 | 51807.834 |
| 51805.723 | 51806.732 | 51807.838 |
| 51805.727 | 51806.736 | 51807.843 |
| 51805.731 | 51806.740 | 51807.849 |
| 51805.735 | 51806.747 | 51807.855 |
| 51805.739 | 51806.751 | 51807.860 |
| 51805.743 | 51806.755 | 51807.865 |
| 51805.747 | 51806.759 | 51807.871 |
| 51805.751 | 51806.764 | 51807.876 |
| 51805.759 | 51806.770 | 51807.882 |
| 51805.763 | 51806.774 | 51807.887 |
| 51805.768 | 51806.778 | 51807.893 |
| 51805.772 | 51806.782 | 51807.898 |
| 51805.776 | 51806.787 | 51807.904 |
| 51805.781 | 51806.791 | 51807.909 |
| 51805.785 | 51806.795 | 51807.916 |
| 51805.789 | 51806.798 | - |
| 51805.793 | 51806.803 | - |
| 51805.800 | 51806.808 | - |
| 51805.810 | 51806.813 | - |
| 51805.815 | 51806.818 | - |
| 51805.819 | 51806.822 | - |
| 51805.823 | 51806.827 | - |
| 51805.832 | 51806.832 | - |
| 51805.837 | 51806.837 | - |
| 51805.841 | 51806.842 | - |
| 51805.846 | 51806.847 | - |
| 51805.851 | 51806.851 | - |
| - | 51806.856 | - |
| Wavelength | Ion | (eV) | log |
|---|---|---|---|
| 5606.09 | S II | 13.8 | 0.16 |
| 5639.980 | S II | 14.1 | 0.33 |
| 5640.314 | S II | 13.8 | 0.15 |
| 5646.979 | S II | 14.1 | 0.11 |
| 5648.070 | C II | 20.8 | -0.45 |
| 5639.980 | S II | 14.1 | 0.33 |
| 5640.314 | S II | 13.8 | 0.15 |
| 5659.956 | S II | 13.7 | -0.07 |
| 5662.460 | C II | 20.8 | -0.27 |
| 5666.629 | N II | 18.5 | 0.01 |
| 5676.017 | N II | 18.5 | -0.34 |
| 5679.558 | N II | 18.6 | 0.28 |
| 5686.213 | N II | 18.6 | -0.47 |
| 5696.603 | Al III | 15.7 | 0.23 |
| 5710.766 | N II | 18.6 | -0.47 |
| 5722.730 | Al III | 15.7 | -0.07 |
| 5739.734 | Si III | 19.8 | -0.160 |
| 5747.300 | N II | 18.6 | -1.020 |
| 5833.938 | Fe III | 18.6 | 0.616 |
| 5875.615 | He I | 21.0 | 0.41 |
| 6247.178 | Al II | 16.6 | -0.20 |
| 6346.859 | N II | 23.3 | -0.86 |
| 6371.371 | Si II | 8.2 | 0.00 |
| 6379.617 | N II | 18.5 | -0.92 |
| 6562.801 | H I | 10.20 | -0.69 |
| 6578.052 | C II | 14.5 | 0.12 |
| 6582.882 | C II | 14.5 | -0.18 |
| 6678.154 | He I | 21.3 | 0.33 |
2 Observations
2.1 Observations and reduction details
The optical data for this study were obtained on the nights of 2000 September 19–21 with the Sandiford echelle spectrograph (McCarthy et al. 1993) attached by fiber optics to the cassegrain focus of the Struve 2.1-m telescope at McDonald Observatory. The cross-dispersing prism in this instrument was rotated to select a central wavelength of 6120Å and to include a nearly continuous wavelength range (22 orders) of 5510-6735 on a 1200 400 CCD detector. This configuration resulted in a spectral resolution of 45 000 and a pixel spacing of 2.8 km s-1 pix-1. Signal-to-noise ratios of 200–300 were typically attained in integration times of 5–6 minutes, except at high airmass when they were increased to 7–8 minutes. (The profiles displayed in Fig. 7 of this paper were exposed 5–6 minutes.) Flat and comparison lamp spectra taken at various times of the night showed that the continuum and wavelength stability of the spectrum was robust. A table of the mid-observation times for the three nights is compiled in Table 1, while a line list of identified features in our spectra is given in Table 2. The wavelengths and excitation potentials listed are obtained from the Kurucz line library (Kurucz 1990).
The spectra were kindly reduced (background-subtracted, extracted, and flatfielded) by Dr. Chris Johns-Krull using computer codes described by Hinkle et al. (2000) and Piskunov & Valenti (2002). Wavelengths were determined by an interactive graphics package that allowed a solution simultaneously in the echelle and cross-dispersion axes (Valenti, priv. comm.). Solutions were obtained by minimizing residuals between laboratory and observed Th and Ar line wavelengths and iteratively rejecting outliers. Corrections for terrestrial orbital and rotational velocities were made. Rectification of echelle orders was performed by an interactive polynomial fitting procedure. Orders were then spliced at wavelengths for which flux contributions of adjoining orders were equal. We measured the radial velocities of strong lines by cross-correlating the lines against a reference line profile observed near =0.2. Profiles at this phase are approximately symmetric and exhibit an approximately mean width and thus lend themselves to comparison with profiles of extrema phases. We determined true equivalent widths of these lines and other analyzed features in the McDonald spectra by an interactive computer algorithm tailored for this application. The program uses input wavelength ranges over which both the continuum and the line’s absorption profile are to be extracted. The continuum level is then fixed by a specified “Nth percentile brightest flux” among candidate fluxes in the continuum window. The value of N, typically 80%, can depend on the presence of nonstellar features but is well suited to modification interactively when such unwanted features appear as telluric lines, cosmic rays, or fringing.
2.2 IUE Spectra
In order to avoid uncertainties in the absolute calibration of fluxes, we made use of 38 high-dispersion echellograms obtained with the SWP camera through the large aperture during monitoring campaigns on the star in October and November 1994. “NEWSIPS” extractions were downloaded from the MAST111 Multi-Mission Archive at Space Telescope Science Institute, under contract to NASA. web-based archives. Absorption line strength indices (LSI) were then calculated by ratioing the total net (uncorrected for ripple distortion) flux in a narrow band centered at line center to the total net flux in the parent echelle order. Such indices are not true equivalent widths, but they are directly proportional to them and increase with absorption strength. Because these indices are insensitive to continuum placement, and (as defined herein) independent of errors in blaze function (“ripple”) correction, they are unambiguous measures of the absorption for prescribed velocity limits, and they are particularly accurate differential measures of line strength differences for an IUE time series. The line fluxes were measured between velocity limits of generally Å of line center, where the radial velocity of the star was referenced at –10 km s-1. Because the radial velocity of the star changes dramatically through the cycle, we first determined spectrum-to-spectrum shifts in pixel space before co-adding spectra in a co-moving frame.
2.3 Radial Velocity Ephemeris
Although there is unanimity that BW Vul is monoperiodic (with P 0.201043), some controversy has surrounded the “drifting” of its pulsation period derived from datasets of different epochs. Various authors have suggested ephemeris corrections for a quasi-evolutionary lengthening, light travel time across a binary, and both random and discontinuous changes for unspecified reasons. In past years support has built for the binarity solution with an orbital period near 34 years (Pigulski et al. 1993, Odell 1994, Horvath, Gherega & Farka 1998), although it appears possible that small random changes can also alter the phase zeropoints from time to time (Sterken 1993). We have adopted the binary + secular-lengthening solution of Horvath et al. for the light minimum phases. Light minimum is the recommended new benchmark because it can be determined with greater precision (Sterken 1993). To these calculated phases, we have added 0.48 cycles (Furenlid et al. 1987, Stickland & Lloyd 2002) to reference them to the traditional zero at optical light-maximum. This is also the approximate midpoint of the radial velocity standstill. This ephemeris agrees to within 0.015 () cycles of the midpoint occurrence of the standstill in our McDonald data. The relative phases of the 1995 IUE epoch did not match as well, giving a difference of 0.09 cycles from this ephemeris relative to the standstill occurrence found by Stickland & Lloyd. We have referred our = 0 fiducial to the Stickland & Lloyd phase = 0.10, which takes into account that the latter authors tied their zeropoint to radial velocity maximum instead of the usual velocity standstill criterion.222Note that the photometric standstill occurs just before the onset of velocity standstill and is much shorter. These respective standstills last about 0.03 and 0.15 cycles (see e.g., Furenlid et al. 1987).
3 Results

3.1 Radial velocities
A large number of radial velocity curves have been discussed for BW Vul from as many optical datasets. We decided to focus our work on the radial velocities of the red helium lines and primarily for the purposes of checking the phase zeropoint and to search for differences in amplitude among the cycles on the three nights of our observations. We determined an instrumental systemic velocity of the star by comparing the centroid wavelength of symmetric line profiles with nearby Th-Ar features in our emission spectra and correcting them for the Earth’s orbital and rotational velocities. We then averaged all the velocities around their respective cycles. The resulting mean heliocentric radial velocities found for BW Vul from the three nights were –7.7, –10.3, and –11.4 km s-1. The resulting mean of –9.7 km s-1 is in excellent agreement the mean value of –9.2 km s-1 given by Mathias et al. In Figure 1 the radial velocities are shown for the He I 5875 for all the three nights. It was possible to measure the equivalent widths of the lines arising from highly excited atomic levels, but these often were both weakened and broadened to invisibility during the critical shock passage phases. Radial velocities are also given in Fig. 1 for Si III 5740 and Si II 6371 (the latter can reliably be measured only in the phase ranges 0.1 0.85). The silicon lines have velocity amplitudes 5-10% larger than the helium line curves and even more striking discontinuities at the beginning at end of standstill. The H velocity curve (not shown) has even a slightly smaller amplitude and less steep “discontinuities” than the He I line curves do. We believe that these are effects of the far wings of the helium and hydrogen lines, which tend to broaden the cross-correlation function and produce artificially small velocity differences for the line core. Aside from this anomaly, the silicon line velocities are similar to the helium ones. All these transitions have moderate to high excitation potentials (20 eV) and are saturated. Thus, in static atmospheres without the imposition of shocks one expects them to be formed in the lower photosphere close to the continuum formation region. Thus it should not be surprising that they do not show phase lags (Van Hoof effects). By comparison, we also exhibit in the upper region of the three panels of Figure 1 the equivalent widths of the Si II 6371 line over those phases outside the shock intervals - these are the times when the line was strong enough that reliable centroid positions could be measured. On Nights 2 and 3 one sees that the phases of velocity maximum extend slightly longer in the Si II feature than in the He I line, causing a slight delay in the onset of the standstill for the He I line curves. We believe that this is an artifact of a relatively “late” desaturation of the blue lobe of the weaker Si II line, causing the line’s centroid velocities to remain at negative velocities for a longer time and to later phase than the other lines measured (see 4.4). We note also that the average radial velocity of the two red He I lines during standstills of each of the three nights was –8.3, +2.8, and –11.6 km s-1, respectively, giving a mean of –6 km s-1. This is very nearly the systemic velocity of the star, a result similar to that found by Mathias et al. (1998). Finally, differences among the two He I lines and the Si II line averaged km s-1, so it is likely that there are minor cycle-to-cycle differences in the mean velocity of the standstill.
Figure 1 provides a useful means of correlating the He I line velocities with equivalent width changes for this and other lines during the cycle. Notice first the clearly defined standstill of the velocity curve, lasting some 0.16 cycles. This feature can be used to check the phase zeropoint given in past ephemerides. The features of the standstill are found to be similar in form, whether determined from a line-centroiding technique or from fitting two gaussians when they appear. Additionally, the feature also shows a shallow positive slope, as several other investigators have noted who used a different (double-gaussian) velocity measurement criterion. The standstill velocities are near zero or slightly negative. In addition, Fig.1 indicates that the positive velocity amplitudes, and phases of the quasi-discontinuity leading to the standstill, can change from one cycle to the next. We can speculate that these differences reflect the variable pulsation shock strengths from the preceding cycles.

3.2 Behavior of the Excited Optical Lines
3.2.1 The red He I lines
The accurate measurement of equivalent widths of lines in the BW Vul spectrum is challenging because the positions, widths, and core depths vary dramatically over the cycle. We began our study by investigating equivalent widths for the 5875 and 6678 lines. These He I transitions are, respectively, analog triplet and singlet 2P-3D transitions, and each has excitation potentials of 21 eV. Although variations of the neutral helium line have not yet been studied in this star, their importance cannot be overstated because of the lines’ sensitivity to atmospheric heating. Furenlid et al. (1987) reported unambiguous evidence for a temperature rise from increases in the ratio of a pair of O II and Fe III lines during the velocity-standstill phase. Figure 2 shows the variation of the true equivalent widths for the He I 5875 and He I 6678 lines for all three nights. These plots exhibit generally two maxima, the stronger of the two centered at the occurrence of the infall shock at 0.90-0.95. The equivalent width ratio of these lines is 1.13 outside the “windows” of the two shock intervals. Because the ratio of their atomic ’s is two, the observed ratio indicates that the features are very optically thick. The measured ratio is almost the same during the passage of the pulsation shock, but it increases to a mean value of 1.23 during the infall shock.

3.2.2 The C II 6578, 6583 doublet and high-excitation lines
The C II 6578, 6583 doublet is located close to the H line and arises from a similarly excited level of 14.4 eV. It has thus long served as a conveniently accessible temperature probe for atmospheres of variable B stars. We measured the true equivalent widths of each of these lines in the same manner as the He I lines. These are exhibited in Figure 3, where we have represented the two lines by different symbols and rescaled the equivalent widths of 6583 to the slightly larger ones of 6578. Some of the scatter at like phases arises from measurements at adjacent pulsation cycles. The ratio of the components is 2. The observed ratios do not show evidence of variations during the cycle, and their nightly means, 1.28, 1.14, and 1.16, show clearly that even though the lines are comparatively weak they are quite optically thick.
Our C II doublet curves in Fig. 3 exhibit well defined minima that coincide in phase with the broad minimum found by Crowe and Gillet (1989), except that the latter authors’ data do not hint at a separation in phase between the two individual shocks. The C II curves are also very similar to those shown for the residual intensity of the H core discussed by Crowe & Gillet (1989). We have confirmed this behavior for the core of this line in our data and have also found that the equivalent widths extracted from small wavelength windows centered on the core exhibit a similar behavior. The effect rapidly disappears and even inverts as one includes more and more contribution of the H wings in the window. These results confirm that the variations are produced by localized atmospheric strata. Other moderate to high excitation lines such as N II 5710 ( = 18.5 eV) and S II 5640 (13.8 eV) produce variations similar to the C II doublet, but the intrashock maxima for them are not always so clearly separated in phase. For phases outside the two shock intervals, many of the lines in our sample broaden and fade to below our detection threshold.
3.2.3 Si II 6371 and Si III 5740 lines
The Si II 6371 and Si III 5740 lines are important because they arise from atomic levels having the largest combined excitation and ionization potentials of all the lines in our optical coverage, save the He I lines. In addition, their combined responses furnish information on changes in the ionization equilibrium in this atmosphere during the pulsation cycle. In investigating the strengths of these lines, we found first that the Si III 5740 line shows only mild increases of 10–50% in equivalent width from night to night during shock passage. This is because the ionization equilibrium of silicon is roughly balanced between Si+1 and Si+2. However, as the dashed lines at the top of each of the panels in Figure 1 show (plotted are the reciprocals of the line strength), the response of the Si II 6371 line can be quite pronounced. During the passage of the second (pulsation) shock, the 6371 broadens and weakens so much that its velocity centroid cannot be reliably measured. As indicated in Fig. 1, the phases of maximum weakening do not coincide with the shock passage but rather are delayed by 0.10 cycles after the end of the standstill phase, when the strengths of the excited lines are slowly decreasing.
Figure 3 gives an indication of the variations in shock heating and of the inequality of heating amplitudes between the two shocks. One can see this, first, in the amplitude variations in the shocks (as judged by the sharpnesses and depths of the C II minima) and, second, in the variation of the strengths of the Si II line and other moderate excitation lines, e.g., S II 5640. These diagnostics generally imply that the temperature increase associated with the pulsational wave is the stronger of the two shocks. This is contrary to the inequality of the shock jumps (Fig. 1; see also Mathias et al. 1998). We also note for discussion below that the phase of equivalent width minimum is delayed by 0.07–0.08, both with respect to the line’s radial velocity minimum (Fig. 1) and with reference to the C II equivalent width minimum at = 0.1.
3.3 Ultraviolet lines
Except for the He II 1640A line (“helium H,” = 41 eV), the UV lines used in this analysis are all resonance lines. To varying degrees the latter lines have components formed both in the static line forming region (upper photosphere) and the accelerating wind. We will treat these lines in order of likely formation depth, starting from the He II feature, and work our way up through ionization potential out into the wind.

3.3.1 He II 1640
Figure 4 depicts the extracted UV continuum (UVC; representing 1800-1905) light curves from the 37 available large-aperture IUE/SWP spectra obtained in 1994, together with the extracted line strength index created from ratios of fluxes within about Å of He II line center to all the other net (ripple uncorrected) fluxes in the echelle order containing the line. The detailed shape of the UVC curve is in excellent agreement with the two plots constructed by Stickland & Lloyd (2002) from essentially the same data. The curve shows a broad, asymmetric maximum which may be an underresolved rendition of two peaks apparent in the line strength curves at = 0.9 and 0.1. This double-peaked structure is completely unresolved in optical light curves (cf. Fig. 3 of Stickland & Lloyd 2002). Note also that the scatter is small and does not seem to reflect the obvious cycle-to-cycle differences at some phases in the radial velocity curves. The He II 1640 absorption curve is morphologically very similar to the UVC curve. The curves extracted from the blue and red halves of the profile are in turn identical to one another. The similarity between the UVC and He II curves is the result of the proximity of the depths of formation of this line and the continuum. However, the slight tendency of the He II curve to flatten at the maximum- and minimum-flux phases is likely caused by both the core and line (formed over different depth ranges) being sampled in our extraction. A slight bump in the He II curve at 0.20–0.28 is visible in Figure 4 and is also reproduced in the UVC curve. To clarify this bump and the weak dip occurring at a phase just before it ( = 0.15–0.20), we overplot two curves in Fig. 4. The first is a simple sine curve (dashed line), and the second (solid line) is a sine curve that has been compressed/stretched in the first and second quadrants. No matter how one chooses a fitted curve to the observed values (from three different pulsation cycles) the dip and bump features fall outside the error limits. These weak features are also visible in the two UVC curves of Stickland & Lloyd, based on 21 additional spectra and from data processed and extracted by different algorithms from ours. These are undoubtedly real, and we comment further on them in 4.1.


3.3.2 Resonance lines of moderately excited ions: Al III, Si III, and Si IV
Figure 5 depicts the UVC and absorption curves for the lines Al III 1855, Si III 1206 and Si IV 1394. We have inverted the Al III and Si III curve in these plots to facilitate a comparison among all four curves. Curves extracted from the blue halves of the Si III and Si IV lines have 10–20% larger amplitudes than the red halves but otherwise are similar. Note first that the Si III curve weakens (rises) more quickly than Si IV strengths during the phase interval 0.7–0.9. This is likely to be a consequence of Si+3 being the dominant ion in the atmosphere, and Si III responding (decreasing in strength) more readily to heating that accompanies the infall shock at 0.9. Secondly, note that as one proceeds from the Al III through the Si IV curves, the maximum absorptions of the excited ions extend over longer and longer intervals. Figure 6 demonstrates that their long-lived character continues for the C IV 1548 and N V 1238 (blue half only) features. For these lines one sees that this plateau extends to 0.4, which is some 0.3 cycles after the shock passes through the photospheric line formation regions of C IV and N V. Experimentation with extractions along the C IV profile indicates that as one includes more and more blue wing (wind absorption) in the measurement, the onset and extension of the maximum-strength phase shifts to later and later phases. Thus, this appearance of the shock as a long-lived feature in the wind is responsible for the positive phase shift of the “C IV_blue” and “N IV_blue” curves relative to the “C IV_red” plot in this figure.
4 Discussion
4.1 “Phase lags” reinterpreted
The combination of optical and UV resonance line results requires a picture which integrates the effects of the pulsation and infall-generated shocks. Figures 4, 5 and 6 record the differences in UV line responses with increasing ionization potential. Massa (1994) has depicted the acceleration of C IV, Si IV, and Si III in grayscale IUE 1979 spectra. These spectra show that the wind features start 0.1 cycles after the passage of the pulsation wave through the photosphere. The photospheric and wind components of C IV are at times co-mingled, but otherwise there is no hint of a graduated response through the photosphere. Rather, there seem to be separate responses from two discrete “photospheric” and “wind” regions. In particular, continuum fluxes and lines of high excitation, such as He I, He II, and Si III, show no perceptible phase differences in their velocity or line strength responses. Even the line strength minima of the moderate excitation C II doublet ( = 14 eV) seem to coincide with the appearance of the shocks just prior to and following the end of the velocity standstill. These lines collectively span a large range in excitation. Lines arising from less excited levels than 14 eV, such as the resonance lines of Al III or moderate excitation lines of Si III (Stickland & Lloyd 2002), cannot be measured precisely enough in IUE spectra to search for phase lags with respect to the optical lines. In fact, we find that in order to see any obvious indication of a phase lag after the passage of the excited lines one must search in the far blue wings of the resonance lines. Perhaps this should not be a surprise. According to the Owocki & Cranmer (2002) simulations, the UV absorption features form over length scales much longer than the effective depth of the static line formation region. Thus, there is ample column length over which shock-induced features can develop.
If there are no phase delays among the excited optical lines, what is one to make in Figure 1 of the apparent phase delay of 0.07–0.08 after the Si II 6371 curve? We believe the key here is that Si+1 is a trace atmospheric ion, which is therefore sensitive to temperature and not that its mean line formation region is so high in the atmosphere that it takes the shock a finite time to reach it. Consider as a more plausible circumstance that the formation regions of most optical lines largely overlap. The so-called “delayed” weakenings of the Si II feature may more easily represent the subsequent passage of a cooler medium. We have in mind the post-shock region which is cooler and more tenuous than the shock interface (Liberman & Velikovich 1986). A strong post-shock rarefaction is clearly visible in the hydrodynamic simulations of Owocki & Cranmer (2002) and indicate a rough “half-wavelength” of 0.25 cycles. From this result one might anticipate the effects of a rebound shock having approximately this delay. Altogether, we can speculate that the marginally visible bumps in the UVC and He II strength curves at 0.23 are produced by a small temperature enhancement due to the rebound. In this picture the abrupt-appearing end of the UVC maximum would be the result of particles entering the cooled post-shock flow.


4.2 Blue wing strengthenings (moderate velocities)
To gain some insight into the cause of the equivalent width variations of the red He I lines exhibited in Fig.2, we examined the shapes of the two lines as a function of phase. Figure 7 illustrates that the cause of the equivalent width maximum of 5875 at = 0.9 on each night is a strengthening of the blue wing. In these plots we exhibit this fact by multiplying the depth of 6678 on the blue wing (and also extreme red wing) by a factor of 1.4 to 1.8. Figure 7 shows that blue wings of the 6678 scaled by these factors indeed replicate the 5876 absorptions at this phase. We see this phenomenon over a total range of 0.08–0.10 cycles centered on radial velocity maximum (0.91) on each of the three nights. In these various examples the limiting line-depth scaling factor appears to be about 2.0. Since this is also the ratio of the lines, it is likely that these extra absorptions are due to the medium at negative velocities being optically thin to He I line radiation. An alternative possibility, that the excess arises from metastability of 5875, is implausible because no such excess absorption is present in this line during the distension (low-density) phases at 0.5.
If temperature variations cause the changes in the blue wings of the He I lines, there should be a similar response in the inner blue wing of the C IV doublet members - the cores of the Si IV lines are too broad to demonstrate this. Figure 8 implies that the absorption-scaling argument is likely to be valid, that is, that an excess absorption at about –100 km s-1 of line center is caused by an optically thin column at these shifted wavelength. (By “excess,” as for the He I lines in the previous figure, we refer to the absorption in the blue wing of the stronger 1548 line relative to 1550.) Massa’s (1994; see Fig. 3) grayscales exhibit this same effect – as a low-velocity “spur” occurring 0.1 cycles before the wind acceleration manifests itself at more negative velocities.
4.3 C II line strength variations
The reader will recall that Young, Furenlid, & Snow (1981) first drew attention to C II variations during the cycle of BW Vul and posited that the C II variations were the result of the lines growing anomalously strong outside the shock phases. To test this assertion, we have synthesized the C II doublet with the Hubeny SYNSPEC (Hubeny, Lanz & Jeffery 1994) line synthesis code using Kurucz (static!) model atmospheres. For an atmosphere having K, , and km s-1, we found an equivalent width of 0.22 Å for 6578 and a 6578/6583 ratio of 1.14. Nearly identical results obtain for . These values compare well with our mean observed 6578 equivalent width value of 0.235 Å for phases outside the shocks and with the corresponding mean observed ratio of 1.19. Our modeling also shows that the strengths of these lines are quite insensitive to changes in temperature in the domain 20 000–25 000 K. The models do not confirm the speculation by YSF that changes in atmospheric density play a strong role in determining the line strength changes during the cycle. Of course, the line strengths will increase appreciably with any microturbulence that might accompany the shocks, so this would not explain the decrease during these phases. The upshot of these calculations is that the decreases in C II strengths observed at shock phases cannot be due to simple changes in atmospheric temperature or density. Thus, our results suggest that the question to pose is not “why are the C II strengths large during the non-shock phases?,” but rather “why do the C II strengths decrease to smaller values than they should have during shock phases?” The question is critical to a discussion of the shocks in BW Vul’s atmosphere because the effects of temperature increases are obvious for other lines but lead to a contradiction for the response of the C II features. Adding additional turbulence from a shock would make the disagreement worse by forcing the predicted absorptions to be larger.
4.4 Physical effect of the shocks on the He I and C IV lines
If enhancements of neither temperature nor turbulence can explain the line weakening, let us consider instead the effect of a flattening of the temperature gradient with atmospheric depth, particularly in the construct of an LTE Milne-Eddington atmosphere. In this formulation the strengths of weak lines should simply be proportional to the gradient . To interpret the enhanced absorptions in the blue wings of the He I lines (and possibly C IV) at = 0.9, one should also consider the heating effects from infall of material above where a line is being formed. At this phase, upper strata are returning toward the surface at nearly free-fall velocities (Furenlid et al. 1987). Strata just below them fall slightly more slowly, and so on, down to the fully-braked stationary layers. These combined decelerations produce compression over a broad range of layers. The result of this pile up is a conversion of differential flow velocity to local heating. Indeed, this effect can be observed as the first maximum of the UVC and He II line strength curves at = 0.85–0.1 (i.e., at velocity maximum) and by the disappearance of the cool-gas diagnostic, Si II 6371, at the same times. Heating will increase the number of atoms in excited states and thus should permit new optically thin absorption to appear in the excited He I lines. This absorption is formed in a still-falling column which is still high enough in the atmosphere to be optically thin to an external observer. Most of the initial column density will be concentrated near the shock, so the lobe will appear at near-rest velocities. As this pile up proceeds, the threshold column density needed for visibility will recede (moving upward, in Eulerian coordinates), permitting the optically thin absorption in the profile to grow toward positive velocities until it runs into and merges with the optically thick red lobe. The process ceases when the deepest layers essentially at rest become optically thick to the observer. At this point, just after phase 0.0, the entire profile becomes optically thick over a broad distribution of line velocities, both from the still-falling column and the strata at rest at the bottom. The standstill phase ends quickly as the material in the falling column is suddenly exhausted – the optical depth turns thin and to zero very quickly at wavelenths in the red lobe of the profile.
During the infall phase the velocity gradient can be expected to increase among the superficial, cooler layers, causing proportionally more heating there. Thus, the weakening of the C II doublet (first dip in Fig. 3) is consistent with a flattening of the gradient of the atmospheric temperature and line source functions.333A fact which may bear on this discussion is that to reproduce UV spectrophotometic signatures from line aggregates in BW Vul’s IUE/SWP-camera spectra, Smith (2001) found it necessary to impose arbitrarily an artificial steepening of the temperature gradient for a simulated model atmosphere at minimum light phase. This is equivalent to imposing a flattening of the gradient in the maximum light phase, as suggested from this optical study. Indeed, in the expectation of accompanying increased turbulence, it seems difficult to understand how the weakening could arise in any other way. The second dip of the C II curve features coinciding with the passage of the pulsation shock can be explained by a more fundamental characteristic: the shock has a tendency to be more nearly isothermal than in the preshock atmosphere.
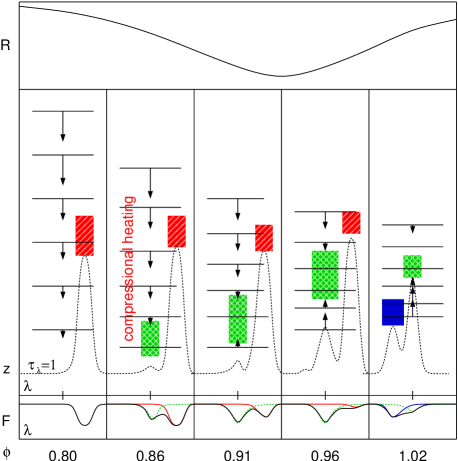
The above picture is sketched qualitatively in Figure 9. This illustration depicts the evolution of the stellar radius (top) and the absorption profiles (bottom) during five phases (), including one just prior to and one just following the primary shock passage interval. These line shapes may be compared to those in Fig. 7 or Fig. 1 of Mathias et al. (1998) and are additionally indicated as having blue-shifted, red-shifted and/or stationary components. The five central panels show a representation of several notional “layers”. From left to right, these are shown to be falling inwards (arrows), and then arrested and reversed by material moving upwards from beneath. Compression gives rise to heating and a flattening of the temperature gradient. In turn this gives rise to absorption in optically thin layers (), represented by a shaded rectangle (). Other line components are also represented, displaced according to whether they are formed in outflowing (blue-shifted, solid), stationary (no shift, shaded ) or infalling (red-shifted, shaded / ) material. The zero velocity reference position or, equivalently, the rest wavelength for the absorption line is marked at the bottom of each panel. On the basis of observations presented here, a broken line indicates where the atmosphere becomes optically thick across the line profile (). Whether absorption lines are formed in optically thick or thin layers is suggested by their proximity to this curve. In any case, while admitting the omission of critical details of transfer of photons across the profile as the line as it turns optically thick, it appears possible that we can understand the formation of the excess optically thin absorption in the blue wing of the He I lines as well as the weakening of the temperature-sensitive C II and Si II lines.
Suffice it to say that in contrast to the infall shock the heating associated with the infall shock in our picture will extend over a broader range of strata in the atmosphere at any given moment than heating from the primary shock. If the UVC and He II and Si II line curves are to be taken as diagnostics of atmospheric heating, the pulsation shock is more impulsive and liberates more heat per unit time than the infall shock. In contrast, according to the equivalent width curves of Si II 6371, the heating from the infall shock not only lasts longer, but by differing amounts from cycle to cycle. This suggests that the details of this heating are driven by the strength of the earlier pulsation wave. Also, as noted in 3.2.3, the velocity jump criterion leads to the opposite inequality of apparent shock strengths, with the radial velocity jump to the standstill (infall shock) being typically larger than the jump at the end of the standstill (primary shock). Since the velocity and equivalent width variations measure different types of shock properties, this apparent disagreement of the inequalities need not be a contradiction to the model.
5 Conclusions
In this paper we have emphasized the importance of shock heating accompanying the passage of both shocks through the formation regions of several lines having a large range of excitation potentials (0–41 eV). We have also pointed out by contrast that density variations are likely to play at most a minor role in the observed line strength changes. Several studies have remarked in the past on some of the optical and UV signatures we have discussed in detail, but the variations in the past were attributed to kinematical, density, and/or finite propagation velocity effects – rarely heating. Even the Young et al. (1987) study did not pursue the subject beyond noting that variations of temperature-sensitive lines. This general inattention to the subject was not made through an explicit error by any of these investigators. In fact, our own assessment of the importance of temperature effects could not have come about except through echelle observations over a broad wavelength range, particularly including the red He I lines. Even so, the observation that the He I lines show strength variations due to atmospheric heating cannot be the whole story. Indeed, the realization that the C II doublet weakens during both shocks, and that the line strengths are insensitive to temperature variations, has all but forced the idea that the atmospheric temperature gradient is likely to be substantially flattened during shock passages. The heating of the atmosphere causes the column length of excited atoms to increase, but at the same time it causes the line source function gradient to decrease slowly outwards, thereby producing line weakening of the saturated lines especially, such as the C II doublet.
With this rough sketch in mind, we believe the time is ripe for new investigations of BW Vul to undertake a more quantitative analysis. This can begin with the abandonment of a static model atmosphere treatment, at least for the phase intervals in which shocks affect the atmosphere’s thermal and density structure. Another logical step is to construct “toy atmospheres” in which radiative and/or hydrostatic equilibrium are abandoned to see what devices “work,” and to give some insight into the construction of a new generation of hydrodynamic models of shocks. A line synthesis from such kinematical atmospheres, in the spirit of Stamford & Watson’s early modeling, can point the way to a more correct treatment of line doubling/broadening and strenth variations. One aspect especially worth investigating is the effect of desaturation in various lines. One needs to know just how much pile-up material above the photosphere is required to give each type of lines a blue lobe strength that is some chosen fraction (say, one third) of the strength of the red lobe. In principle, combining these column densities with the observed rate of pile up at a given level will permit a test of our hypothesis that the Van Hoof effect in this star’s atmosphere is an artifact of the optical thinesses of the blue lobes of these lines.
In this paper the role of non-LTE has not been discussed. However, transfer of photons through the line profile is ultimately essential to the testing of our ideas of how the excess blue wing can develop in the He I lines during the double-lobed infall-shock phase ( = 0.9). The details of line transfer and amount of turbulence associated with the shocks are interrelated, and together they are critical to a description of these lines at these phases. Another aspect of non-LTE formation processes concerns the behavior of the He I lines during the low-density (maximum radius) phase. The equivalent widths of the triplet 5875 line give no indication that metastability is important in the lower level (23P) of this transition, as would be expected for low (supergiant-like) atmospheric densities. This fact certainly means that the densities at this phase are not “too low,” but what this means quantitatively needs to be demonstrated. An even more sensitive indicator of low densities is the He I 10830 line. Because of the importance of stimulated emission for infrared transitions, this feature is well known to exhibit a strong response to either “excess” absorption or emission.
The heating of the base and rapid-acceleration regions of the wind also remains to be evaluated. How hot these regions can become, and thus how much pulsational energy is dissipated in the atmosphere, can be addressed by far-UV (FUSE satellite) observations of the O VI resonance doublet.
Finally, one wonders about the effects of shocks in the outer atmospheres of other Cep variables. Campos & Smith (1981) and Smith (1983) examined high-resolution line profiles of several Cep stars and found signatures of velocity jumps they associated with shocks in either optical or UV lines of all five of the ones for which line profiles they examined. In an analysis of Eridani, Smith (1983) argued that rapid changes during key phases in the velocity curve and optical Si III line profiles of this star suggest the presence of atmospheric shocks, though not necessarily discontinuities in a radial velocity curve. Indeed, the equivalent width of the these lines grows probably due to the growth of a blue lobe. Unfortunately, other nonradial pulsation modes are likely to confuse the investigation of shock signatures. A more promising candidate may be another large-amplitude variable, Scorpii. Campos & Smith (1980) have observed red-wing emission in the Si III triplet lines of this star near minimum velocity phase. Could the heating associated with the pulsation shock in this star be occasionally so large as to produce emission? This star’s line profiles have apparently not yet been extensively monitored since, but it might be profitable to search for the cause of emission and to see how this relates to the larger-amplitude shock of BW Vul for which no emissions are observed.
Acknowledgments
We wish to express our thanks to the McDonald Telescope Allocation Committee for their granting of three nights of 2.1-meter telescope time. We are also grateful to Dr. Chris Johns-Krull for his reductions of the McDonald data to echellogram format. We thank Dr. Jeff Valenti for the loan of his interactive wavelength calibration program and Mr. Anthony Valenti for his time and instructions on the use of this program.
References
- [] Aerts, C., Mathias, P., Van Hoolst, T., De Mey, K., Sterken, C., & Gillet, D. 1995, A. & A., 301, 781
- [] Alvarez, R., Jorissen, A., Plez, B., Gillet, D., & Fokin, A. 2000, A. & A., 362, 655
- [] Burger, M., de Jager, C., van den Oord, G. H., Sato, N. 1982a, A. & A., 107, 320
- [] Burger, M., de Jager, C., van den Oord, G. H. 1982b, A. & A., 109, 289
- [] Campos, A. J., & Smith, M. A. 1980, ApJ, 238, 550
- [] Cohen, D. H. 2000, The Be Phenomenon in Early-Type Stars, ed. M. Smith, H. Henrichs, & J. Fabregat, ASP Conf. Ser., 214, 156
- [] Crowe, R., & Gillet D. 1989, A. & A., 211, 365
- [] Furenlid, I., Young, A., Meylan, T., Haag, C., & Crinklaw, G. 1987, ApJ, 319, 264
- [] Goldberg, B. A., Walker, G. A. H., & Odgers, G. J. 1976, AJ, 81, 433
- [] Garnier, D., Nardetto, N., Mathias, P., Gillet, D. & Fokin, A. B., Radial & Nonradial Pulsations as Probes of Stellar Physics, ed. C. Aerts, T. Bedding, & J. Christensen-Dalsgaard, 259, 206
- [] Hinkle, K., Wallace, L., Valenti, J., & Harmer, D. 2000, Visible & near-IR Atlas of the Arcturus Spectrum, ASP, …
- [] Horvath, A., Gherega, O., & Farkas, L. 1997, Rom. A. J., 8, 89
- [] Hubeny, I., Lanz, T., & Jeffery, S. 1994, Newslett. Anal. Atron. Spectra, 20, 30
- [] Kurucz, R.L. 1990, Trans. IAU, 20B, 169
- [] Liberman, M. A. & Velikovich, A. L. 1986, Physics of Shock Waves in Gases and Plasmas, (Berlin: Springer-Verlag).
- [] Massa, D. 1994, Ap. Space Sci., 221, 113
- [] Mathias, P., Gillet, D., Fokin, A. B., & Cambon, T. 1998 A. & A., 339, 525
- [] McCarthy, J. K., Sandiford, B. A., Boyd, D., & Booth, J. 1993, Pub. ASP, 105, 881
- [] Odgers, G. J. 1955, Pub. Dom. Ap. Obs.,10, 215
- [] Owocki, S. P., & Cranmer, S. R. 2002, Radial and Nonradial Pulsations as Probes of Stellar Physics, ASP Conf., ed. C. Aerts, T. Bedding, & J. Christensen-Dalsgaard, Vol. 259, 512
- [] Pigulski, A. 1993, A. & A., 274, 269
- [] Piskunov, N. E., & Valenti, J. A., 2002, A. & A., 385, 1095
- [] Smith, M. A. 1983, ApJ, 265, 338
- [] Smith, M. A. 2001, ApJ, 562, 998
- [] Sterken, C. 1993, A. & A., 270, 259
- [] Stamford, P. A., & Watson, R. D. 1978, Proc. Astron Soc. Australia, 3, 275
- [] Stamford, P. A., & Watson, R. D. 1981, Proc. Astron Soc. Australia, 4, 210
- [] Van Hoof, A., & Struve, O. 1953, Pub. ASP, 65, 158
- [] Young, A., Furenlid, I., & Snowden, M. S. 1981, ApJ, 245, 998 (YFS)