Carbon Abundances of Faint Stars in M13 - Evidence for Two Abundance Altering Mechanisms 11affiliation: Based on observations obtained at the W.M. Keck Observatory, which is operated jointly by the California Institute of Technology, the University of California, and the National Aeronautics and Space Administration.
Abstract
We present an analysis of CH band strengths in Keck LRIS spectra of a sample of 81 stars in M13 within 2 magnitudes of the main-sequence turnoff. The subgiants clearly exhibit a substantial (a factor of 6) spread in [C/Fe]. Moreover, the bulk of the subgiants possess C abundances larger than those found among their more luminous counterparts. The turnoff stars themselves are too warm for appreciable CH formation, but the relatively small range in the observed CH band strength for stars just below the turnoff nevertheless translates into this same spread in [C/Fe]. Still fainter, the sample size is small, but the same range in [C/Fe] appears to be present. On the basis of these observations we suggest that a process external to the present stars has resulted in a substantial star-to-star dispersion in [C/Fe] (and possibly other light elements) among all stars in M13. In addition, the surface C abundances among the more luminous stars have been further modified by the operation of an internal deep-mixing mechanism during red giant branch ascent. The amplitude of the scatter we find in [C/Fe] at all luminosities may prove difficult to explain via accretion from intermediate mass AGB stars as the external “polluting” mechanism.
1 INTRODUCTION
A detailed history of the thirty years of progress in our understanding and interpretation of the compositions of globular cluster stars is far too long and complex to offer in the present work. Hence we present below only the shortest of summaries. For a more proper treatment, we recommend to the reader the more comprehensive reviews of Kraft (1994) and Da Costa (1998).
Contrary to the canonical picture of globular clusters as chemically homogeneous populations of stars, significant star-to-star differences in the abundances of C, N, and often other light elements associated with proton capture reactions, have been found in every Galactic globular cluster studied to date. Locked within these inhomogeneities appears to be at least a partial history of processes at work in the early cluster environment. However, these patterns are also likely subject to further modification driven by a less than well-understood mixing mechanism at work within the stars themselves. With this in mind, intra-cluster abundance inhomogeneities are usually discussed in terms of these two distinct origins: internal post-first dredge-up “deep mixing” or a process external to the present day cluster stars (e.g., the accretion of ejecta from more massive stars).
In the case of deep mixing, material exposed to the CN (and possibly ON) cycle regions above the H-burning shell of an evolving low-mass star is circulated into the outer convective envelope during red giant branch (RGB) ascent resulting in increased surface N abundances at the expense of C (and possibly O). Observational evidence that such a process operates can be found among low-mass metal-poor ( [Fe/H]) field giants where Gratton et al. (2000) note lowered C abundances, enhanced N, depleted Li, and lower 12C/13C ratios than expected from first dredge-up (see also Charbonnel & do Nascimento, 1998; Keller, Pilachowski, & Sneden, 2001). Mixing may be even more efficient in the metal-poor ( [Fe/H]) globulars where substantial decreases in [C/Fe] ( 1 dex) with increasing luminosity have been observed along the RGBs of M92 (Bellman et al., 2001), M15 (Trefzger et al., 1983), and NGC 6397 (Briley et al., 1990). Mixing has also been suggested as an explanation for the detections of O underabundances and O-Na, Al-Mg anticorrelations among the bright giants of numerous globular clusters, e.g. M5, M3, M10, M13 (see the composite figure for O-Na relations assembled by Ramírez & Cohen, 2002, their Fig. 12, and references therein) - trends notably absent from the field population (Gratton et al., 2000). If proton capture reactions on Ne and Mg resulting in Na and Al are also operating at ON-cycle temperatures (Cavallo & Nagar, 2000, and references therein) one could then expect the abundance patterns observed in most cluster giants to be at least qualitatively reproduced under the conditions of sufficiently deep mixing.
But the underlying physical process connecting the shell region with the envelope beyond first dredge-up is not included in standard models of low mass stellar evolution and remains poorly understood. Some possible mechanisms explored include meridional circulation (Sweigart & Mengel, 1979), various treatments of diffusion (e.g. Charbonnel, 1995; Denissenkov & Tout, 2000), and shell flashes (Aikawa, Fujimoto, & Kato, 2001) - see the review of the theory of red giant branch stars by Salaris, Cassisi, & Weiss (2002) for a more through discussion.
As early as 24 years ago it was known that the subgiant branch (SGB) stars and likely the main-sequence (MS) stars of the metal-rich ([Fe/H]) cluster 47 Tuc exhibit C and N differences similar to those found on its RGB (Hesser, 1978). These results have been confirmed by Cannon et al. (1998, and references therein), and significant C/N inhomogeneities among SGB and MS stars have since been observed in NGC 6752 and M5 (Suntzeff & Smith, 1991; Cohen, Briley, & Stetson, 2002), and M71 (Cohen, 1999a). Variations in other light elements have also been noted among the SGB/MS stars of these very clusters: Na-CN correlated on the MS of 47 Tuc (Briley et al., 1996), O-Na and Mg-Al anticorrelated among the MS stars of NGC 6752 (Gratton et al., 2001), and O-Na anticorrelated in M71 SGB stars (Ramírez & Cohen, 2002). Most recently, Ramírez & Cohen (2003) have shown a significant dispersion in Na extending from the M5 RGB to its MS turnoff. These inhomogeneities are of course difficult to explain within the framework of mixing theories and imply that some component of the abundance differences is in place well before appreciable RGB ascent, possibly embedded in the present-day stars much earlier in the cluster history. Indeed, the nuclei observed to vary among the SGB/MS stars, i.e., C, N, O, Na, Al, and Mg, suggest as a source the hot bottom burning regions of intermediate mass asymptotic giant branch (AGB) stars (Ventura et al., 2001). As put forth by Cottrell & Da Costa (1981), the proton-exposed ejecta from such stars may then have been accreted by and thus “polluted” the present day cluster stars (see Cannon et al., 1998, for a more thorough discussion).
It has become increasingly clear that a full description of cluster abundance inhomogeneities requires an understanding of the extent of the contributions of both deep internal mixing and external sources of chemical differences. Unfortunately, the same reaction chains (proton captures on C, N, O, Ne and Mg) appear to be associated with both mechanisms. Perhaps the only method of disentangling the role of each process is to compare the abundances of the less luminous cluster stars with their more evolved counterparts. Because of the strength of the CH band, for technical reasons this is easier to accomplish at present for C than for the other light elements listed above.
In this regard, the globular cluster M13 provides us with a particularly interesting target. With an overall metallicity of [Fe/H]= dex (Kraft et al., 1992), it is perhaps one of the most thoroughly studied “intermediate metallicity” clusters. It has long been known to contain giants with a large and bimodal spread in CN band strengths, anticorrelated with CH, whose origin lies in an apparent C-N anticorrelation (e.g. Smith et al., 1996). In addition, among its RGB stars, large111As commented by Kraft et al. (1997), the M13 RGB stars exhibit some of the largest inhomogeneities known. O differences are present (anticorrelated with N), as well as significant star-to-star scatter in Na and Al (Na anticorrelated with Mg and correlated with O, see Kraft et al., 1997; Cavallo & Nagar, 2000). Such observations are suggestive of the mixing of proton exposed material to the surfaces of some cluster members and there is evidence of shifts towards lower O and higher Na and Al abundances among the most luminous RGB stars () (Pilachowski et al., 1996; Kraft et al., 1997; Cavallo & Nagar, 2000). Yet, at the same time, a large dispersion in these elements is present in the data of Kraft et al. to at least within a 0.25 mag of the luminosity function (LF) bump at (Paltrinieri et al., 1998). A large scatter in C and N abundances was also followed to a similar luminosity by Suntzeff (1981). Grundahl,VandenBerg, & Andersen (1998) found scatter in Strömgren photometry among the RGB and SGB stars in M13 which they attributed to a spread in CNO abundances probably extending at least to the main-sequence turnoff.
We report here on recent observations and derived C abundances of a sample of SGB/MS stars in the globular cluster M13 which appear to support the hypothesis of a substantial intrinsic spread in the distribution of light elements within the cluster which is further modified during RGB ascent.
2 OBSERVATIONS
The construction of the photometric catalog used here for M13 is described in Stetson, Hesser, & Smecker-Hane (1998) and Stetson (2000) and is similar to that built for M5 and described in detail in our earlier work (Cohen et al., 2002). Slitmasks were designed focusing on the subgiants in M13 and on the region just below the turnoff. We note that the base of the RGB in M13 is at about V = 17.7, I = 16.9, while the MSTO is at about V = 18.2, I = 17.8.
These slitmasks were used on the blue side (McCarthy et al., 1998) of LRIS (Oke et al., 1995) at the Keck Telescope in May 2001 and in May 2002. As the weather was sub-optimal, four 1000 sec exposures were obtained with the slitmask intended for the fainter stars. The 600 g/mm grism was used with a 0.7 arcsec wide slit, yielding a dispersion of 1.0 Å/pixel, and a spectral resolution of 4Å. The spectral coverage was from 3500 to 5500 Å for essentially all the stars. There are 81 stars with spectra good enough for present purposes, namely more than 450 ADU/pixel (with 2 /ADU) in the continuum at 4360 Å.
Non-members are very easily recognized due to the low metallicity of M13 and its large negative radial velocity. Since the stars were selected to lie on the cluster isochrone and M13 is at high galactic latitude, one would expect very few non-members. All of the stars in the sample presented here are members of M13. Full details of the sample of stars and the observations will be given in a forthcoming paper.
3 ANALYSIS
Our analysis essentially parallels that of Briley & Cohen (2001, hereafter BC01) and the reader is referred to that work for details.
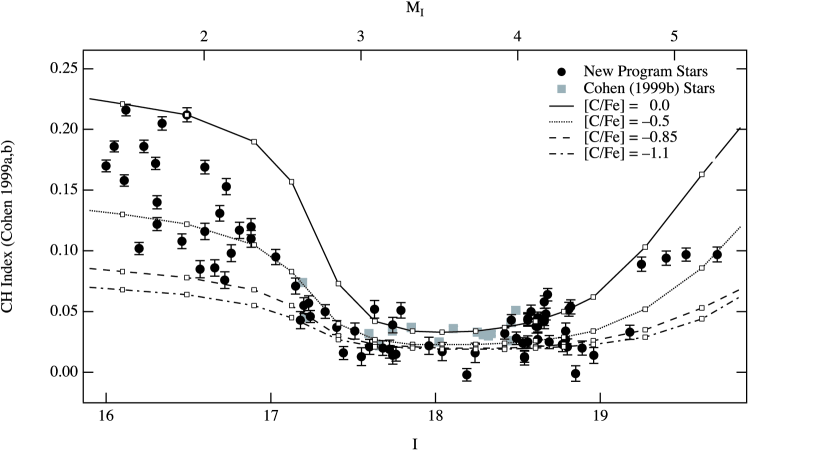
The strengths of the 4350Å CH (G) bands of our program stars were measured via the I(CH) index of Cohen (1999a, b) - a double sided index which compares the flux removed by the G-band to the adjacent continuum. The resulting indices (corrected for the radial velocity of M13) are plotted as a function of I magnitude in Figure 1, where a significant spread among both the SGB and MS stars can be seen. As is discussed in BC01, the decrease in the spread in I(CH) near is the result of the high temperatures and low metallicities of the M13 MS turnoff stars (i.e., there simply is little CH formation in such stars).
In order to relate the observed indices to the underlying [C/Fe], we employ a series of synthetic spectra based on MARCS (Gustafsson et al., 1975) model atmospheres. We assume that the iron abundance is constant within M13 as suggested by the high dispersion spectroscopic studies of low luminosity globular cluster samples by Gratton et al. (2001) and by Ramírez & Cohen (2002, 2003). Our MS turnoff models are those used in BC01 to which we have added an additional 3 luminous SGB models (at /log()= 5168/2.96, 5224/3.15, 5281/3.33) and 5 fainter MS points (at 6118/4.47, 6034/4.53, 5833/4.59, 5601/4.66, 5351/4.70) taken from the 16 Gyr [Fe/H]= 1.48 O-enhanced isochrone grid of Bergbusch & Vandenberg (1992). As in BC01, we adopt a geometric distance of 7.2 kpc (plus an additional 0.11 magnitudes in ) and a reddening of E() = 0.02 magnitudes following Harris (1996).
From each model and a given set of C/N/O abundances, synthetic spectra were computed using the SSG program (Bell, Paltoglou, & Tripicco, 1994, and references therein) and the linelist of Tripicco & Bell (1995) (see BC01 for further details). The result was then convolved with a Gaussian to match the resolution of the observed spectra and I(CH) indices measured. Four compositions are illustrated here ([C/Fe]/[N/Fe]/[O/Fe]): and which (as in BC01) roughly match the observed compositions of M13’s CN-weak and strong bright giants respectively, an arbitrary “pre-mixing” composition, and a redistribution of the “pre-mixing” composition holding the sum of C+N+O constant. The curves plotted in Figure 1 are I(CH) indices calculated from these synthetic spectra where it can be seen that the small scatter in I(CH) among the MS turnoff stars is due to the intrinsic weakness of the G-band, rather than an absence of inhomogeneities (as pointed out by BC01).
Note that among such warm relatively metal-poor stars the resulting indices are remarkably insensitive to all but our choice of [C/Fe]. This is the result of the low metallicity; CN and CO play a less important role in the molecular equilibrium for carbon. For example, using the 5281/3.33 model () with as a baseline, increasing [O/Fe] by 0.4 dex decreases I(CH) by 0.006, decreasing [N/Fe] by 1.4 dex increases I(CH) by 0.006, and increasing 12C/13C to 90 has essentially no effect. The greatest sensitivity appears to be to microturbulence (), as increasing from 1.5 to 2.5 km s-1increases I(CH) by 0.010 (an 8% increase), which is negligible compared to the changes resulting from different values of [C/Fe].
We have applied the method of Briley et al. (1990) to convert the observed I(CH) indices to corresponding C abundances: the model isoabundance curves were interpolated to the of each program star, and the observed I(CH) index converted into [C/Fe] based on the synthetic indices at that . As such, we are assuming that a given star’s maps to the , log(), and mass specified by the Bergbusch & Vandenberg (1992) isochrone based on our calculation of model luminosity/color and choice of distance modulus and reddening. Returning to the 5281/3.33 model (the faintest model used in deriving SGB [C/Fe]), we note that an underestimation in of 100K would correspond to an error of +0.03 in and a derived [C/Fe] some 0.12 dex too large at [C/Fe] . Likewise, an underestimation of log() by 0.1 dex would be equivalent to a shift of in and dex in [C/Fe]. Essentially identical changes result when considering our most luminous SGB model (5168/2.96). Thus if one takes 100K and 0.1 dex as reasonable errors in and log(), we estimate our uncertainties in [C/Fe] to be roughly 0.1 dex.
4 RESULTS
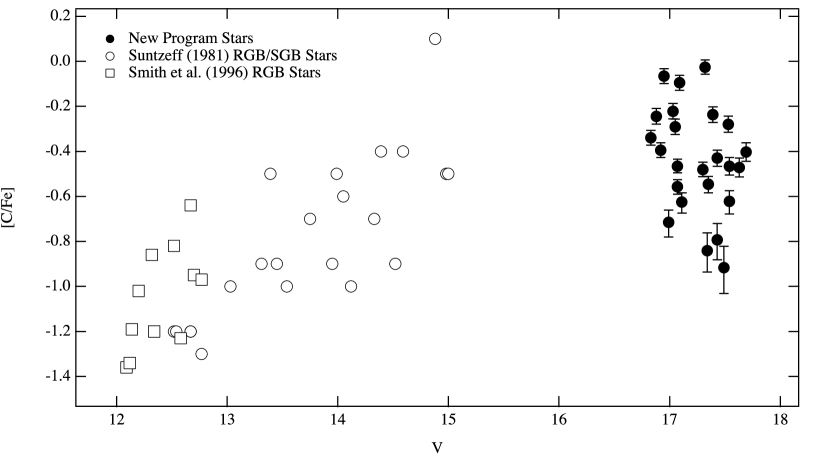
The resulting [C/Fe] values for the subgiants only are plotted in Figure 2, as well as the [C/Fe] values derived by Suntzeff (1981) and Smith et al. (1996) for more luminous cluster members. Immediately obvious from Figure 2 is a marked decline in [C/Fe] with increasing luminosity among the M13 giants - the mean [C/Fe] of Sunzteff’s “RGB” sample is dex, while for the present SGB stars the value is dex. This pattern in [C/Fe] was noted by Suntzeff, but the depletions appear to set in at a luminosity below the limit of his sample. Such as result can most easily be understood in the context of the deep-mixing framework where C-depleted material from the CN-burning region above the H-burning shell is progressively circulated into the stellar envelope as discussed above. We note however that changes in the distribution of O, Na and Al in M13 are suggested by Pilachowski et al. (1996), Kraft et al. (1997), and Cavallo & Nagar (2000) to occur only among its most luminous giants, i.e., which is also the point at which the C abundances drop precipitously in Figure 2. It would thus appear that during the bulk of RGB ascent, mixing only into CN-cycle regions is taking place in M13.
At the same time, a large scatter in [C/Fe] (roughly 0.8 dex), comparable to that found among the more luminous stars, is present in the LRIS SGB sample in Figure 2. Figure 1 further suggests a large dispersion in C abundance is also present at luminosities below the MS turnoff. (We have no information on N abundances at present.) These inhomogeneities are in place well below the LF bump and the operation of proposed deep mixing mechanisms. Thus it appears that the action of an external process has shaped much of the star-to-star scatter present in M13, i.e., the large range of C, and likely other light abundances found among the giants (at least fainter than ) is to a great extent not the result of varying mixing efficiencies within the stars themselves.
If we assume the initial [C/Fe] values to be roughly solar in the proto-M13 gas cloud, the C-poor stars in our sample might be explained by the incorporation of C-poor, N-rich AGB ejecta. However, the large spread in C abundances seen here requires far more than the “pollution” of the stellar surfaces by simple accretion of AGB ejecta - such surface contaminations would be quickly erased by the deepening convective envelope following the MS phase. This is clearly not observed and a substantial fraction of the stars’ total mass must therefore be homogeneous in these elements. This in turn requires the accretion of not just of a sprinkling but rather of a significant amount of material: if we consider a typical C-poor M13 star ([C/Fe] ), some 70% of the star’s mass must be captured ejecta (assuming the accreted matter to be completely free of C). While this initially seems implausible, we note the recent calculations of Thoul et al. (2002) which demonstrate that large accumulations may be possible, particularly in clusters with small core radii, e.g. 47 Tuc where they estimate as much as 80% of the mass of a 1 M⊙ star could be accreted material. Unfortunately, the core radius of M13 is considerably larger, and similar calculations yield an expected accretion of only 8%. Whether this is a problem that can be overcome with more detailed accretion models (e.g., Thoul et al. included several assumptions such as chaotic orbits with stars spending 20% of their time in the cluster core, which was also the spatial extent of the central gas reservoir), a reflection of changes in the structure/dynamics of M13 since its formation, or can be better explained by an alternative mechanism remains to be seen.
The work presented here implies we are seeing the effects of a significant external “contamination” of unexplained origin upon which a poorly understood mixing mechanism acts during the later stages of RGB ascent. However, there remain a number of issues to address: The critical region just fainter than the M13 LF bump at has yet to be explored, leaving the exact luminosity of C-depletion onset uncertain. Also, in comparing the present results with those of Suntzeff (1981) and Smith et al. (1996), we are comparing abundances based on different instruments, indices, and analysis tools - note the apparent 0.3 dex offset between the C abundances of Suntzeff and Smith in Figure 2. Furthermore, we urgently need a larger sample of stars below the MSTO in M13. To address these items, we will be returning to M13 in the near future.
References
- Aikawa et al. (2001) Aikawa, M., Fujimoto, M. Y., & Kato, K. 2001, ApJ, 560, 937
- Bell et al. (1994) Bell, R. A., Paltoglou, G., & Tripicco, M. J. 1994, MNRAS, 268, 771
- Bellman et al. (2001) Bellman, S., Briley, M. M., Smith, G. H. & Claver, C. F., 2001, PASP, 113, 326
- Bergbusch & Vandenberg (1992) Bergbusch, P. A & Vandenberg, D. A., 1992, ApJS, 81, 163
- Briley et al. (1990) Briley, M. M., Bell, R. A., Hoban, S., Dickens, R. J. 1990, ApJ, 359, 307
- Briley & Cohen (2001) Briley, M. M., & Cohen, J. G. 2001, AJ, 122, 1429
- Briley et al. (1996) Briley, M. M., Smith, V. V., Suntzeff, N. B., Lambert, D. L., Bell, R. A. & Hesser, J. E., 1996, Nature, 383, 604
- Cannon et al. (1998) Cannon, R. D., Croke, B. F. W., Bell, R. A., Hesser, J. E. & Stathakis, R. A., 1998, MNRAS, 298, 601
- Cavallo & Nagar (2000) Cavallo, R. M., & Nagar, N. M. 2000, AJ, 120, 1364
- Charbonnel (1995) Charbonnel, C., 1995, ApJ, 453, L4
- Charbonnel & do Nascimento (1998) Charbonnel, C., & do Nascimento, J. D. 1998, A&A, 336, 915
- Cohen (1999a) Cohen, J. G., 1999a, AJ, 117, 2434
- Cohen (1999b) Cohen, J. G., 1999b AJ, 117, 2428
- Cohen et al. (2002) Cohen, J. G., Briley, M. M., & Stetson, P. B. 2002, AJ, 123, 2525
- Cottrell & Da Costa (1981) Cottrell, P. L., & Da Costa, G. S. 1981, ApJ, 245, L79
- Da Costa (1998) Da Costa, G. S. 1998, in Proceedings of IAU Symposium 189, On Fundamental Stellar Properties: The Interaction between Observation and Theory, eds. T. R. Bedding, A. J. Booth & J. Davis (Kluwer:Dordrecht), p. 193
- Denissenkov & Tout (2000) Denissenkov, P. A., & Tout, C. A. 2000, MNRAS, 316, 395
- Gratton et al. (2001) Gratton, R. G. et al., 2001, A&A, 369, 87
- Gratton et al. (2000) Gratton, R. G., Sneden, C., Carretta, E. & Bragaglia, A. 2000, A&A, 354, 169
- Grundahl et al. (1998) Grundahl, F. VandenBerg, D. A., & Andersen, M. L. 1998, ApJ, 500, L179
- Gustafsson et al. (1975) Gustafsson, B., Bell, R. A., Eriksson, K., & Nordlund, Å 1975, A&A, 42, 407
- Harris (1996) Harris, W. E. 1996, AJ, 112, 1487
- Hesser (1978) Hesser, J. E., 1978, ApJ, 223, L117
- Keller et al. (2001) Keller, L. D., Pilachowski, C. A., & Sneden, C. 2001, AJ, 122, 2554
- Kraft (1994) Kraft, R. P. 1994, PASP, 106, 553
- Kraft et al. (1992) Kraft, R. P., Sneden, C., Langer, G. E., & Prosser, C. F. 1992, AJ, 104, 645
- Kraft et al. (1997) Kraft, R. P., Sneden, C., Smith, G. H., Shetrone, M. D., Langer, G. E., & Pilachowski, C. A. 1997, AJ, 113, 279
- McCarthy et al. (1998) McCarthy, J. K., et al. 1998, SPIE, 3355, 81
- Oke et al. (1995) Oke, J. B., et al. 1995, PASP, 107, 375
- Paltrinieri et al. (1998) Paltrinieri, B., Ferraro, F. R., Carretta, E., Fusi Pecci, F. 1998, MNRAS, 293, 434
- Pilachowski et al. (1996) Pilachowski, C. A., Sneden, C., Kraft, R. P., & Langer, G. E. 1996, AJ, 112, 545
- Ramírez & Cohen (2002) Ramírez, S. V. & Cohen, J. G., 2002 AJ, 123, 3277
- Ramírez & Cohen (2003) Ramírez, S. V. & Cohen, J. G., 2003 AJ, submitted
- Salaris et al. (2002) Salaris, M., Cassisi, S., & Weiss, A. 2002, PASP, 114, 388
- Smith et al. (1996) Smith, G. H., Shetrone, M. D., Bell, R. A., Churchill, C. W., & Briley, M. M. 1996, AJ, 112, 1511
- Stetson (2000) Stetson, P.B., 2000, PASP, 112, 925
- Stetson et al. (1998) Stetson, P.B., Hesser, J.E. & Smecker-Hane, T., 1998, PASP, 110, 533
- Suntzeff (1981) Suntzeff, N. B., 1981, ApJS, 47, 1
- Suntzeff & Smith (1991) Suntzeff, N. B. & Smith, V. V. 1991, ApJ, 381, 160
- Sweigart & Mengel (1979) Sweigart, A. V. & Mengel, J. G., 1979, ApJ, 229, 624
- Thoul et al. (2002) Thoul, A., Jorissen, A., Goriely, S., Jehin, E., Magain, P., Noels, A., & Parmentier, G. 2002, A&A, 383, 491
- Trefzger et al. (1983) Trefzger, C. F., Carbon, D. F., Langer. G. E., Suntzeff, N. B. & Kraft, R. P., 1983, ApJ, 266, 144
- Tripicco & Bell (1995) Tripicco, M. J., & Bell, R. A. 1995, AJ, 110, 3035
- Ventura et al. (2001) Ventura, P., D’Antona, F., Mazzitelli, I., & Gratton, R. 2001, ApJ, 550, L65